SK Hynix’s $26.5B Nasdaq Listing Shatters ADR Demand Records
8 hrs ago

Three of the world’s four largest sovereign bond markets are flashing the same signal at the same time. The US 30-year Treasury yield has pushed above 5.1%. The UK 10-year gilt has reached its highest level since 2008. Japan’s 30-year government bond has climbed to yields not seen since the instrument first traded in 1999. This is not a single-country story or a routine fluctuation in government bond yields. It is a synchronised repricing of sovereign debt across three continents, driven by a geopolitical shock, the Strait of Hormuz disruption and the resulting 50% surge in Brent crude, that is forcing central banks to reconsider rate paths they had only recently softened.
What follows explains what government bond yields actually are and why they move, why the current spike is historically unusual, what it means for mortgages, borrowing costs, and equity portfolios, and how the world’s largest institutional investors are repositioning in response.
A government bond is, at its simplest, a loan from an investor to a government. The government promises to pay a fixed amount of interest (the coupon) at regular intervals and to return the original amount (the face value) at a set maturity date.
The yield is where the concept becomes counterintuitive. When a bond’s market price falls, its yield rises, because the same fixed coupon payment now represents a larger percentage of what a buyer actually paid.
The inverse relationship between bond price mechanics and yield is the single most counterintuitive concept in fixed income: when a bond’s market price falls, its yield rises, because the fixed coupon now represents a larger return on a smaller purchase price, and this mechanic governs every headline about sovereign debt selling off.
A concrete example makes this clear:
| Bond Price | Fixed Annual Coupon | Yield |
|---|---|---|
| $1,000 (at par) | $50 | 5.0% |
| $900 (below par) | $50 | 5.6% |
| $1,100 (above par) | $50 | 4.5% |
When investors sell bonds, prices fall and yields rise. That single mechanic explains every headline about “yields surging” or “bond markets selling off.” The US 10-year Treasury yield stood at 4.597% as of 15 May 2026, a number that matters far beyond the bond market itself.
The 10-year yield functions as the base rate from which nearly every other borrowing cost in the economy is derived. Mortgage lenders price home loans above it. Corporate bond issuers pay a spread on top of it. Equity analysts use it as the risk-free rate in the discount models that value every listed company.
When the risk-free rate rises, every other asset must offer a higher return to compete. That single transmission mechanism is why a move in government bond yields ripples instantly across mortgages, corporate debt, and stock markets worldwide.
The causal chain from geopolitics to bond markets runs through five links:
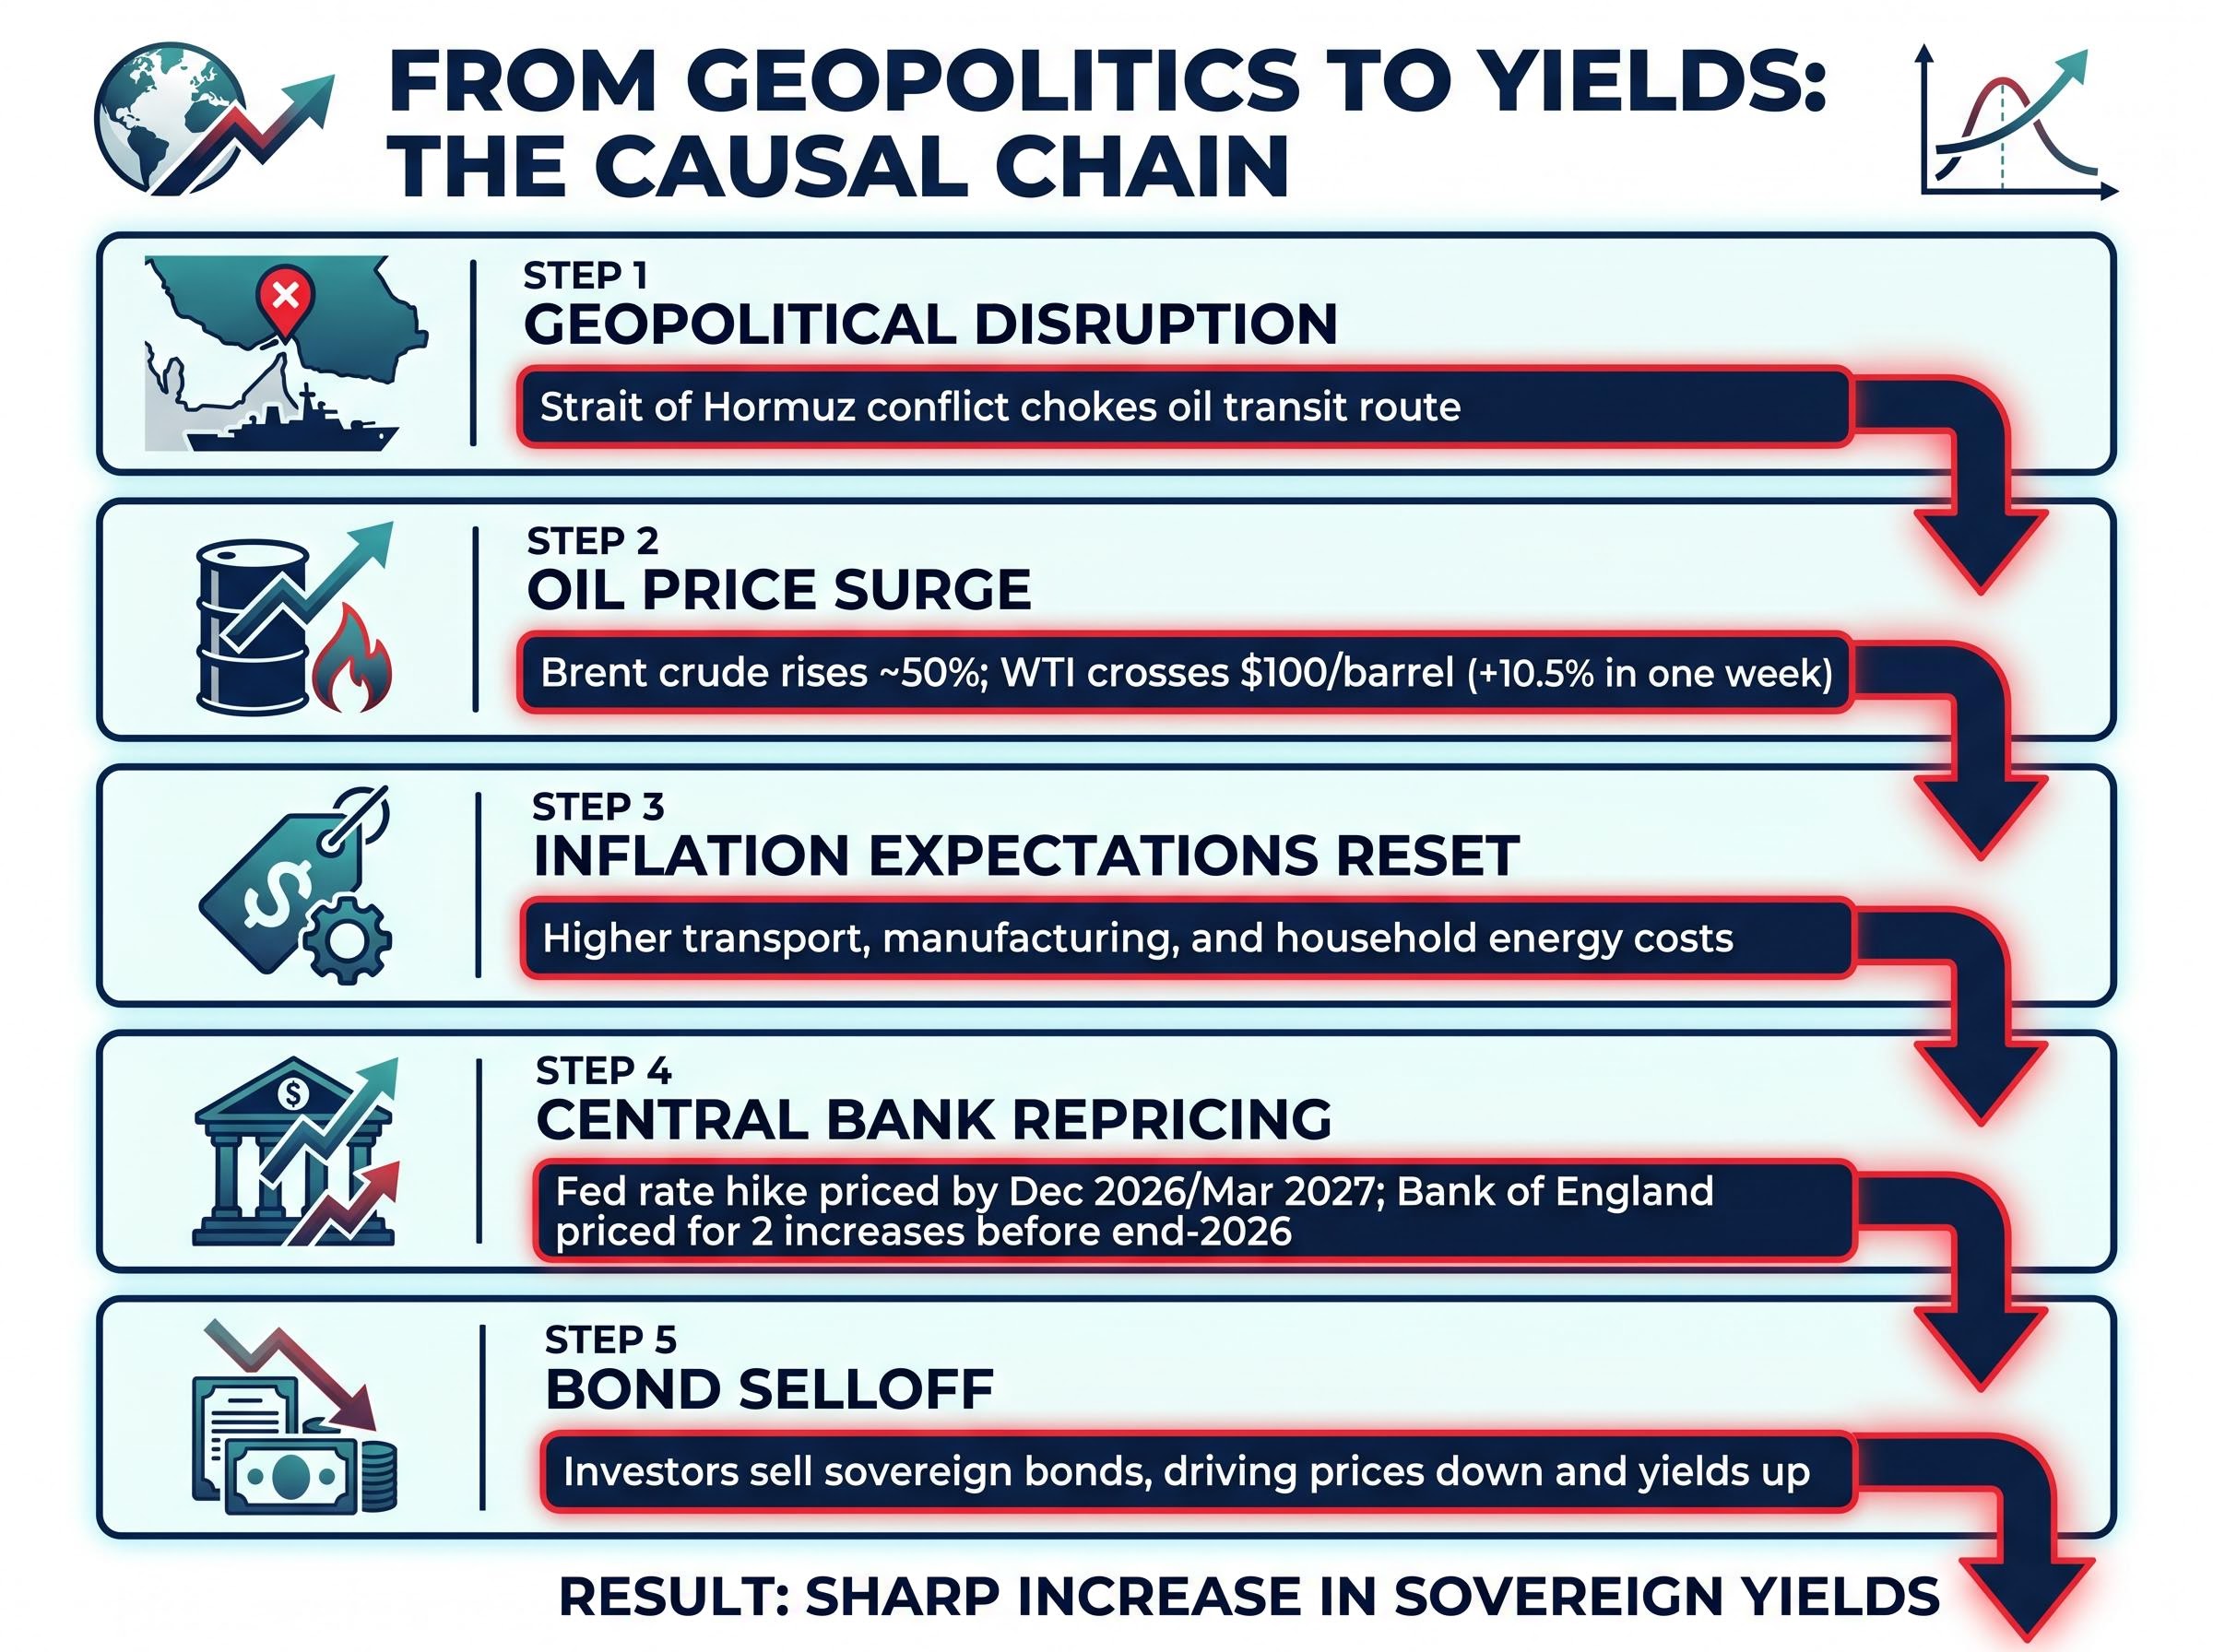
Brent crude has surged approximately 50% above pre-war levels, in what the International Energy Agency has described as the largest oil supply disruption on record.
Each link reinforces the next. Higher energy costs raise inflation expectations. Higher inflation expectations force central banks to signal tighter policy. Tighter policy expectations cause investors to demand higher yields on government debt, pushing bond prices lower.
The IEA May 2026 Oil Market Report characterised cumulative oil supply losses from the Strait of Hormuz disruption as the largest in the agency’s recorded history, a designation that anchors the scale of the inflationary shock now feeding into sovereign bond markets.
The central bank repricing has been sharp. Swap markets as of mid-May assigned roughly a two-thirds probability to a Federal Reserve rate increase by December 2026, with a full hike priced by March 2027. The Bank of England was being priced for at least two rate increases before end-2026.
The Trump-Xi summit produced only a verbal acknowledgement that the Strait should reopen, with no actionable framework established. That diplomatic impasse has sustained the supply disruption and, by extension, the bond market pressure.
The numbers across all three markets carry weight that becomes visible only against their historical benchmarks.
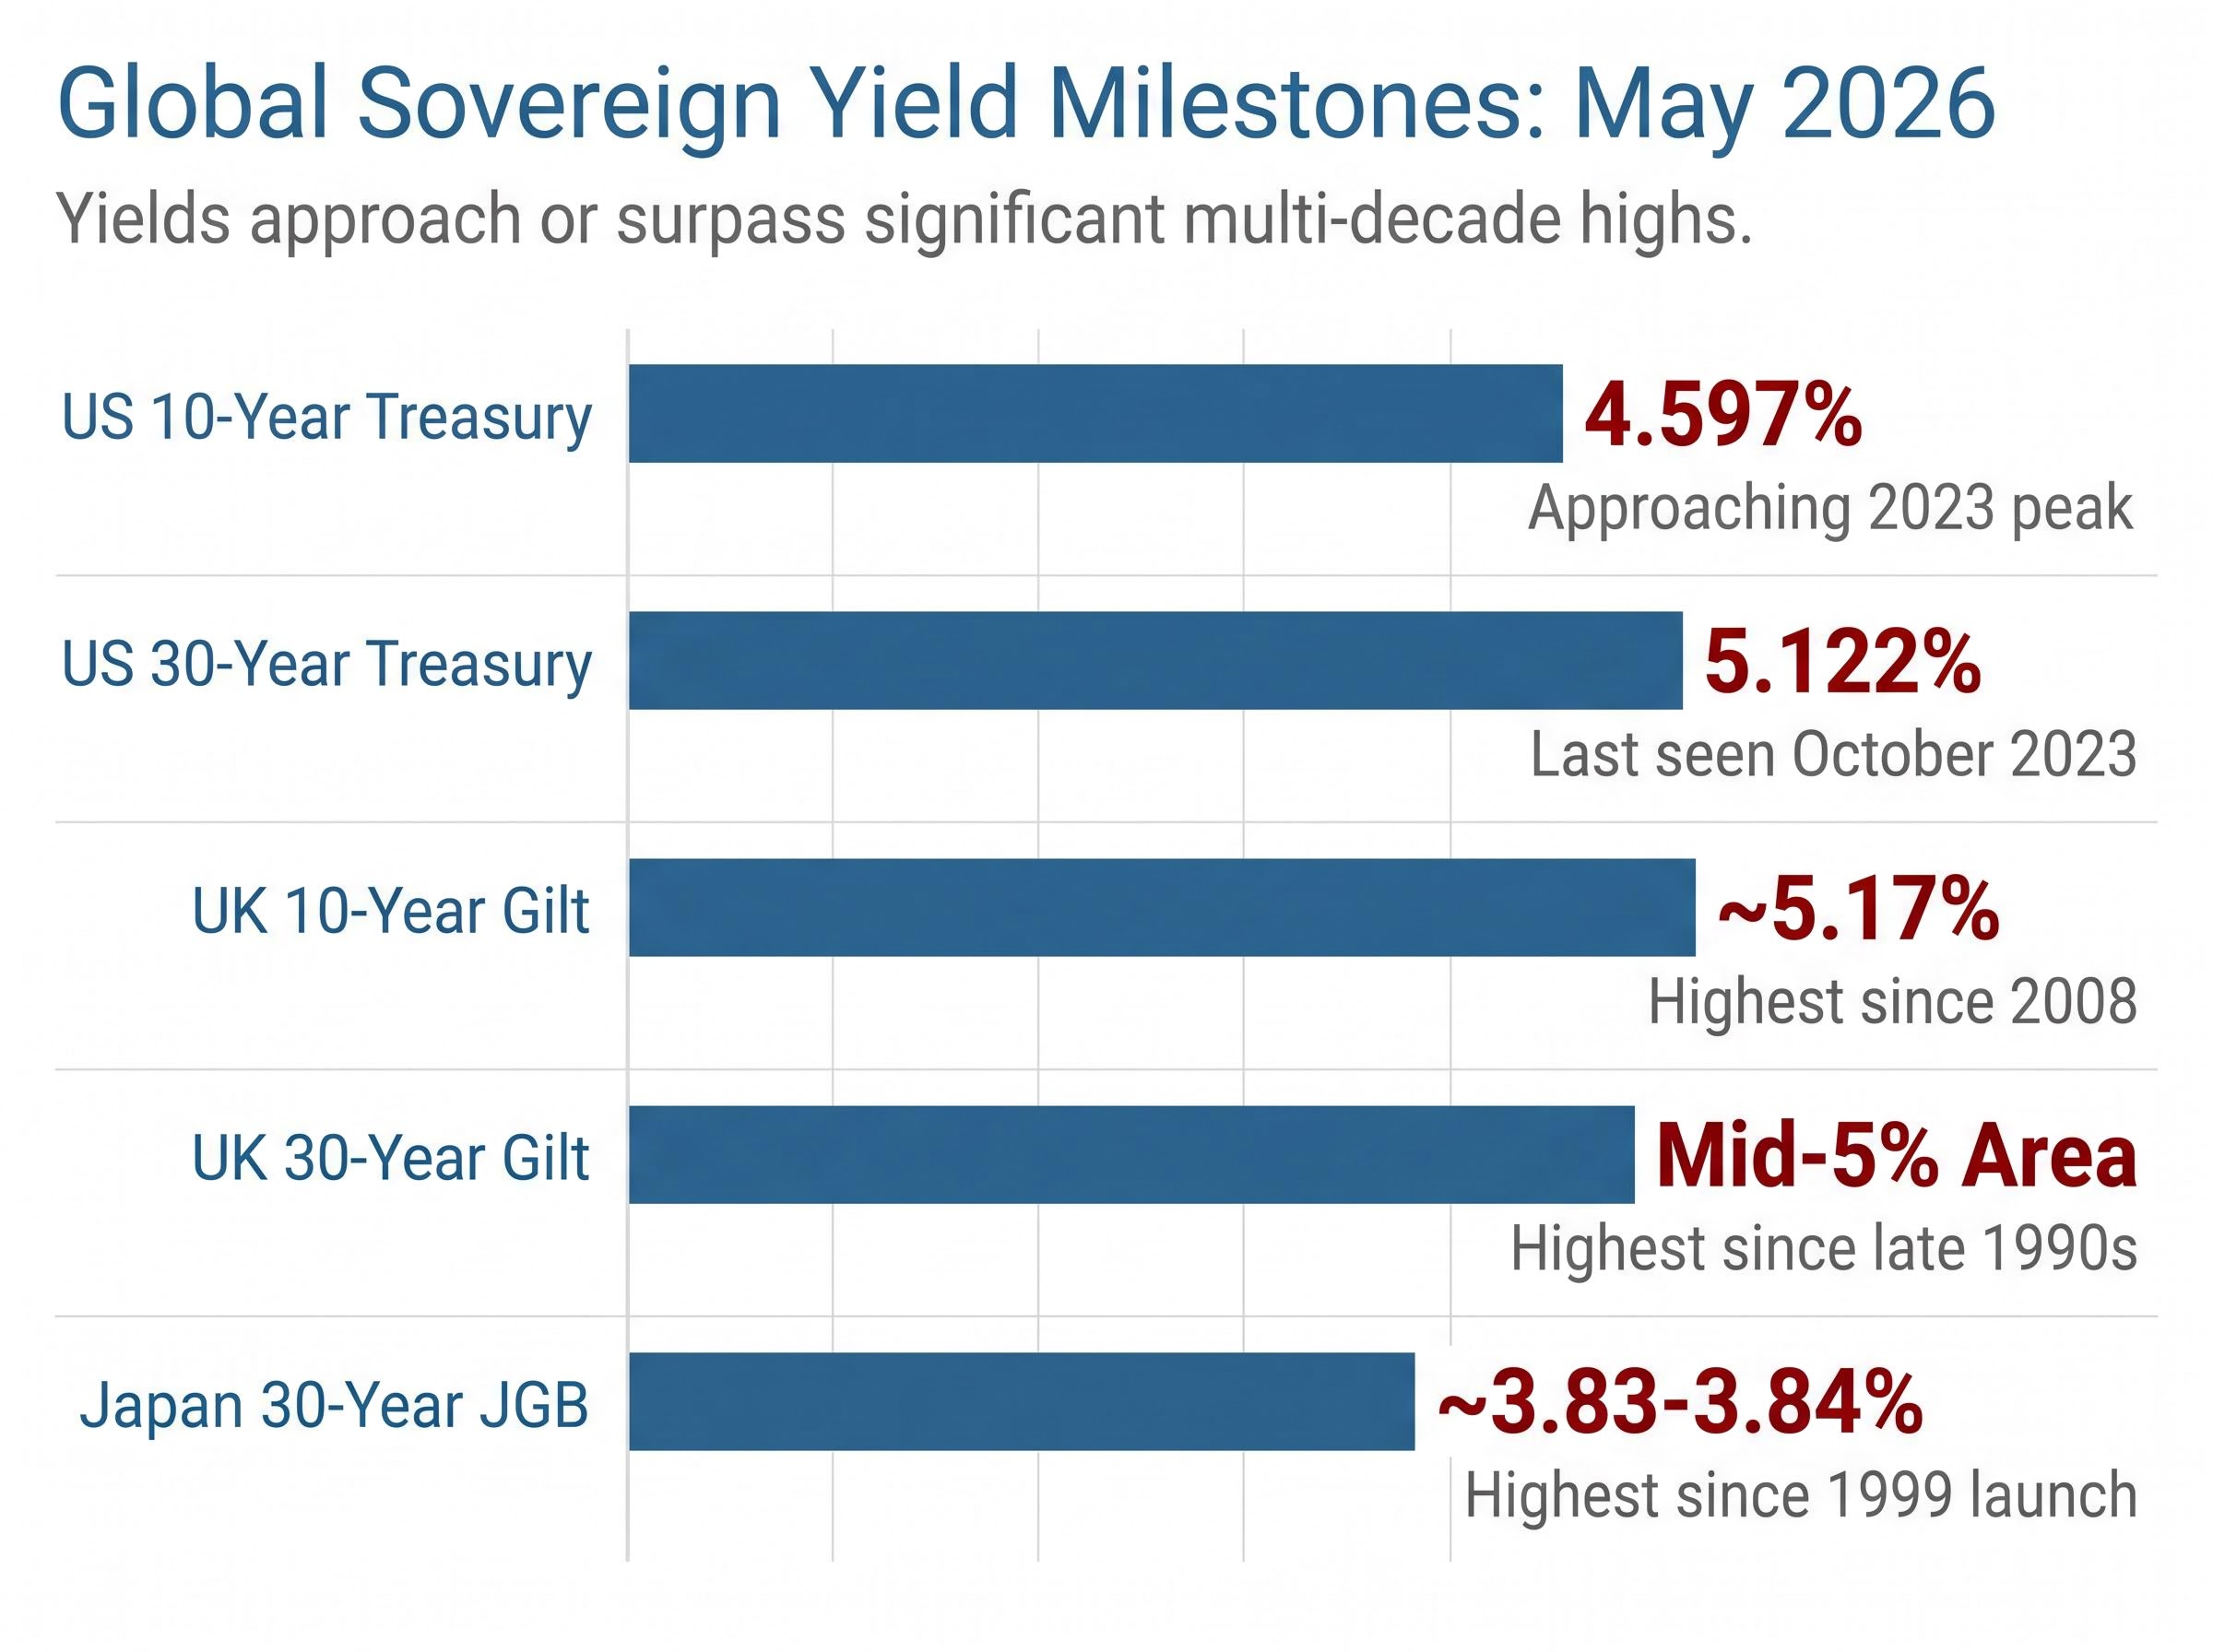
| Market | Instrument | Current Yield | Historical Benchmark | Last Seen at This Level |
|---|---|---|---|---|
| United States | 10-year Treasury | 4.597% | Sharpest weekly rise since April 2025 tariff shock | Approaching 2023 peak |
| United States | 30-year Treasury | 5.122% | Near 2023 cycle high | October 2023 |
| United Kingdom | 10-year gilt | ~5.17% | Highest since the global financial crisis | 2008 |
| United Kingdom | 30-year gilt | Mid-5% area | Highest in approximately 28 years | Late 1990s |
| Japan | 30-year JGB | ~3.83-3.84% | Highest since 1999 launch | Never previously reached |
Analysts are comparing this selloff to three prior episodes, each of which moved through sovereign bond markets with comparable force but for different reasons:
The Japan data adds a dimension that the prior episodes lacked. Japan’s 40-year JGB yield has reached its highest level since the instrument’s 2007 launch, and the 20-year JGB has climbed to levels not seen since 1996. A bond market selloff that reaches Japan at this magnitude signals that the repricing has become genuinely global.
The transmission runs through three channels:
Rising sovereign yields transmit directly into household balance sheets through mortgage rate decisions, and at the 30-year fixed rate of 6.37% prevailing in May 2026, the mathematical spread between prepaying principal and investing the difference has compressed to under 0.5 percentage points for most taxable accounts, a margin that reverses the once-automatic case for prioritising market returns over debt reduction.
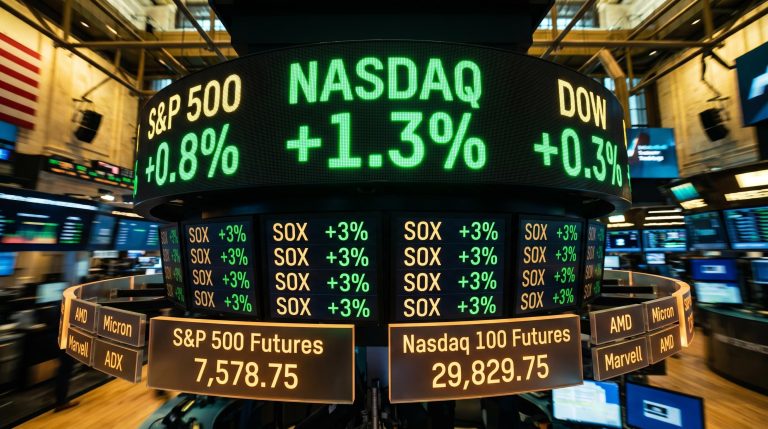
The equity impact was immediate. The S&P 500 declined 1.24% and the Nasdaq fell 1.54% on 17 May 2026, their steepest single-session losses since March, in direct response to the yield spike. The equal-weighted S&P 500 lagged the cap-weighted index by approximately 130 basis points over the prior week, indicating narrow market breadth and concentrated stress among the most rate-sensitive names.
Long-duration growth stocks, whose valuations depend most heavily on earnings projected years into the future, bear the greatest impact from rising discount rates. A technology company expected to generate most of its free cash flow in 2032 sees a larger valuation compression from the same yield move than a utility generating steady cash flow today.
In a standard recession, bonds rally as equities fall. Investors fleeing risk buy government debt, pushing bond prices up and providing a natural hedge for equity losses. The traditional 60/40 portfolio (60% equities, 40% bonds) relies on this inverse correlation.
In an inflation shock, that relationship breaks down. Both bonds and equities can sell off simultaneously, as occurred during the 2021-2022 episode when the 60/40 portfolio recorded one of its worst years on record.
In 2022, the 60/40 portfolio suffered one of its worst annual returns in decades as stocks and bonds fell in the same quarters, the precise breakdown that occurs when inflation, not recession, is the dominant risk.
If the 2026 inflation re-acceleration continues, this correlation breakdown represents the most significant structural risk facing diversified portfolios. The asset that is supposed to provide ballast may instead amplify losses.
Investors who want a structured framework for rebuilding their allocation from first principles will find our comprehensive walkthrough of portfolio resilience beyond the 60/40 framework useful; it covers Bridgewater Co-CIO Bob Prince’s argument for diversifying across economic environments rather than asset-class labels, a practical three-tier adaptive portfolio structure, and the specific instruments, including sector ETFs and inflation-linked securities, that institutional and retail investors are using to replace the ballast long-dated bonds no longer reliably provide.
Four of the world’s largest asset managers have published broadly consistent frameworks for the current environment. The shared logic: shorten duration, rotate toward real cash flows, and find alternative sources of portfolio ballast.
| Institution | Fixed Income Stance | Equity Preference | Preferred Hedges |
|---|---|---|---|
| Goldman Sachs AM | Greater allocation to real assets and alternatives | Quality cyclicals, industrials, select financials, pricing-power companies | Real assets, alternatives |
| J.P. Morgan AM | Shorten duration; short-term Treasuries as ballast | Value, financials | Commodities, infrastructure |
| BlackRock Investment Institute | Short-to-intermediate maturity bonds; inflation-linked bonds | Financials, energy, quality value; cautious on unprofitable tech | Inflation-linked bonds, commodities, infrastructure |
| PIMCO | Moderate duration (“bend but don’t break”); active duration management | Defensive quality equities, dividend payers | Active duration management, sector rotation |
The themes that cut across all four are consistent:
PIMCO’s “bend but don’t break” framing captures the duration dilemma: yields are now high enough to generate attractive income from bonds, but extending too far out the maturity curve exposes investors to further losses if yields continue climbing. Moderate duration positions aim to capture the income without absorbing the full downside of a continued selloff.
Three variables will most directly determine whether yields stabilise or continue climbing:
Second-round inflation effects remain the most consequential unresolved variable: corporate giants including Procter and Gamble and Nike are currently absorbing upstream petrochemical cost increases to protect sales volumes rather than raising shelf prices, but analysts place the containment threshold at $85-$90 per barrel Brent sustained through Q3, beyond which the calculus shifts and pass-through to retail accelerates.
The Bank of England Monetary Policy Report from April 2026 set out the framework the Bank would use to assess whether an energy price shock constitutes a temporary price-level event or a sustained inflation threat requiring further tightening, the precise judgement call that now sits at the centre of UK rate expectations.
Bloomberg Economics assessed a resumption of open hostilities as a probable outcome given entrenched negotiating positions.
The geopolitical picture remains fluid. Reports indicated the US and Israel were engaged in intensive preparations for possible renewed joint military strikes against Iran, potentially within the week of 18 May 2026. Separately, the US was evaluating whether to ease Treasury-imposed sanctions on Chinese energy firms purchasing Iranian crude, with a decision anticipated within days.
Each of these developments, if realised, would move oil prices, inflation expectations, and bond yields in measurable and potentially opposite directions. The uncertainty itself is the signal: markets are pricing risk premia for outcomes they cannot yet see.
A synchronised global bond selloff is not a technical market event confined to fixed income traders. It is a signal that the global inflation regime may be shifting, and investors who reposition only after that shift is universally acknowledged will have already absorbed the worst of the repricing.
The framework distilled from institutional positioning offers a structured starting point: shorter duration in fixed income, real assets over nominal assets, quality and near-term cash flows over speculative growth, and a realistic acceptance that the traditional ballast of long-dated bonds may not provide the protection it did in the years before 2022.
The Strait of Hormuz situation and central bank communications over the coming weeks are the specific developments to monitor. The daily yield number in isolation tells investors where markets are today. The trajectory of the conflict and the policy response will determine where they go next.
This article is for informational purposes only and should not be considered financial advice. Investors should conduct their own research and consult with financial professionals before making investment decisions. Past performance does not guarantee future results. Financial projections are subject to market conditions and various risk factors.
A government bond yield measures the return an investor earns on a bond relative to its current market price. Because the coupon payment is fixed, when bond prices fall due to selling pressure, the yield rises, since that fixed payment now represents a larger percentage of the lower purchase price.
The Strait of Hormuz conflict has disrupted global oil supplies, causing Brent crude to surge roughly 50%, which has raised inflation expectations and prompted markets to price in central bank rate increases rather than cuts, triggering a broad selloff in sovereign bonds across the US, UK, and Japan.
Mortgage lenders price home loans above the sovereign yield curve, so when yields rise, fixed-rate mortgage offers increase for new borrowers. For equities, rising yields increase the discount rate used to value future earnings, compressing price-to-earnings multiples and putting downward pressure on stock prices, especially long-duration growth names.
A synchronised selloff breaks the traditional inverse relationship between bonds and equities. In an inflation shock, both asset classes can fall simultaneously, as happened in 2022, meaning the bond allocation that normally cushions equity losses may instead amplify them, reducing the effectiveness of the classic 60/40 portfolio structure.
Institutions including BlackRock, PIMCO, Goldman Sachs AM, and J.P. Morgan AM are broadly shortening fixed income duration, rotating toward equities with near-term cash flows and pricing power (particularly financials and energy), and adding real assets, commodities, and inflation-linked securities as alternative portfolio hedges.