How to Value ASX Bank Stocks Using the PE Ratio
28 mins ago

A single change in one input assumption shifts Bendigo and Adelaide Bank’s (BEN) implied value from $7.22 to $32.50. That is the same stock, the same dividend, and two entirely different conclusions, which is exactly why understanding the Dividend Discount Model matters before relying on it.
With BEN trading at approximately $10.40 in mid-May 2026 and paying a fully franked dividend of $0.63 per share, Australian income investors have a concrete, real-world case study to work through. The RBA cash rate sits at 4.35%, and 10-year government bond yields are near 5.1%, making discount rate selection more consequential than it has been in years. The stakes for getting the inputs right are high.
By the end of this guide, readers will know how to build a DDM valuation for a dividend-paying bank stock from scratch, understand how franking credits shift the implied valuation materially, and interpret a sensitivity table that maps the full range of possible outcomes.
Before the formula, there is a question every income investor answers implicitly: what is a share worth if the only cash it ever returns is dividends? The Dividend Discount Model makes that question explicit. It values a share as the present value of all future dividends, treating those payments as the investor’s actual cash return from ownership.
The logic is purpose-built for mature, dividend-paying stocks rather than growth companies that retain all earnings. A business like BEN, which distributes a reliable portion of profits each year, fits the model’s assumptions far more naturally than a technology company reinvesting every dollar into expansion.
The model requires only three core inputs:
The Gordon Growth Model formula: P = D1 / (ke – g)
This formula, one of the oldest formal valuation tools used by professional analysts, says that a stock’s intrinsic value equals next year’s expected dividend divided by the difference between the required return and the growth rate. For BEN, the starting point is a cash dividend of $0.63 (FY24) and a share price of $10.40 as of mid-May 2026. The sections that follow build each input from first principles.
BEN carries the characteristics the model was designed for. It is a regulated, mature banking institution with a long operating history and a relatively high, consistent payout ratio compared with the major banks. The FY24 total ordinary dividend of $0.63 per share was fully franked, and the FY25 interim of $0.30 (also fully franked, announced 16 February 2026) confirmed the policy remains intact.
The community banking model supports earnings stability. Unlike more volatile growth-oriented businesses, BEN’s revenue base is anchored in regional mortgage and SME lending, producing a dividend stream that is predictable over the medium term. Australian bank shares collectively represent more than one-third of the ASX 200 by market capitalisation, which is one reason dividend-based valuation is so widely applied across the sector.
The ASX sectors suited to DDM share a common structural feature: regulatory constraints or mandated distribution requirements that produce predictable dividend streams, which is precisely why banks, REITs, utilities, and infrastructure companies appear repeatedly in income-investor portfolios built around this model.
DDM-suitable characteristics for BEN:
Confidence in the model’s fit should not become complacency about its limits.
Conditions that strain the DDM for BEN:
A two-stage DDM, separating a near-term constrained-growth phase from a stable long-run growth phase, handles these dynamics better than the single-stage Gordon Growth Model. For the purposes of this guide, the single-stage model provides the clearest illustration of input sensitivity, but investors with access to multi-year earnings forecasts may prefer the two-stage approach.
Each input in the DDM is an analytical decision, not a number to look up. The cost of equity is built from components, each reflecting a specific judgement about risk.
Start with the risk-free rate. The standard proxy is the 10-year Australian Commonwealth Government Bond (ACGB) yield, which sat at approximately 5.00-5.11% in mid-May 2026 (Trading Economics recorded a 5.11% close on 15 May 2026; FRED data showed 4.96% for April 2026). This level is materially higher than the pre-2022 environment, when yields closer to 3-4% compressed discount rates across the board.
Next, add the equity-risk premium (ERP), the additional return investors demand for holding equities over government bonds. In the current Australian rate environment, 4-5% is consistent with market practice for regulated financial stocks.
RBA research on bank cost of equity found that franking credits meaningfully reduce the effective required return for domestic investors holding Australian bank shares, which has direct implications for how the equity-risk premium component should be calibrated when building a DDM discount rate for stocks like BEN.
Finally, apply a regional bank premium. BEN lacks the scale, funding diversity, and geographic spread of the big four. A premium of 0.5-1.0% reflects this concentration risk. The result: an implied cost of equity of approximately 9.5-11% for BEN.
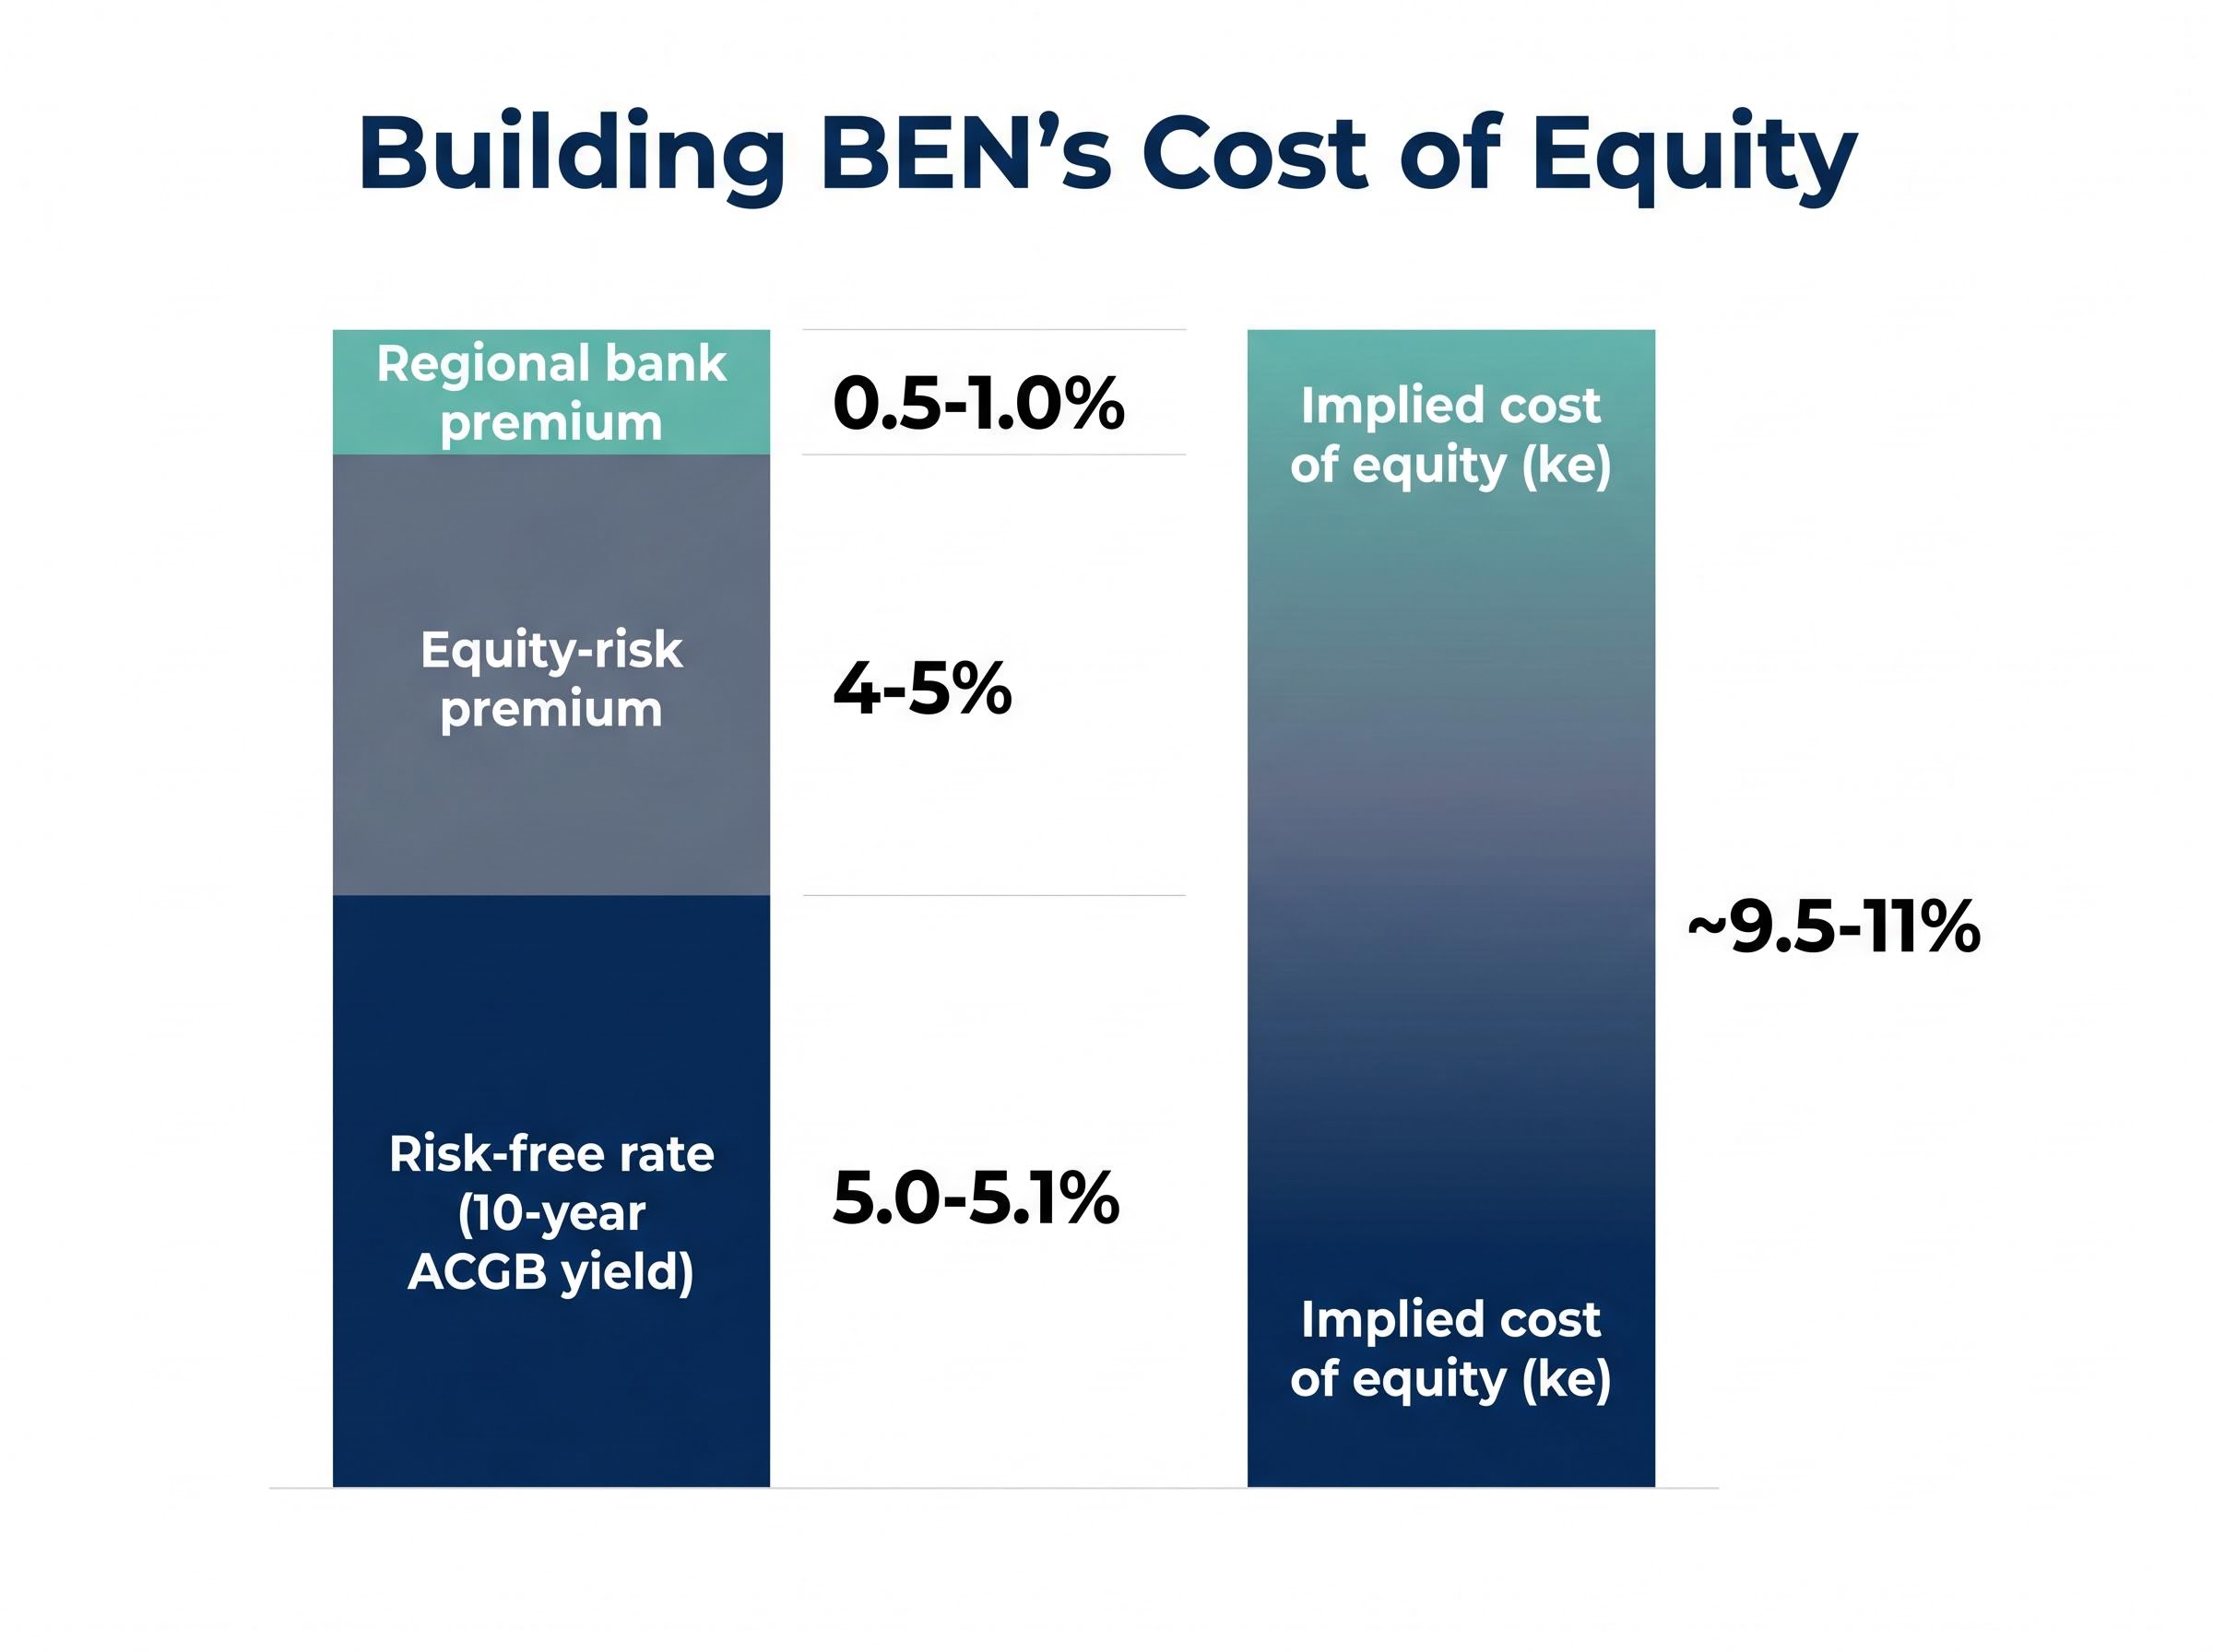
The long-run dividend growth rate (g) requires a separate judgement. BEN faces competitive NIM pressure, APRA capital constraints, and ongoing digital investment costs. A conservative 2-4% range reflects moderate macro growth offset by these headwinds.
“With the 10-year ACGB yield at 5.1%, the cost of equity for BEN sits roughly 4-6 percentage points above the risk-free rate, depending on risk assumptions applied.”
| Input | Description | Value / Range | Source |
|---|---|---|---|
| Risk-free rate | 10-year ACGB yield | 5.0-5.1% | Trading Economics / FRED, mid-May 2026 |
| Equity-risk premium | Additional return for equity risk | 4-5% | Australian market practice |
| Regional bank premium | Scale and concentration risk vs. big four | 0.5-1.0% | Sector risk assessment |
| Implied cost of equity (ke) | Sum of above components | ~9.5-11% | Derived |
| Long-run dividend growth (g) | Sustainable annual dividend growth | 2-4% | Macro growth offset by competitive/regulatory constraints |
The table above is a framework, not a prescription. Each investor should calibrate these inputs to their own assessment of risk and growth. The next section applies them.
The calculation proceeds in five steps. Follow them in sequence to see exactly where each input shapes the output.
The grossing-up multiplier for franked dividends follows directly from Australia’s 30% corporate tax rate: dividing the cash dividend by 0.70 converts it to the pre-tax equivalent that eligible investors actually receive in economic terms, a mechanical step that lifted the BOQ DDM fair value estimate by more than 40% in a comparable case study.
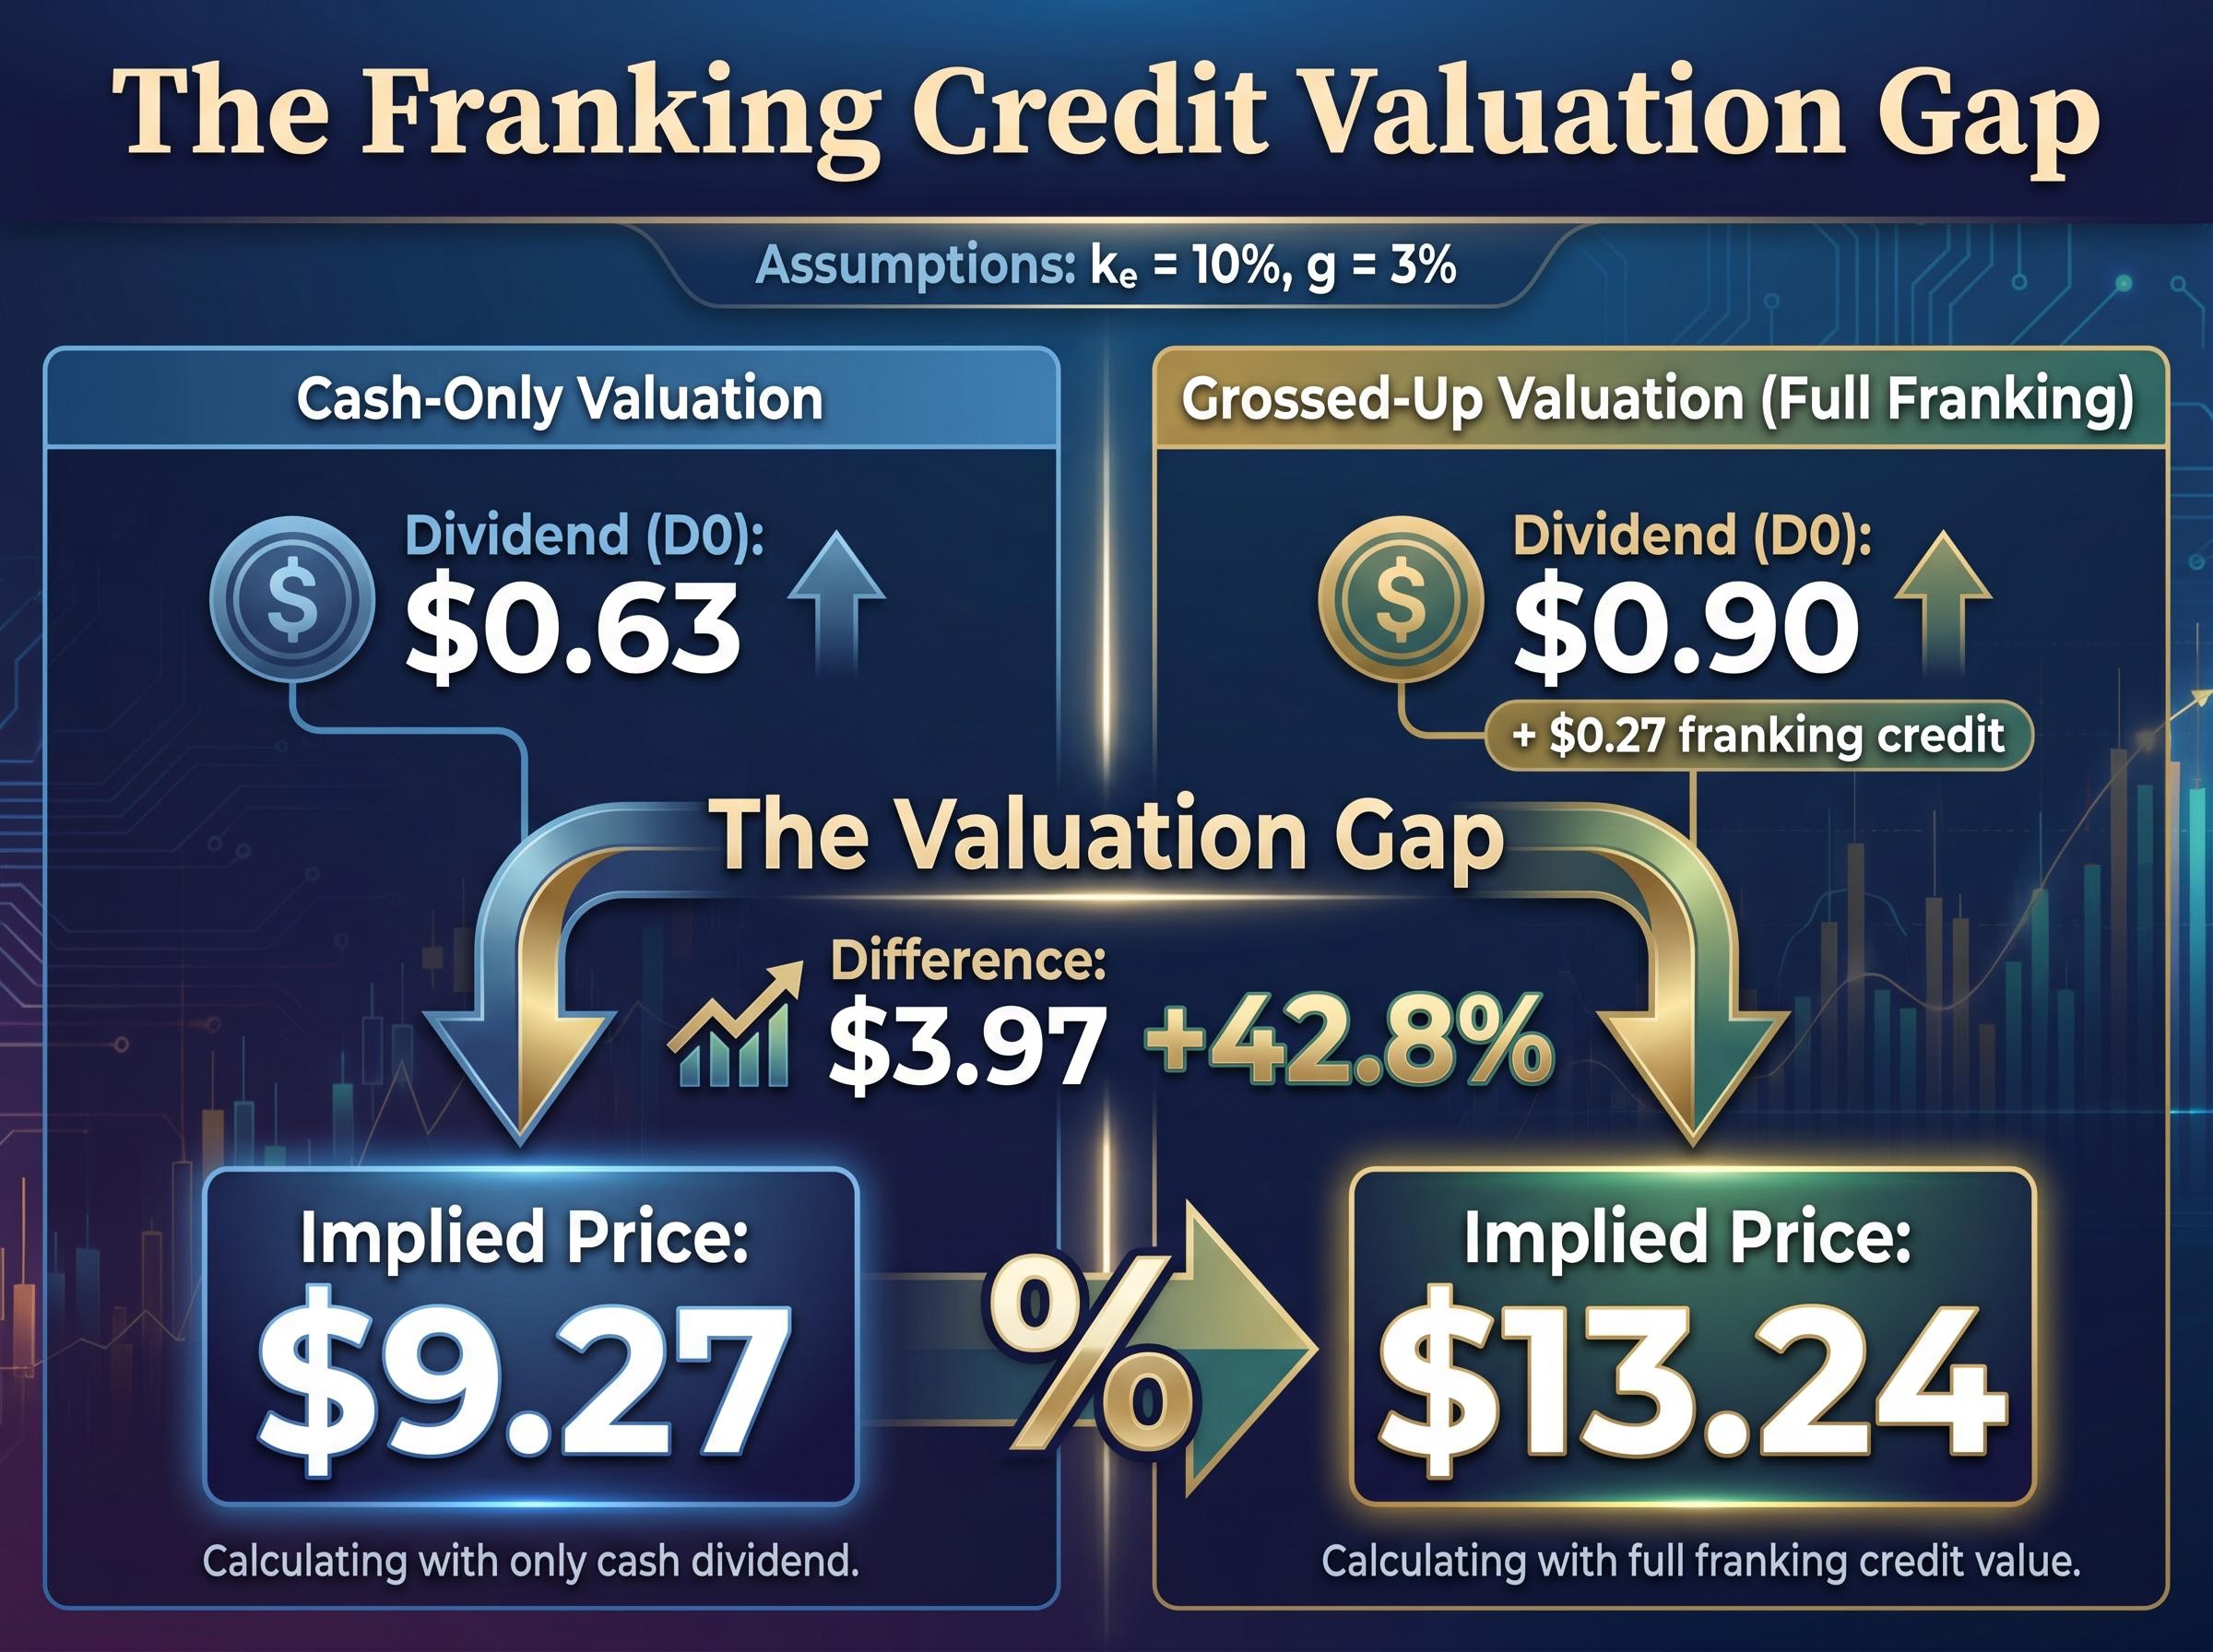
The spread between those two results, $9.27 versus $13.24, is nearly $4 per share. Same stock, same growth assumption, same discount rate. The difference is entirely a function of whether the investor can fully utilise the franking credit of $0.27 per share (calculated as $0.63 x 0.4286).
“For an SMSF investor in pension phase, the grossed-up dividend of $0.90 per share is the economically correct input, not the $0.63 cash figure.”
Not every investor captures the full benefit. An SMSF in pension phase (taxed at 0%) receives the franking credit as a cash refund, making the grossed-up figure the right input. A high-income individual on a 47% marginal rate partially offsets their tax liability but does not fully realise the credit’s face value. A non-resident investor receives no franking benefit at all.
The ATO rules on refundable franking credits confirm that eligible investors, including SMSFs satisfying the minimum holding period and other integrity conditions, can receive excess imputation credits as a direct cash refund, which is why the grossed-up dividend is the economically correct DDM input for those investors rather than the cash figure alone.
| Investor Scenario | D0 Used | D1 (g = 3%) | Implied Price (ke = 10%) |
|---|---|---|---|
| SMSF pension phase (full credit) | $0.90 | $0.927 | $13.24 |
| High-income individual (partial credit) | Between $0.63 and $0.90 | Between $0.649 and $0.927 | Between $9.27 and $13.24 |
| Non-resident (no credit) | $0.63 | $0.649 | $9.27 |
For an SMSF investor, ignoring franking credits in a DDM produces a materially understated valuation. The $3.97 per share difference is not a rounding issue; it is the entire margin between a stock appearing fairly valued and appearing significantly undervalued. Source analysis using a blended average across multiple ke and g combinations produced an implied valuation of approximately $13.32, broadly consistent with the grossed-up result above.
A sensitivity table is a grid. One axis shows the discount rate (ke), the other shows the dividend growth rate (g), and each cell displays the implied share price for that combination. It is not a flaw that the range is wide; it is the model doing what it should, making the relationship between assumptions and outputs visible.
The table below uses BEN’s cash D0 of $0.63 and applies the Gordon Growth formula across a range of inputs.
| g \ ke | 7% | 8% | 9% | 10% | 11% |
|---|---|---|---|---|---|
| 2% | $12.85 | $10.71 | $9.18 | $8.03 | $7.14 |
| 3% | $16.22 | $12.97 | $10.82 | $9.27 | $8.11 |
| 4% | $21.84 | $16.38 | $13.10 | $10.92 | $9.36 |
The extremes tell a story about model mechanics. At ke = 11% and g = 2%, the denominator is 0.09, producing an implied value near $7.14. At ke = 7% and g = 4%, the denominator shrinks to 0.03, and the valuation climbs past $21. As ke approaches g, the denominator approaches zero, and the valuation rises sharply. Small input changes produce large output swings; this is inherent in the model’s structure, not a sign that something has gone wrong.
“At ke = 10% and g = 3%, the DDM produces $9.27 using cash dividends, and $13.24 using the grossed-up figure. The current price of $10.40 sits squarely within the cash-dividend range, suggesting the market is pricing BEN on income alone.”
BEN’s current share price of $10.40 falls within the central corridor of the table, implying the market is either applying a ke near 10% with moderate growth expectations, or a somewhat lower ke with a pessimistic growth view. Identifying where the market price sits on the grid allows investors to reverse-engineer the assumptions embedded in the current price, and then decide whether those assumptions are too conservative or too generous.
The practical value of a sensitivity table is that it transforms a single-point estimate into a structured conversation about assumptions. Any analyst’s DDM estimate can be stress-tested by asking one question: what ke and g did they use?
The Westpac DDM scenario matrix illustrates the same mechanics at work across a larger bank: a cash-only cross-scenario average of approximately $35.10 against a May 2026 market price of $35.84 suggests broadly fair value on income alone, while the grossed-up average of $48.64 reveals the substantial valuation gap that franking credits create for pension-phase SMSF investors.
The Dividend Discount Model does not produce a target price. It produces a valuation that is exactly as good as the assumptions fed into it. Its value lies in making those assumptions, about growth, about risk, about required returns, explicit and testable.
For BEN specifically, several factors sit entirely outside the DDM but matter to any investment assessment:
The DDM should be used alongside other tools, such as price-to-earnings-based valuation and qualitative assessment of strategic positioning, rather than in isolation. Australian bank shares represent more than one-third of the ASX 200 by market capitalisation, making a disciplined valuation approach to this sector relevant for most Australian investors.
A PE and DDM comparison for ASX bank shares using NAB as a worked example shows how the two methods can be run side by side: a trailing PE of roughly 20x produces one valuation anchor while the DDM, adjusted for franking credits, produces another, and the gap between them becomes the starting point for an informed investor’s own view on which assumptions are more defensible.
BEN’s FY25 interim dividend of $0.30 per share (fully franked, announced 16 February 2026) confirms that the fully franked dividend policy has continued into FY25, supporting the use of FY24’s $0.63 as a forward-looking base. No valuation model eliminates investment uncertainty; the value lies in making assumptions transparent and comparable.
Three DDM scenarios frame the investment question clearly against BEN’s current market price of $10.40.
| Scenario | D0 Used | ke / g | Implied Price | vs. Market ($10.40) |
|---|---|---|---|---|
| Cash-only DDM | $0.63 | 10% / 3% | $9.27 | ~11% below market |
| Grossed-up DDM (full franking) | $0.90 | 10% / 3% | $13.24 | ~27% above market |
| Blended average (source analysis) | Multiple | Various | $13.32 | ~28% above market |
The grossed-up valuation of $13.24 represents approximately 27% upside for investors who can fully utilise franking credits, such as SMSFs in pension phase. The cash-only valuation of $9.27 implies the stock sits modestly above fair value at current prices for investors without franking benefit.
The current rate environment compresses DDM valuations relative to the low-rate era. With the RBA cash rate at 4.35% and the ACGB yield at approximately 5.1%, these macro anchors were not present in pre-2022 valuation work and they change the output materially. Disciplined input selection matters more now than it has in a decade.
Rather than accepting any single analyst’s output, investors can apply this framework themselves:
This framework applies not only to BEN but to any fully franked dividend-paying stock on the ASX. The model is only as good as the assumptions, and now those assumptions are in the investor’s hands.
The Dividend Discount Model is a powerful income-investor tool precisely because it forces the analyst to be explicit about two beliefs: how fast dividends will grow and what return rate is required. Every other output follows from those two inputs.
For fully franked Australian stocks, the grossed-up dividend is the economically correct input for eligible investors. Ignoring it understates intrinsic value by a margin that, as this guide demonstrated with BEN, can exceed $4 per share.
As RBA rate policy evolves and BEN’s earnings clarity improves through FY25 results, the inputs to any DDM will shift. That is the point. This is a living model rather than a one-time calculation, and the investor who revisits it with updated assumptions after each reporting season will consistently make better-informed decisions than the one who accepts a static valuation at face value.
This article is for informational purposes only and should not be considered financial advice. Investors should conduct their own research and consult with financial professionals before making investment decisions. Past performance does not guarantee future results. Financial projections are subject to market conditions and various risk factors.
The Dividend Discount Model values a share as the present value of all future dividends, using the formula P = D1 / (ke - g), where D1 is next year's expected dividend, ke is the required rate of return, and g is the long-run dividend growth rate. It suits mature, dividend-paying stocks like Australian banks because their regulated earnings produce predictable dividend streams.
Franking credits increase the economically relevant dividend input for eligible investors by grossing up the cash dividend by dividing it by 0.70, reflecting the 30% corporate tax already paid. For BEN, this lifts the base dividend from $0.63 to $0.90 per share, raising the DDM implied price from $9.27 to $13.24 at a 10% discount rate and 3% growth assumption.
A reasonable cost of equity for BEN is approximately 9.5-11%, built by adding a 4-5% equity risk premium and a 0.5-1.0% regional bank concentration premium to the 10-year Australian government bond yield, which sat near 5.1% in mid-May 2026. Each investor should calibrate these components to their own risk assessment rather than treating them as fixed inputs.
A sensitivity table displays implied share prices across a grid of discount rate (ke) and dividend growth rate (g) combinations, making it easy to see how the valuation changes as assumptions shift. For BEN, the table shows values ranging from $7.14 at ke = 11% and g = 2% to above $21 at ke = 7% and g = 4%, illustrating how small input changes produce large output swings due to the model's denominator structure.
Investors who can fully utilise franking credits, particularly SMSFs in pension phase taxed at 0% who receive excess imputation credits as a direct cash refund, benefit most from using the grossed-up dividend as their DDM input. Non-residents receive no franking benefit and should use the cash dividend only, while high-income individuals fall somewhere in between depending on their marginal tax rate.