BofA Flags S&P 500 Decision Point With 6,850 Downside Target
4 hrs ago
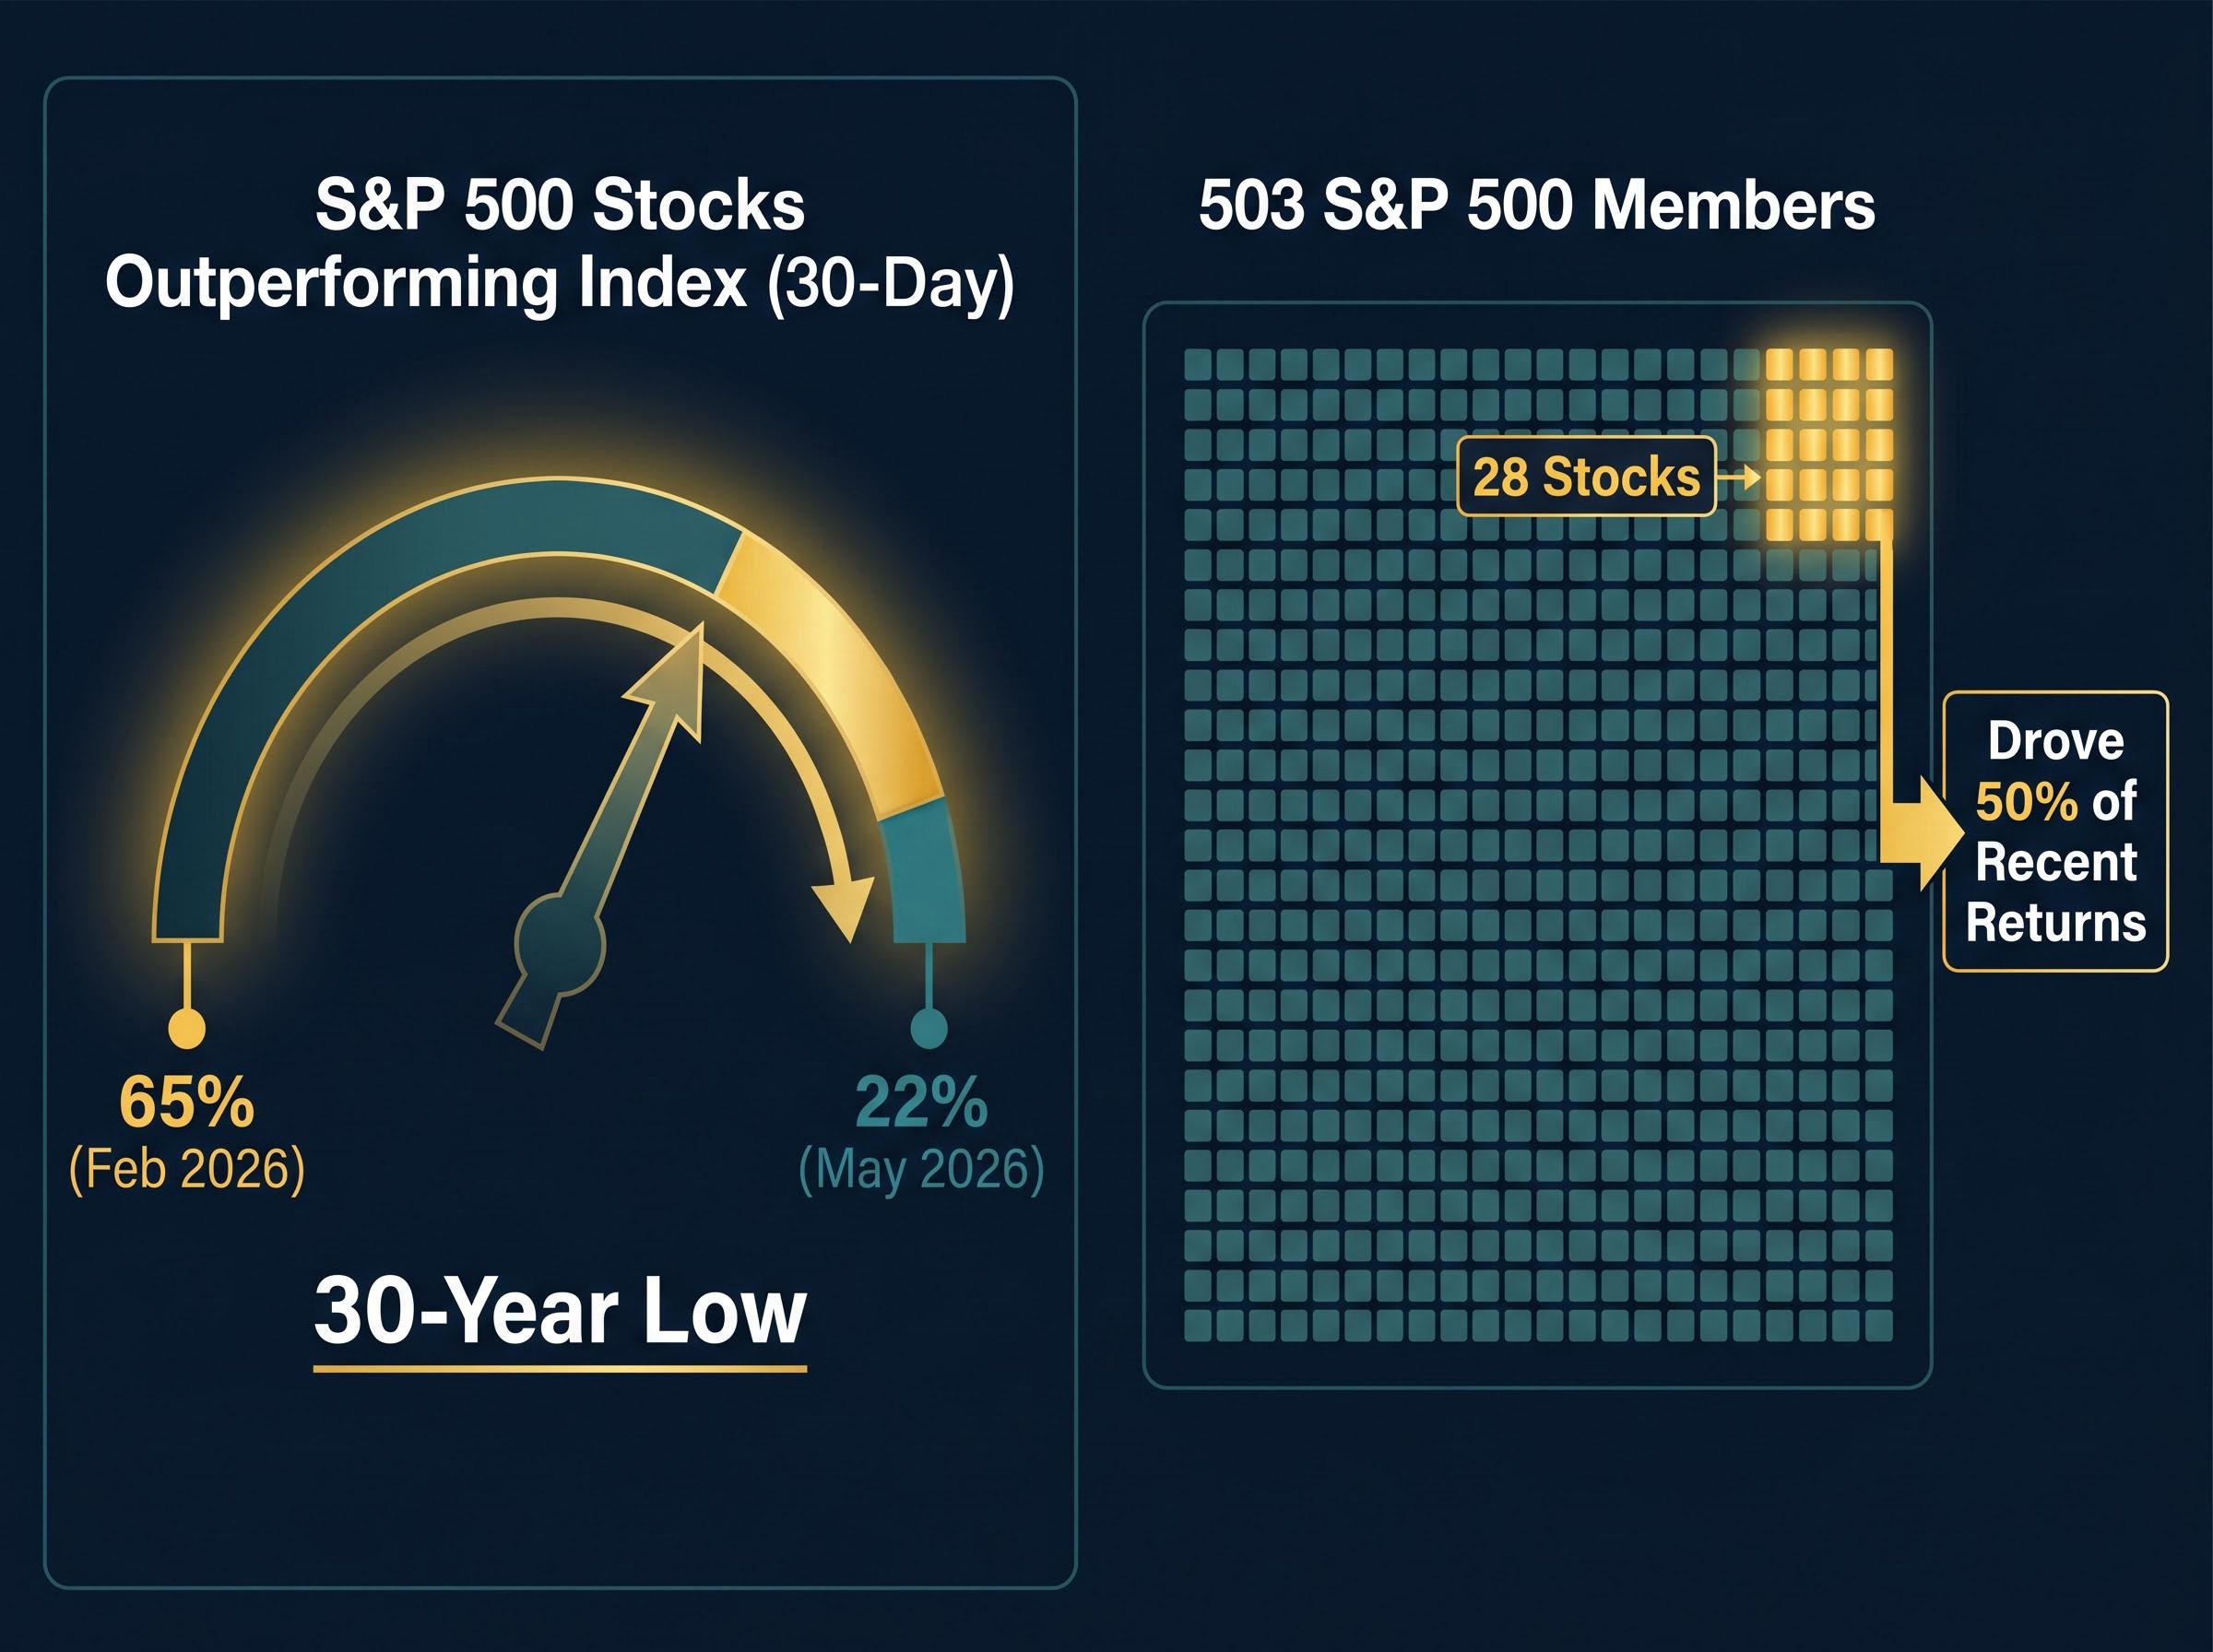
Only 22% of S&P 500 stocks outperformed the index over the past 30 days as of early May 2026, the lowest reading in 30 years. Just 28 of the index’s 503 members drove 50% of recent returns. The S&P 500 itself continues to trade near record highs. The gap between what the index says and what the underlying stocks show has not been this wide since the late 1990s.
That gap is not a curiosity. It is a structural signal. Historically, breadth readings below 25% have preceded 5-15% drawdowns roughly 80% of the time within 60 days. Compounding the concern, both Goldman Sachs and Bank of America have pushed their Federal Reserve rate cut forecasts sharply later, removing the mechanism that has historically resolved narrow-breadth environments: easing-driven rotation into laggard sectors. What follows is an examination of what the breadth data shows, what comparable historical episodes produced, why delayed rate cuts compound the risk, and how institutional investors are positioning in response. The goal is a framework for reading the current divergence between index performance and market structure, not a directional call.
A rising index can simultaneously be a weakening market. The distinction matters because the S&P 500 is a capitalisation-weighted index. A handful of large stocks can push the headline number higher even as most constituents fall behind. That is precisely what is occurring now.
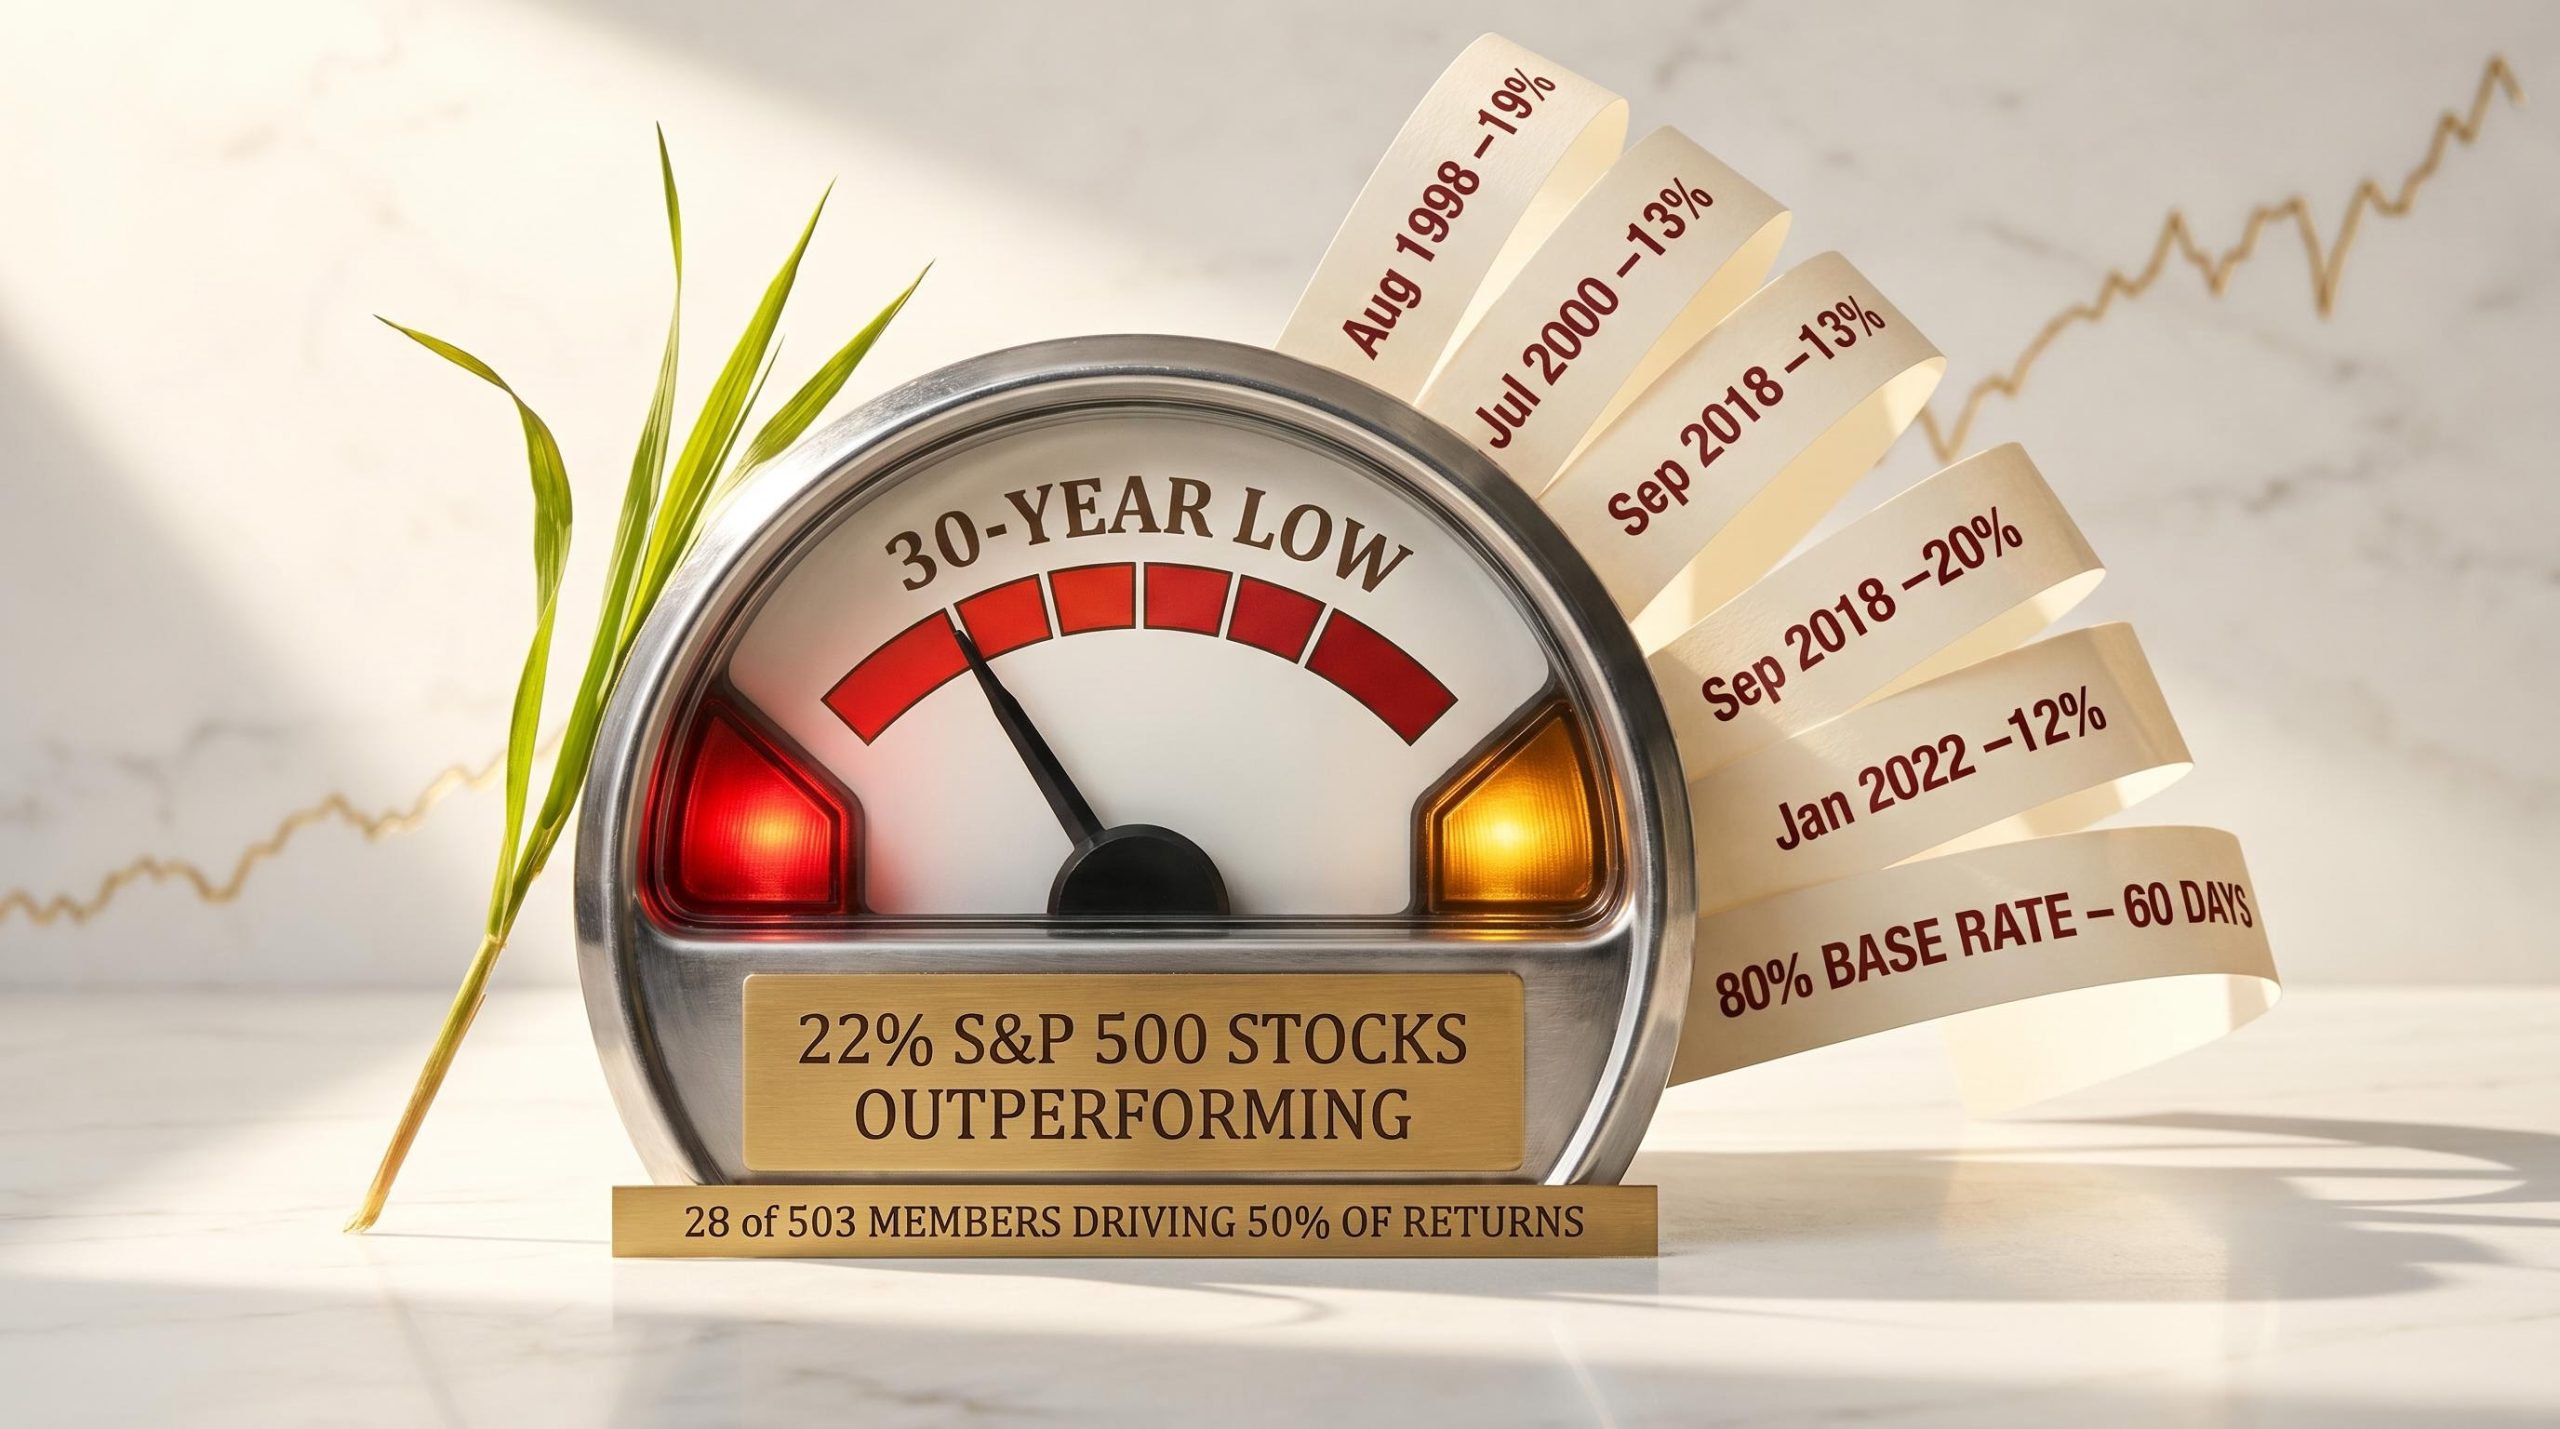
30-year low: Only 22% of S&P 500 stocks outperformed the index on a rolling 30-day basis as of early May 2026, down from 65% in February 2026, according to institutional commentary from Ameriprise Financial and Morgan Stanley.
The concentration is narrow even by the standards of other narrow periods. The core breadth metrics:
The April 2026 breadth data established the foundation for the current reading: the index posted a 98th-percentile monthly return while only 23% of its constituents outperformed, the fourth-lowest participation rate in nearly four decades, confirming that the concentration problem did not emerge in May but had been building across the prior month.
Each metric individually would warrant attention. Together, they describe a market where the index is being carried by a shrinking number of names, where momentum capital is historically crowded into those names, and where options markets reflect concentrated directional conviction. The index does not look fragile. The composition beneath it does.
The 22% breadth reading is not without precedent. Since 1994, institutional quant data identifies roughly 12 episodes where fewer than 25% of S&P 500 stocks outperformed the index on a 30-day basis. The outcomes follow a pattern.
| Period | Breadth Metric | Subsequent Drawdown | Primary Catalyst |
|---|---|---|---|
| Aug 1998 | ~18% outperformance | -19% into Oct 1998 low | LTCM crisis, Fed rate-hike complications |
| Jul 2000 | ~22% outperformance | -13% pullback, extending to -49% | Tech momentum concentration, Fed tightening |
| May 2007 | ~21% outperformance | -8% correction into Jul 2007 | Housing bubble concentration, rate pause |
| Sep 2018 | ~24% outperformance | -20% Q4 bear market | Fed hike path continuation, momentum unwind |
| Jan 2022 | ~23% outperformance | -12% drawdown extending to Jun 2022 | Inflation shock, delayed rate cut expectations |
The consistency is worth sitting with. In 1998, breadth collapsed and the drawdown reached 19%. In 2000, a similar reading preceded a 13% pullback that extended into the full dot-com unwind. In 2018, a 24% breadth reading preceded a 20% Q4 bear market driven by exactly the dynamic visible today: a Fed tightening path continuing into concentrated momentum.
Across 12 comparable sub-25% breadth episodes since 1994, roughly 80% produced 5-15% drawdowns within 60 days. The remaining 20% resolved without a significant correction, typically when the Fed pivoted sooner than expected.
The 2018 and 2022 episodes offer the closest structural analogues. Both featured a delayed easing cycle combined with historically elevated momentum concentration. The current setup shares both characteristics, with one addition: a geopolitical inflation overlay that the prior episodes did not face.
Historical oil shock drawdowns show that every prior episode of Brent crossing $100 per barrel — in 2008, 2011, and 2022 — produced S&P 500 returns well below the index’s long-run 10% annual average in the following 12 months, a base rate that compounds the breadth-driven drawdown risk already visible in the current participation data.
Narrow-breadth environments have historically resolved through one of two channels. The constructive channel is Fed easing: rate cuts reduce the cost of capital, making laggard early-cycle sectors (financials, industrials, small caps) relatively more attractive, which draws capital out of momentum leaders and broadens participation. The destructive channel is an exogenous shock that forces rapid de-risking across all positions.
The constructive channel is currently blocked. The federal funds rate sits at 3.50%-3.75% as of mid-May 2026. Neither Goldman Sachs nor Bank of America expects meaningful easing soon:
The FOMC’s April 2026 rate decision held the federal funds rate at 3.50%-3.75% and cited elevated inflation partly reflecting recent increases in global energy prices, providing the official baseline from which Goldman Sachs and Bank of America have calibrated their delayed easing forecasts.
Goldman Sachs now projects 25 basis point cuts in December 2026 and March 2027, one quarter later than its prior projection. Bank of America has pushed its forecast further still, to July and September 2027, versus a prior expectation of September and October 2026.
Austan Goolsbee, president of the Chicago Fed, stated on CNBC that the path “could include rate increases or multiple cuts depending on Middle East conflict developments,” adding the Fed could return to “multiple cuts if inflation behaves.” The range of outcomes he described underscores the degree of uncertainty embedded in the current rate path.
For investors wanting to understand the internal Fed dynamics in more depth, our full explainer on the FOMC dissent at the April 29 meeting covers the four-way split in detail, including the specific positions of hawk and dove dissenters, how PCE at 3.5% against a 2% target created the dual-mandate conflict, and what the arrival of incoming Fed Chair Kevin Warsh means for the committee’s forward guidance credibility.
The causal chain is direct. The Iran conflict, which President Trump characterised as having approximately a 1% ceasefire survival probability, keeps oil elevated. Elevated oil keeps inflation risk alive. Alive inflation risk keeps the Fed on hold. And a Fed on hold removes the one mechanism that has historically resolved narrow-breadth environments without a significant drawdown.
The BLS March 2026 CPI release reported a 3.3 percent annual increase in the all-items index, with the energy component rising 10.9 percent and gasoline alone accounting for nearly three-quarters of the monthly all-items gain, quantifying the precise inflation pass-through mechanism that is keeping the Fed on hold.
The divergence is not simply about sentiment levels. It is about who holds what, and what happens when the exit narrows.
Retail inflows are running at the 98th percentile of weekly flows since 2019, according to institutional commentary. The AAII Investor Sentiment Survey as of 7 May 2026 showed 38.3% bullish, 32.95% bearish, and 28.74% neutral. The bullish reading sits above the long-run average but is not at a historical extreme. The more meaningful signal is the flow data rather than the survey: retail capital is concentrated in Magnificent 7 and AI-adjacent names, with social platform sentiment on StockTwits running approximately 75% positive, dominated by Nvidia and AI narratives.
This is positioning driven by narrative rather than breadth analysis. The same names that institutional quant desks flag as momentum-crowded are the names retail flows are chasing.
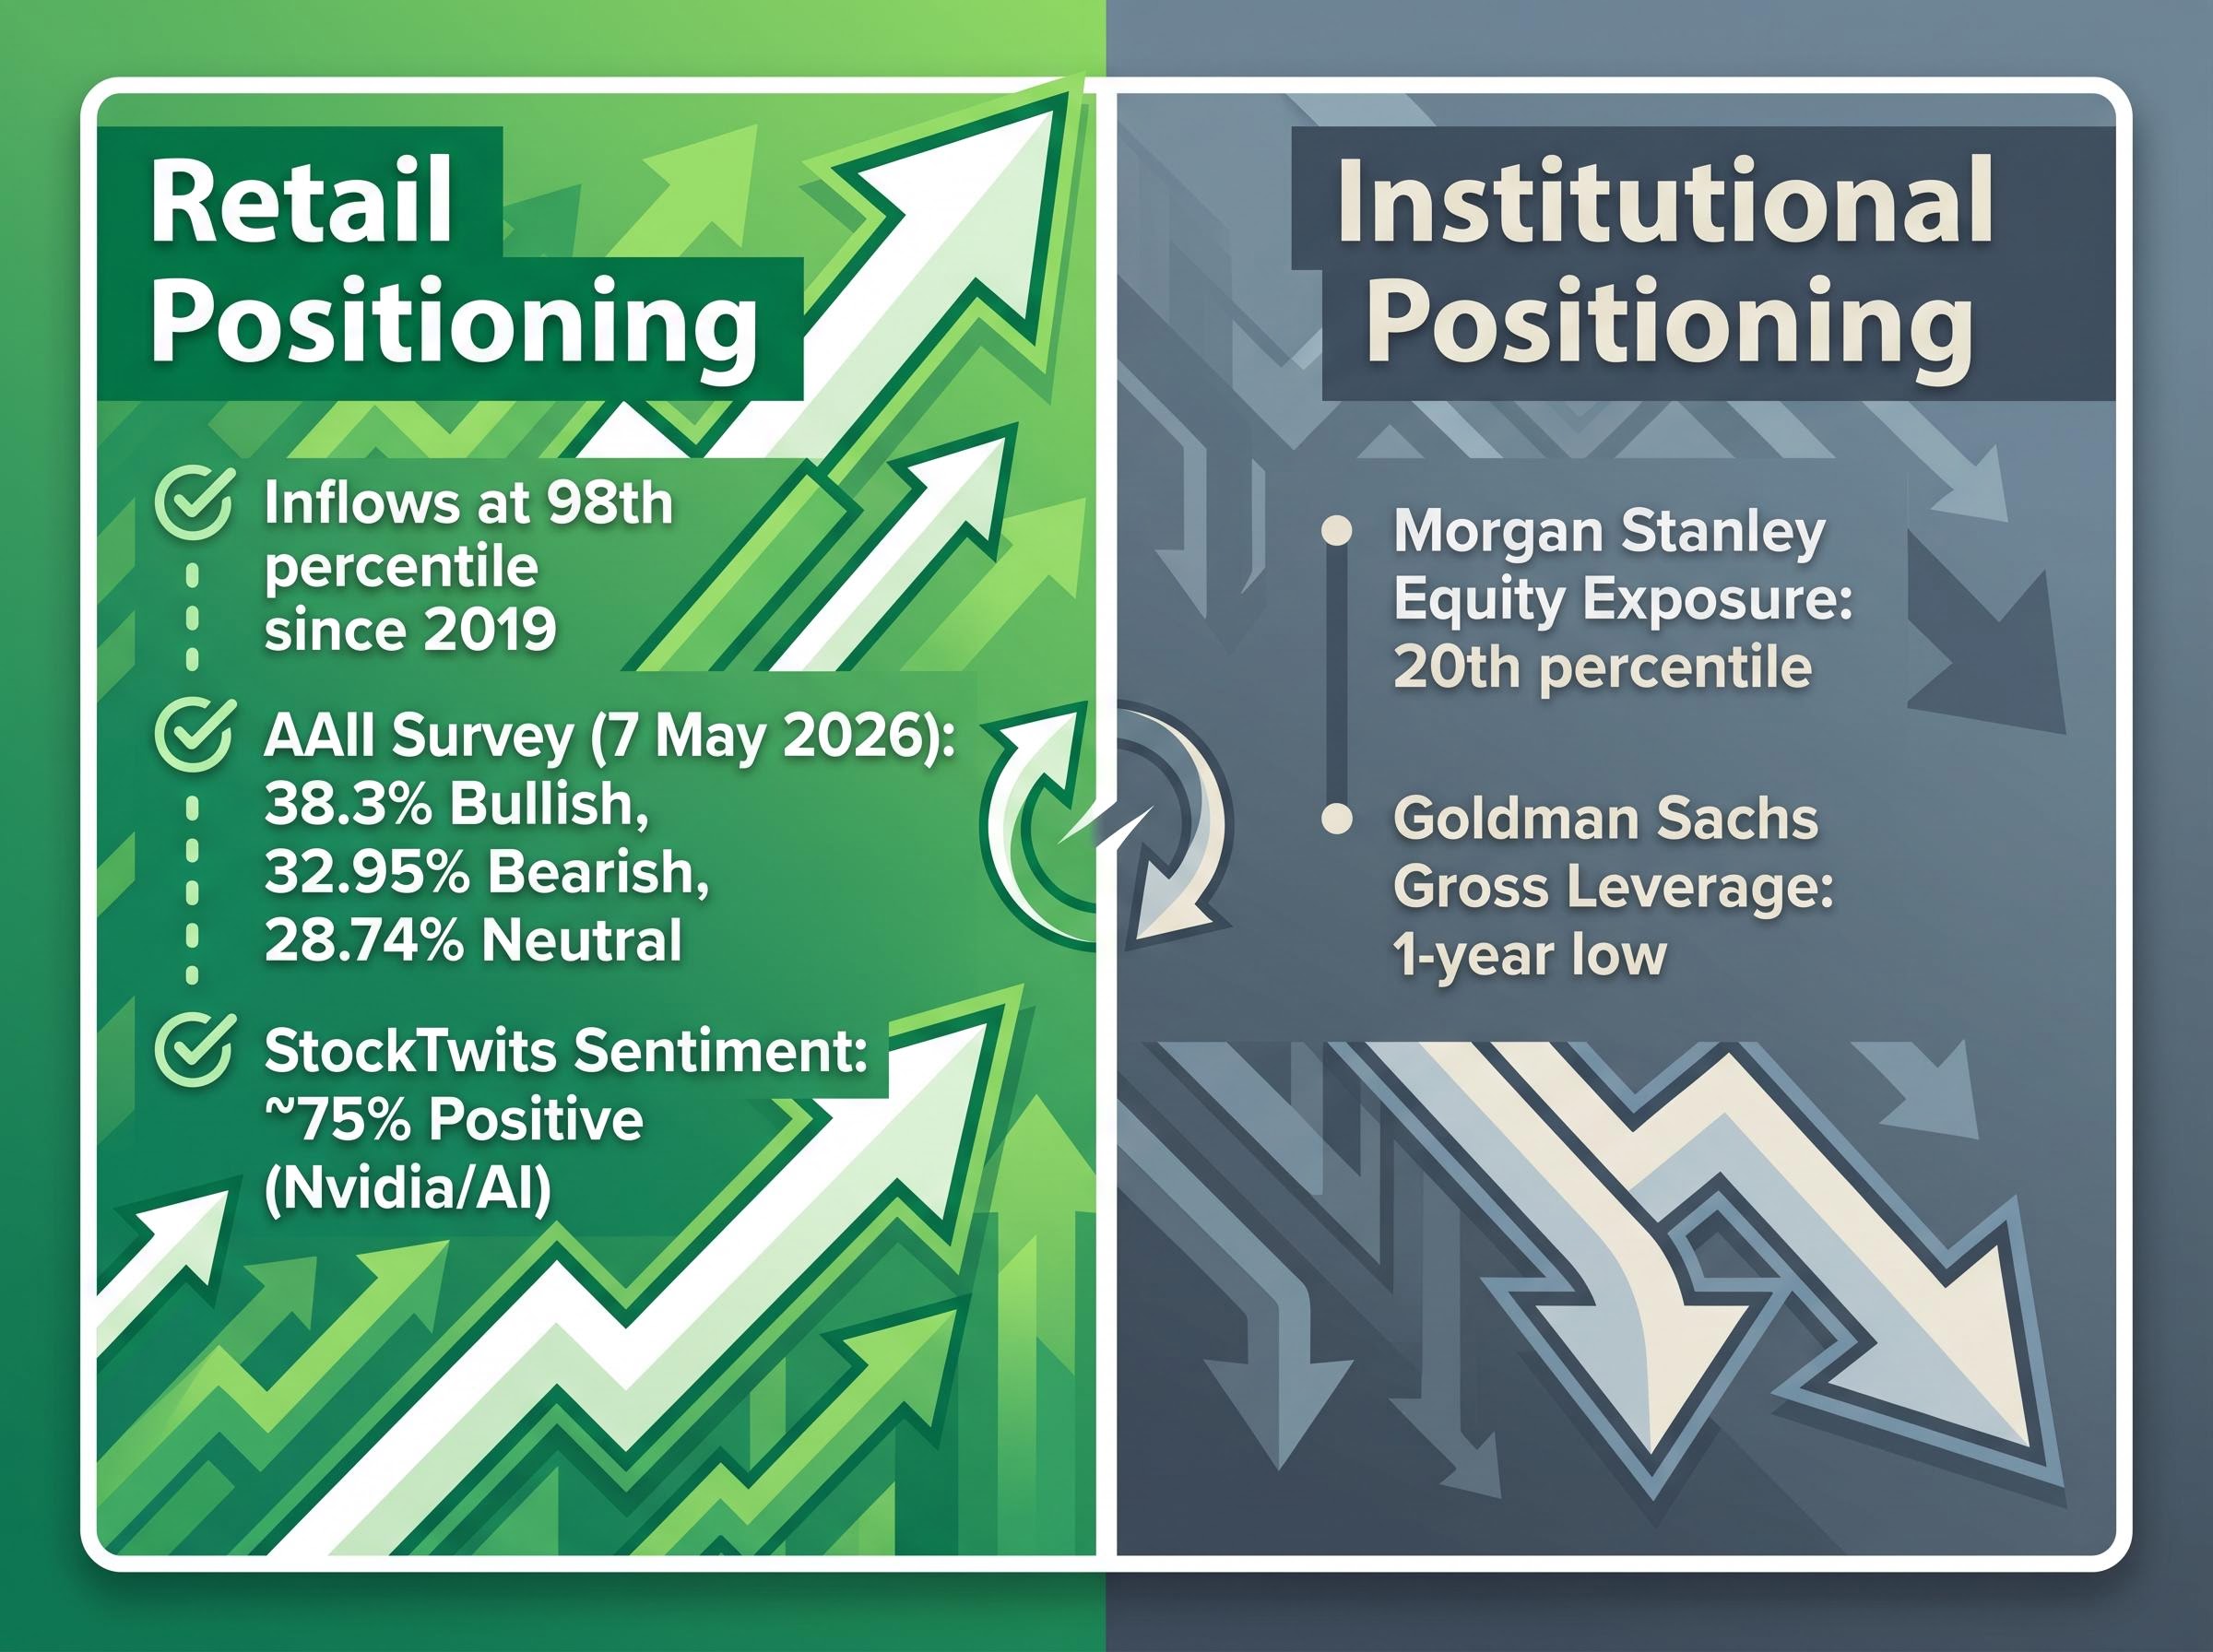
The institutional posture tells a different story. Morgan Stanley reports overall US gross equity exposure at the 20th percentile. Goldman Sachs long/short gross leverage sits at a one-year low. These are directionally consistent signals from different reporting frameworks: both indicate that institutional capital is de-risking despite index-level gains.
The structural implication is a crowding dynamic. When the marginal buyer is retail and the marginal seller is institutional, the same concentrated names are being accumulated by less-informed capital and distributed by more-informed capital. If those names correct, the exit is narrow: the institutional bid is already reduced, and retail flows historically reverse sharply in drawdowns.
The abstract risk thesis becomes concrete in the instruments institutions are deploying. Four primary hedge categories are visible in flow data:
With the VIX estimated at 12-15, options-based tail hedges are relatively inexpensive on an absolute basis. Institutional desks are treating the low-volatility environment as a window to buy protection cheaply before a potential repricing, not as evidence that protection is unnecessary.
The low VIX is itself part of the risk picture. A VIX of 12-15 alongside 99th percentile momentum concentration and 30-year low breadth participation is a pricing mismatch. If a catalyst materialises, the repricing of implied volatility could amplify the drawdown beyond what the breadth metrics alone would suggest.
The base rate is 80%, not 100%. One in five comparable episodes resolved without a significant drawdown, typically when the Fed pivoted earlier than expected or when the earnings cycle broadened participation before momentum unwound. The question is whether any of those conditions are plausible now.
Goldman Sachs projects 2026 corporate capital expenditure growth of 33% to $2 trillion, versus buyback growth of just 3% to $1 trillion. If that spending distributes beyond the current 28-stock concentration, and if the semiconductor sector’s nearly 60% gain over the six weeks preceding 12 May 2026 (with Q1 2026 earnings growth of approximately 28%) extends into adjacent beneficiaries, the breadth problem could ease from the earnings side.
The melt-up counterargument, anchored by BCA Research’s projection of a further 27% rally toward 9,200 driven by AI earnings momentum and institutional deployment pressure, represents the 20% resolution scenario where the breadth problem eases from the earnings side rather than through a correction; its plausibility depends on whether the semiconductor sector’s concentrated gains broaden into adjacent beneficiary sectors before momentum unwinds.
The specific conditions that would indicate the risk is easing rather than intensifying:
Even constructive resolution typically takes multiple months. The 60-day risk window identified by the historical base rate remains open in the near term regardless of which resolution path ultimately materialises. Monitoring these conditions provides a framework for distinguishing between a risk that is building and one that is beginning to dissipate.
The S&P 500 at record highs is not contradictory evidence against the pullback risk thesis. It is the condition that makes the thesis relevant. Rising indices with narrowing participation are the specific pattern that preceded the largest historical drawdowns in the dataset.
Three compounding factors distinguish this episode from routine narrow-breadth periods: a delayed Fed easing cycle that blocks the constructive resolution mechanism, a geopolitical inflation overlay from the Iran conflict that is specifically responsible for that delay, and a retail-institutional divergence in positioning that creates a crowding risk in exactly the names most exposed to momentum reversal.
The 80% base rate means 20% of comparable episodes did not produce significant drawdowns. This is not a guaranteed outcome. It is a probability distribution that has shifted meaningfully against the current configuration. The monitoring framework is specific: watch the 30-day outperformance breadth metric, Fed language for signals of earlier easing, the VIX for signs of complacency repricing, and CPI data for the inflation trajectory that will ultimately determine Fed timing.
This article is for informational purposes only and should not be considered financial advice. Investors should conduct their own research and consult with financial professionals before making investment decisions. Past performance does not guarantee future results. Financial projections are subject to market conditions and various risk factors.
Market breadth measures how many stocks within an index are participating in its gains or losses. When only a small percentage of stocks drive index performance, as is currently the case with just 22% of S&P 500 stocks outperforming on a 30-day basis, it signals fragile underlying market structure that historically precedes significant drawdowns.
Since 1994, roughly 80% of the approximately 12 episodes where fewer than 25% of S&P 500 stocks outperformed the index on a 30-day basis produced drawdowns of 5-15% within 60 days. The remaining 20% resolved without a significant correction, typically when the Federal Reserve pivoted to easing sooner than expected.
Historically, narrow-breadth environments resolve constructively when Fed easing reduces the cost of capital and encourages rotation into laggard sectors, broadening market participation. With Goldman Sachs projecting the first cut no earlier than December 2026 and Bank of America pushing its forecast to July 2027, that resolution mechanism is currently blocked, leaving a destructive exogenous shock as the more likely trigger.
Institutional investors are deploying four primary strategies: VIX futures and calls to position for volatility repricing, S&P 500 put spreads such as August 2026 5000/4800 structures, defensive sector rotation into utilities (XLU) and energy (XLE) ETFs alongside inverse QQQ positions, and short 2s10s yield curve steepener positions as a macro hedge against the delayed easing scenario.
Key indicators to watch include the 30-day outperformance breadth metric recovering above 35%, a shift in Fed language toward earlier easing, stabilisation of the Iran conflict reducing oil price and inflation pass-through risk, a declining CPI trajectory toward the Fed's 2% target, and AI capital expenditure broadening beyond the current narrow set of concentrated beneficiary stocks.