
Goldman Sachs Cuts 2026 Smartphone Shipment Forecast 10% on AI Crunch
22 mins ago

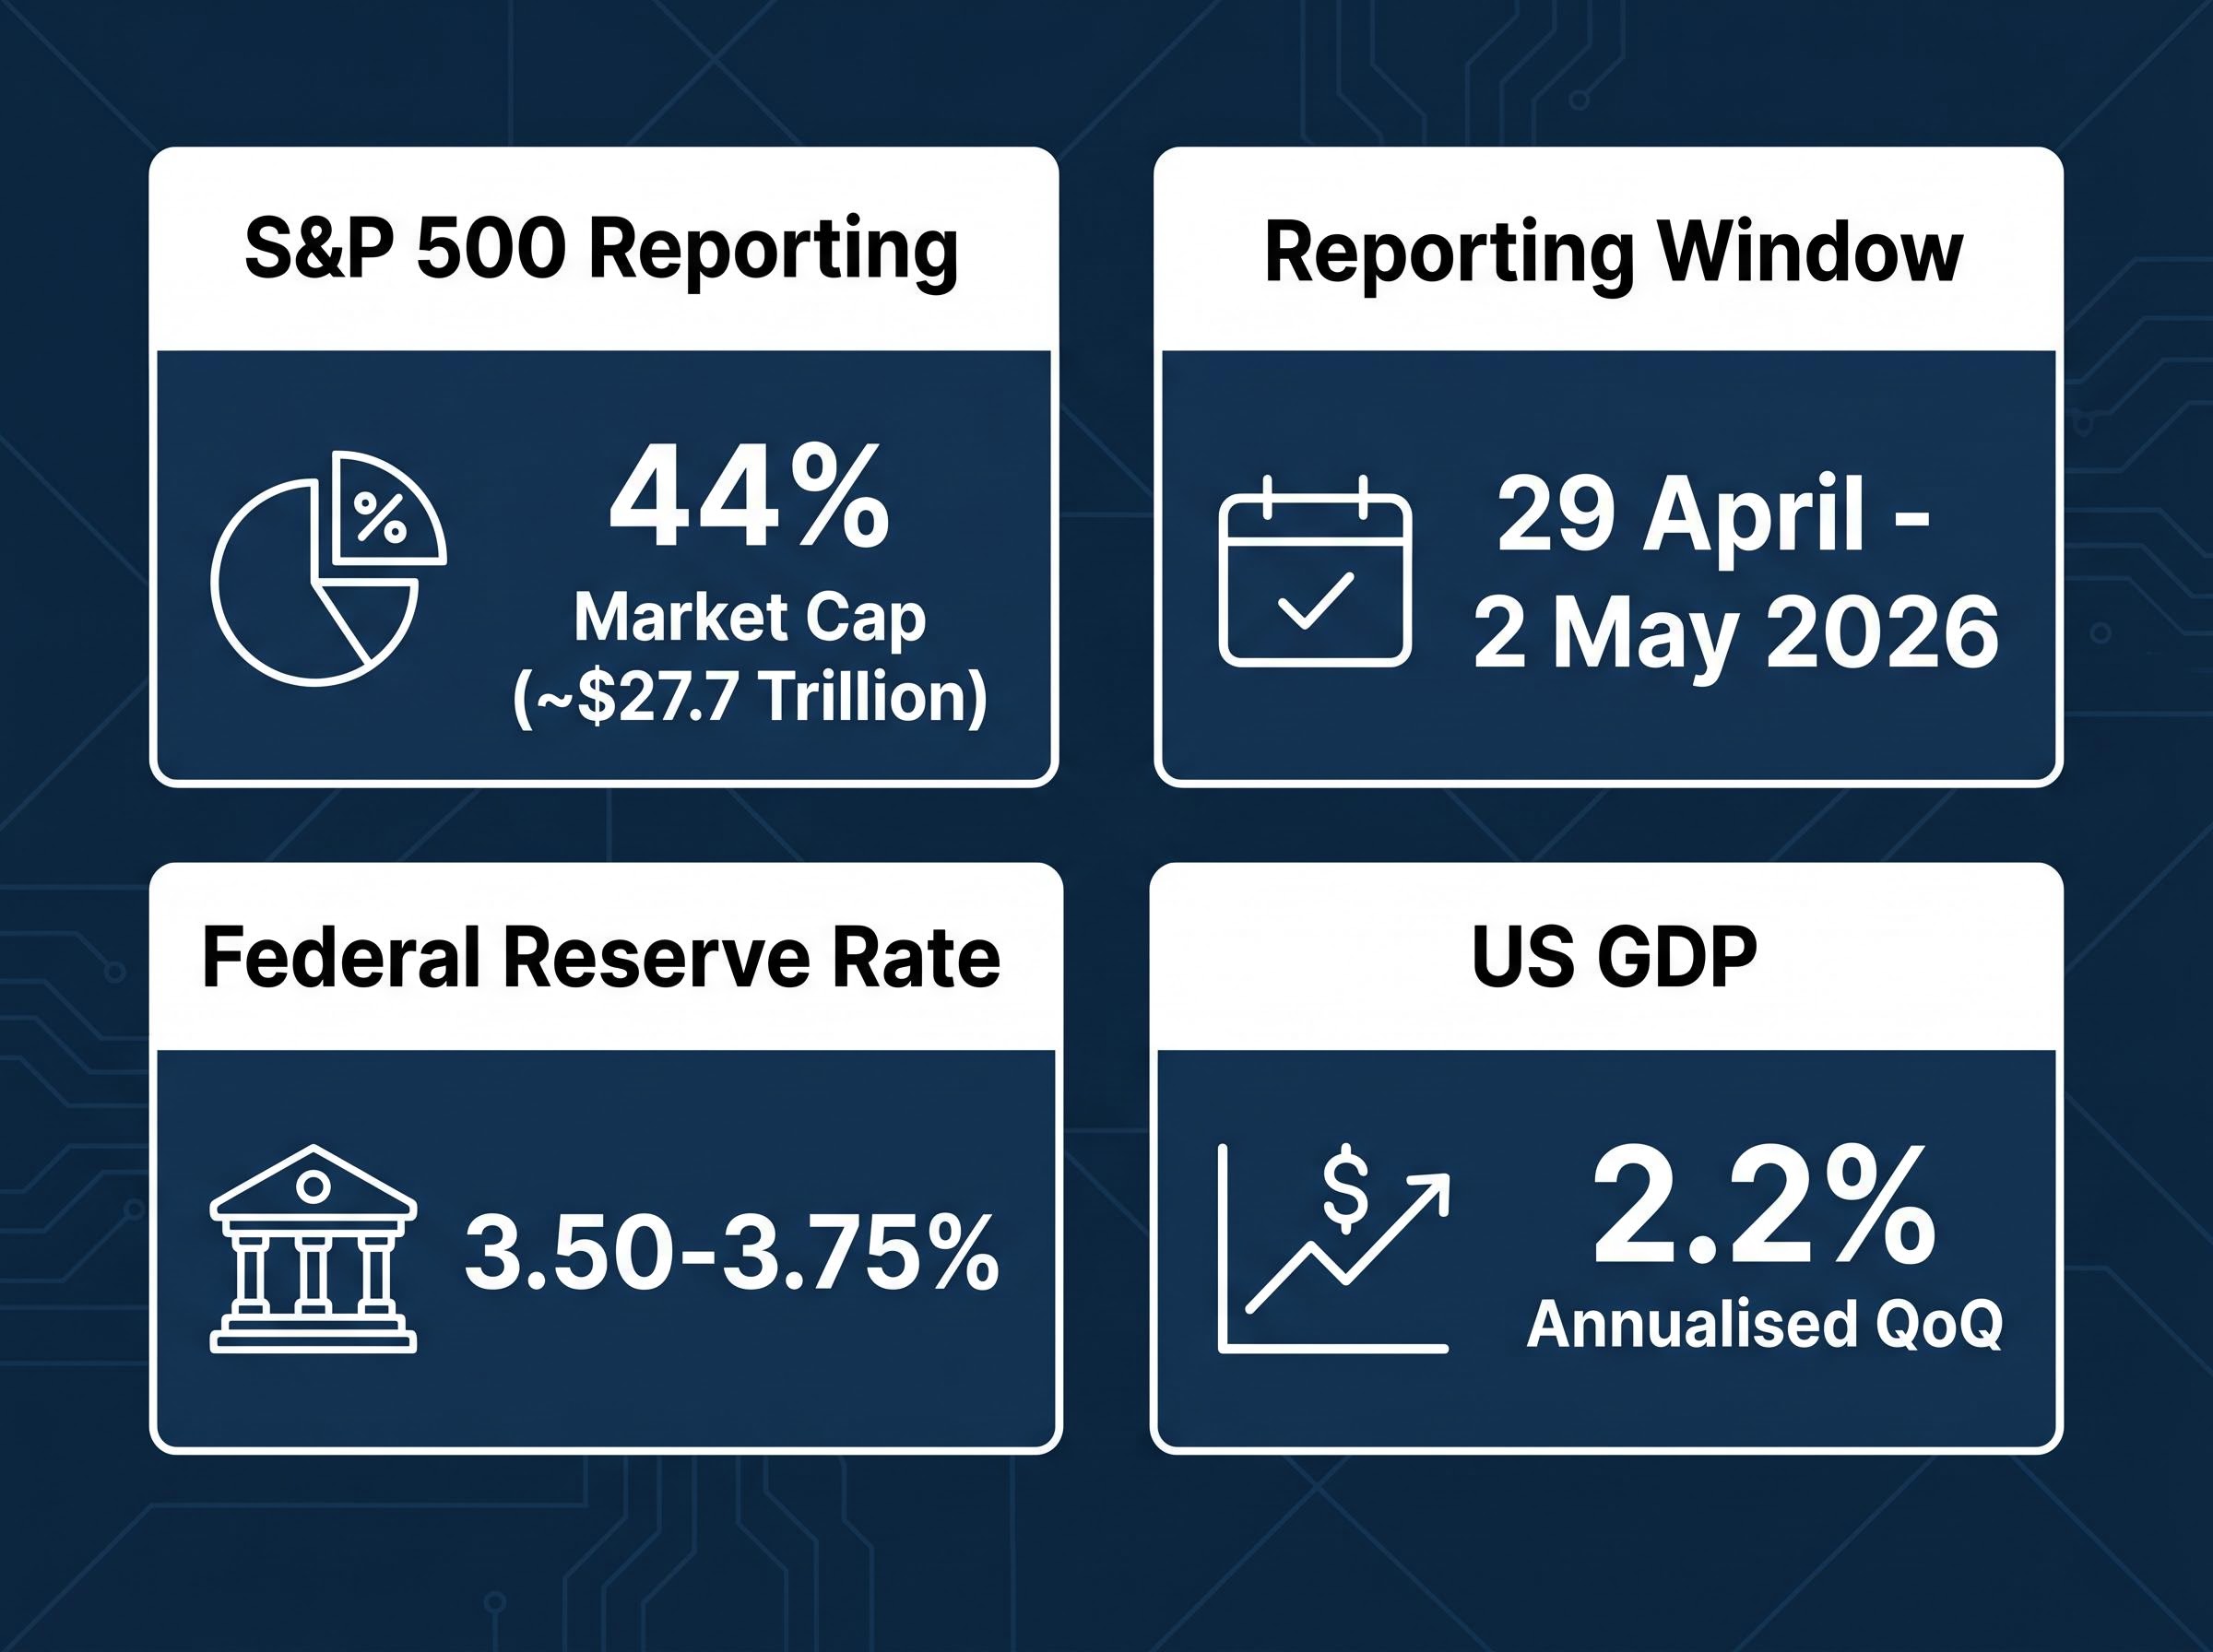
Companies representing approximately 44% of S&P 500 market cap, roughly $27.7 trillion in collective value, are reporting results this week in what amounts to one of the most consequential earnings stretches of 2026. The reporting window, running from 29 April through 2 May, spans five distinct sectors: technology, pharmaceuticals, energy, financials, and consumer goods. It arrives against a backdrop of record index levels, a Federal Reserve holding rates steady, and a GDP rebound that has given investors reason for optimism but little room for error.
What follows is a sector-by-sector framework for interpreting the results as they arrive. The focus is not on whether companies beat or miss consensus estimates, but on the forward guidance signals that will shape how the market prices the rest of 2026.
The numbers alone explain why this is not a routine reporting stretch.
Approximately 44% of S&P 500 market cap, roughly $27.7 trillion in combined company value, is reporting results within a single week.
That concentration means individual results carry outsized index-level consequences. A guidance miss from any single mega-cap reporter can move sector weightings and drag broad indices, not just the company’s own share price.
The sensitivity this week reflects a structural feature of the modern S&P 500: megacap tech index concentration means that a guidance miss from a single trillion-dollar company can reprice not just the stock but the index weighting around it, amplifying volatility across sectors that have no direct exposure to AI at all.
The macro backdrop amplifies this sensitivity. Heading into the week:
When markets are at record levels and monetary policy is on hold, the cost of disappointing forward guidance rises. Investors have already priced in the good news. What moves prices from here is what companies say about the quarters ahead.
Four of the largest technology companies in the world, Microsoft, Amazon, Alphabet, and Meta, all reported on or around 29 April 2026. The headline earnings figures matter less than a single underlying question: is AI capital expenditure generating returns, or is the spending running ahead of the revenue it is supposed to produce?
| Company | Pre-Report EPS Consensus | Pre-Report Revenue Consensus | Primary Investor Focus |
|---|---|---|---|
| Microsoft | $4.07 | ~$55.55B | Cloud growth vs. AI capex burden |
| Amazon | $1.62 | ~$177.2B | AWS growth rate, capex guidance |
| Alphabet | Not confirmed | Not confirmed | AI-driven ad revenue yield |
| Meta | Not confirmed | Not confirmed | AI ad tool performance |
The investor question for Microsoft and Amazon is specific: is AI infrastructure spending generating measurable acceleration in cloud revenue growth, or is it compressing margins without yet showing up in bookings? Amazon topped analyst estimates, which provides one data point. The commentary around AWS growth rate and any revisions to forward capex guidance will carry more weight than the beat itself.
For Alphabet and Meta, the AI question takes a different form. Both companies reported after the bell on 29 April, and the focus is on whether AI-assisted advertising tools are lifting revenue per impression and capturing a greater share of overall ad spend. The question is not how much they are spending on AI infrastructure, but whether that spending is making each advertising dollar on their platforms more effective.
AI capital expenditure, the phrase that appears in nearly every technology earnings preview, refers to something concrete: spending on data centres, specialised chips (primarily GPUs), and the infrastructure required to train and run large AI models. This spending shows up on a company’s cash flow statement as elevated capital expenditure, reducing free cash flow in the near term.
The mechanism connecting this spending to market valuations follows three steps:
The core investor question this week: are Big Tech’s AI investments generating revenue fast enough to justify the spending?
Investors wanting a rigorous framework for assessing whether these spending cycles are value-creating or value-destroying will find our dedicated guide to evaluating AI infrastructure investment useful; it covers the specific cash flow metrics, monetisation timelines, and operating margin signals that distinguish a productive capex cycle from one that is outrunning its revenue base.
Semiconductor stocks outperformed in the lead-up to this reporting window, a signal that the market had conviction around AI infrastructure demand heading into results. The GDP rebound to 2.2% also supports the advertising side of the equation, as stronger economic conditions tend to encourage advertisers to expand budgets.
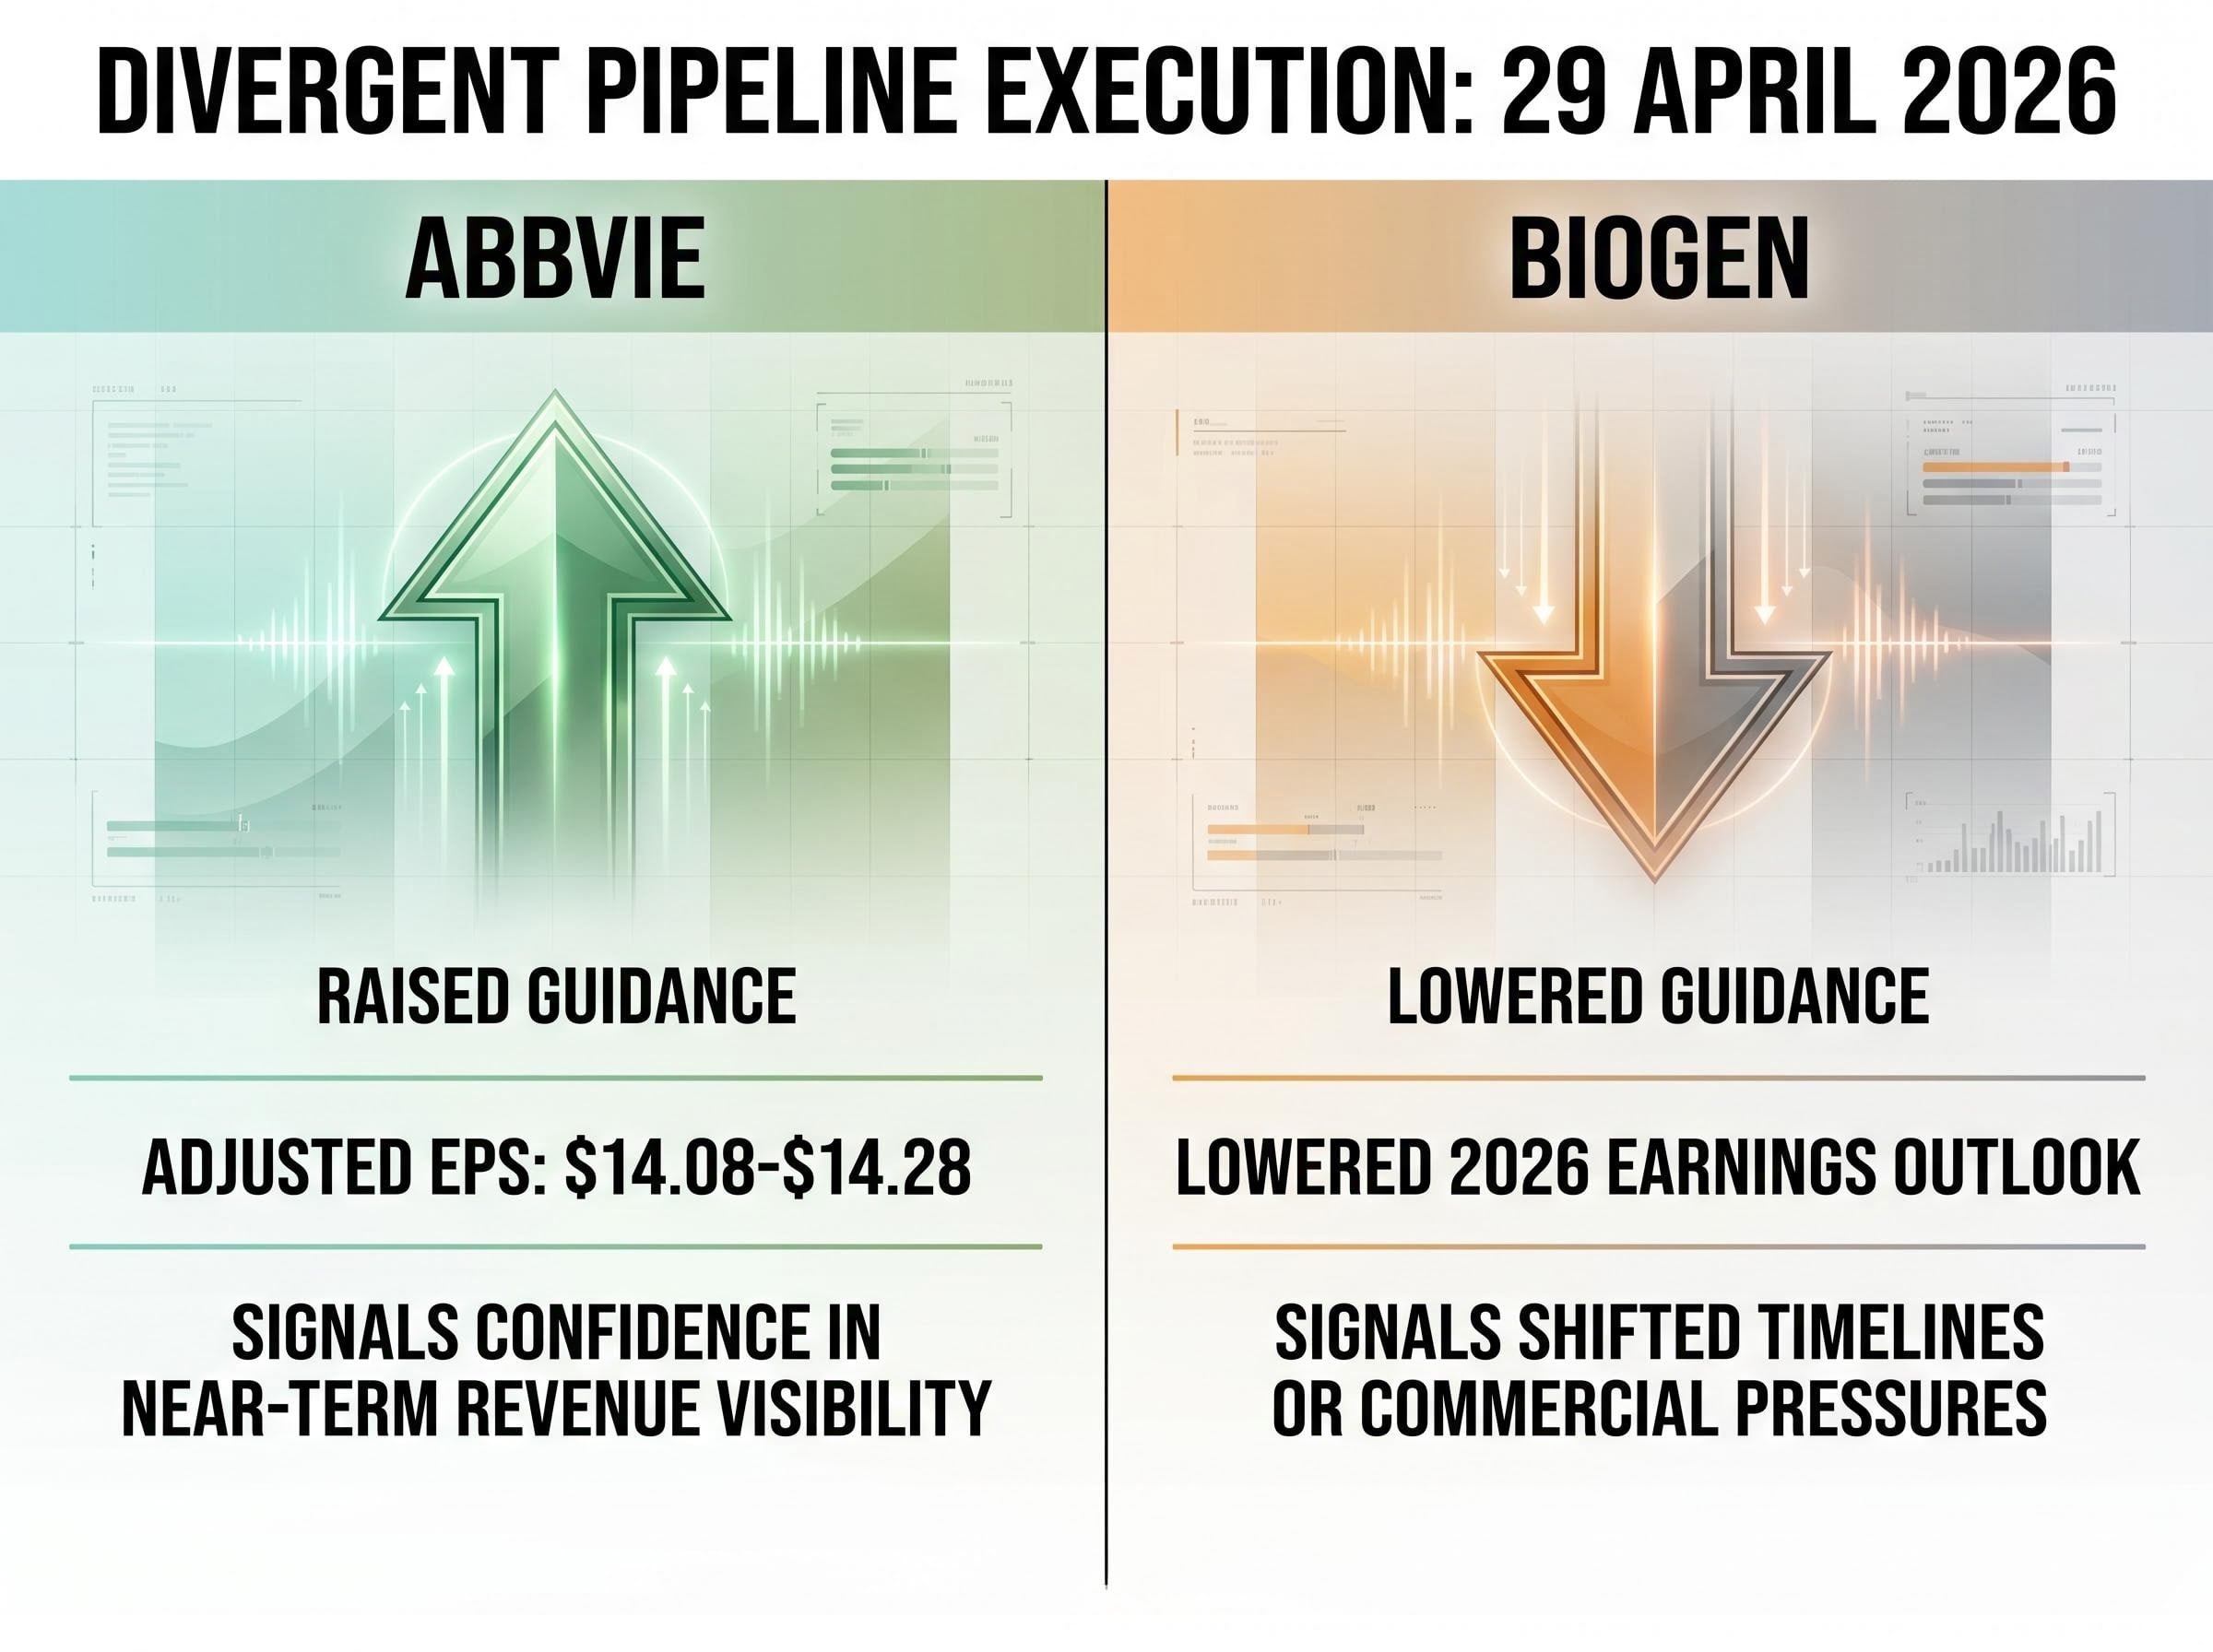
AbbVie and Biogen both reported on 29 April 2026. One raised guidance. The other lowered it. The contrast is the clearest illustration this earnings season of why pipeline execution, not current-quarter revenue, determines how pharma stocks move after results.
AbbVie raised its full-year adjusted EPS guidance to $14.08-$14.28, a signal that management has sufficient confidence in near-term revenue visibility, typically driven by strong prescription trends or pipeline milestones, to commit to a higher earnings floor for the year.
AbbVie’s raised guidance range of $14.08-$14.28 in adjusted EPS reflects management confidence in full-year revenue visibility.
Biogen moved in the opposite direction, lowering its 2026 earnings outlook. In pharma, a guidance cut often signals that pipeline timelines have shifted, a key product is underperforming commercially, or competitive pressures are intensifying. The two reports, arriving on the same day, offer investors a side-by-side study in divergent pipeline execution.
| Company | Guidance Direction | Key Focus Area |
|---|---|---|
| AbbVie | Raised (EPS $14.08-$14.28) | Revenue visibility, prescription trends |
| Biogen | Lowered | Pipeline execution, commercial pressures |
| Regeneron | Results public | Pipeline updates, guidance revisions |
| Gilead Sciences | Pending | Pipeline updates, guidance revisions |
Regeneron results are public as of 29 April, with pipeline updates and guidance revisions the primary areas of investor focus. Gilead Sciences is also expected to report within the week, though specific timing remains unconfirmed.
Energy and financial sector results rarely generate the same headlines as Big Tech earnings. They should. These reports provide a ground-level read on real economic activity that macro data alone cannot supply.
Exxon Mobil and ConocoPhillips are both expected to report this week, though specific timing remains unconfirmed. The context heading into their results: US crude inventory drew down by approximately 1.79 million barrels in the week ended 24 April 2026, a data point that suggests demand held firm despite broader economic uncertainty.
The investor focus for both companies is on demand-side commentary in their forward guidance. Specific Wall Street consensus EPS estimates for Exxon Mobil and ConocoPhillips are not available from public sources; FactSet or Bloomberg terminal data would be the appropriate reference for precise figures.
Berkshire Hathaway is scheduled to report this week, with three metrics in focus: cash position (a signal about deployment opportunity or caution), share buyback activity, and insurance underwriting performance. With the Fed holding rates at 3.50-3.75%, capital management decisions across the financial sector carry particular weight, as the rate environment shapes both lending margins and investment return assumptions.
Mastercard’s transaction volume data, in particular, provides one of the most reliable real-time reads on consumer spending health available to investors.
Mastercard’s transaction volume signals carry weight beyond the consumer spending read they provide in isolation; in an environment where oil prices above $100 per barrel are compressing household purchasing power at the lower end of the income distribution, aggregate digital payment volumes can mask a K-shaped split between resilient high-income spending and deteriorating mass-market demand.
At record index levels, with the Fed signalling a single rate cut and GDP at 2.2% annualised, the current quarter’s backward-looking numbers are already partially priced in. What moves markets from here is what management teams say about the rest of 2026.
At record market levels, guidance is the earnings number that matters.
Three guidance signals carry the most directional weight this week:
Consumer goods reporters round out the picture. Hershey, Chipotle, Yum! Brands, and Altria are scheduled through 2 May, where margin commentary on inflation pass-through will offer the final read on consumer health heading into Q2.
Consumer spending resilience in aggregate retail data has consistently overstated household financial health in 2026, with a personal savings rate of 4.0% in February signalling that much of the spending holding up headline figures is being funded by savings drawdowns rather than income growth, a dynamic that makes the margin commentary from Hershey, Chipotle, and Yum! Brands more consequential than it might otherwise appear.
The reporting window from 29 April through 2 May 2026 covers five sectors, each with a distinct signal to watch. The table below condenses the analytical framework built across this article.
| Sector | Key Company(ies) | Primary Signal to Watch |
|---|---|---|
| Technology | Microsoft, Amazon, Alphabet, Meta | AI capex payback, cloud/ad revenue response |
| Pharma | AbbVie, Biogen, Regeneron, Gilead | Guidance direction (raised vs. lowered) |
| Energy | Exxon Mobil, ConocoPhillips | Demand commentary, production guidance |
| Financials | Berkshire Hathaway, Mastercard, AIG | Cash deployment, transaction volumes |
| Consumer Goods | Hershey, Chipotle, Yum! Brands, Altria | Margin commentary, inflation pass-through |
This week’s results function as a leading indicator for the full-year 2026 earnings trajectory, not merely a Q1 scorecard. Data gaps remain: Apple’s specific report timing is unconfirmed (pre-report consensus sits at approximately EPS $2.53 on revenue of ~$8.81 billion), and consensus estimates for Exxon Mobil, ConocoPhillips, and Berkshire Hathaway require terminal-level sourcing. Roughly 178 companies were expected to report on 28 April alone, illustrating the density of the window.
This reporting week will set the tone for how the market prices the rest of 2026. The numbers that matter most have not been printed yet; they are in the guidance.
This article is for informational purposes only and should not be considered financial advice. Investors should conduct their own research and consult with financial professionals before making investment decisions. Forward-looking statements, including management guidance figures and analyst consensus estimates, are subject to change based on market developments and company performance.
An earnings preview analyses what investors should watch before companies report financial results, focusing on consensus estimates, guidance signals, and sector-specific catalysts rather than just whether a company beats or misses expectations.
Companies representing approximately 44% of S&P 500 market cap, roughly $27.7 trillion in combined value, are reporting within a single week from 29 April through 2 May 2026, meaning individual results carry outsized consequences for broad index movements.
The critical question for Microsoft, Amazon, Alphabet, and Meta is whether AI capital expenditure is generating measurable revenue acceleration in cloud and advertising, or whether spending is compressing margins without yet producing offsetting growth.
Quarterly results reflect past performance that markets have often already partially priced in, while forward guidance tells investors what management expects for coming quarters, making it the more market-moving signal when indices are at record levels.
Hershey, Chipotle, Yum! Brands, and Altria are scheduled to report through 2 May 2026, with margin commentary on inflation pass-through serving as the key indicator of consumer health heading into Q2, particularly given the current 4.0% personal savings rate.