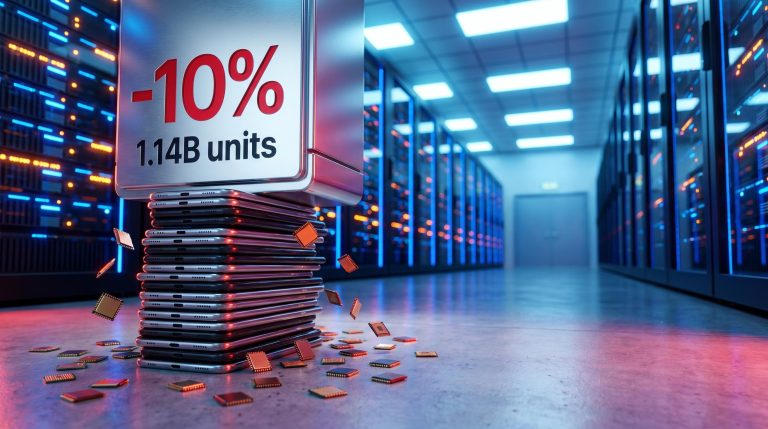
Goldman Sachs Cuts 2026 Smartphone Shipment Forecast 10% on AI Crunch
2 hrs ago

Major United States technology firms are projected to spend up to $700 billion on hardware in 2026 alone. Wall Street is currently navigating the late April 2026 earnings season, anxiously awaiting financial disclosures that can justify these massive capital outlays. The stakes have never been higher for retail investors and financial professionals holding concentrated equity positions.
AI infrastructure investment as a strategic corporate mandate has completely altered the foundations of the equities market. What follows is a practical framework for critically diagnosing corporate balance sheets and understanding the necessary cash flow sacrifices.
Readers will learn how to navigate the elusive search for top-line revenue in the era of advanced computing. This guide provides the tools to look past optimistic executive summaries and evaluate the true financial health of the sector.
Understanding modern corporate spending requires shifting focus from intangible software development to heavy industrial mechanics. Capital expenditures in 2026 represent physical, tangible technology infrastructure rather than traditional operating expenses like marketing or payroll. Evaluate these infrastructure investments not as agile digital assets, but as massive construction projects demanding enormous upfront capital.
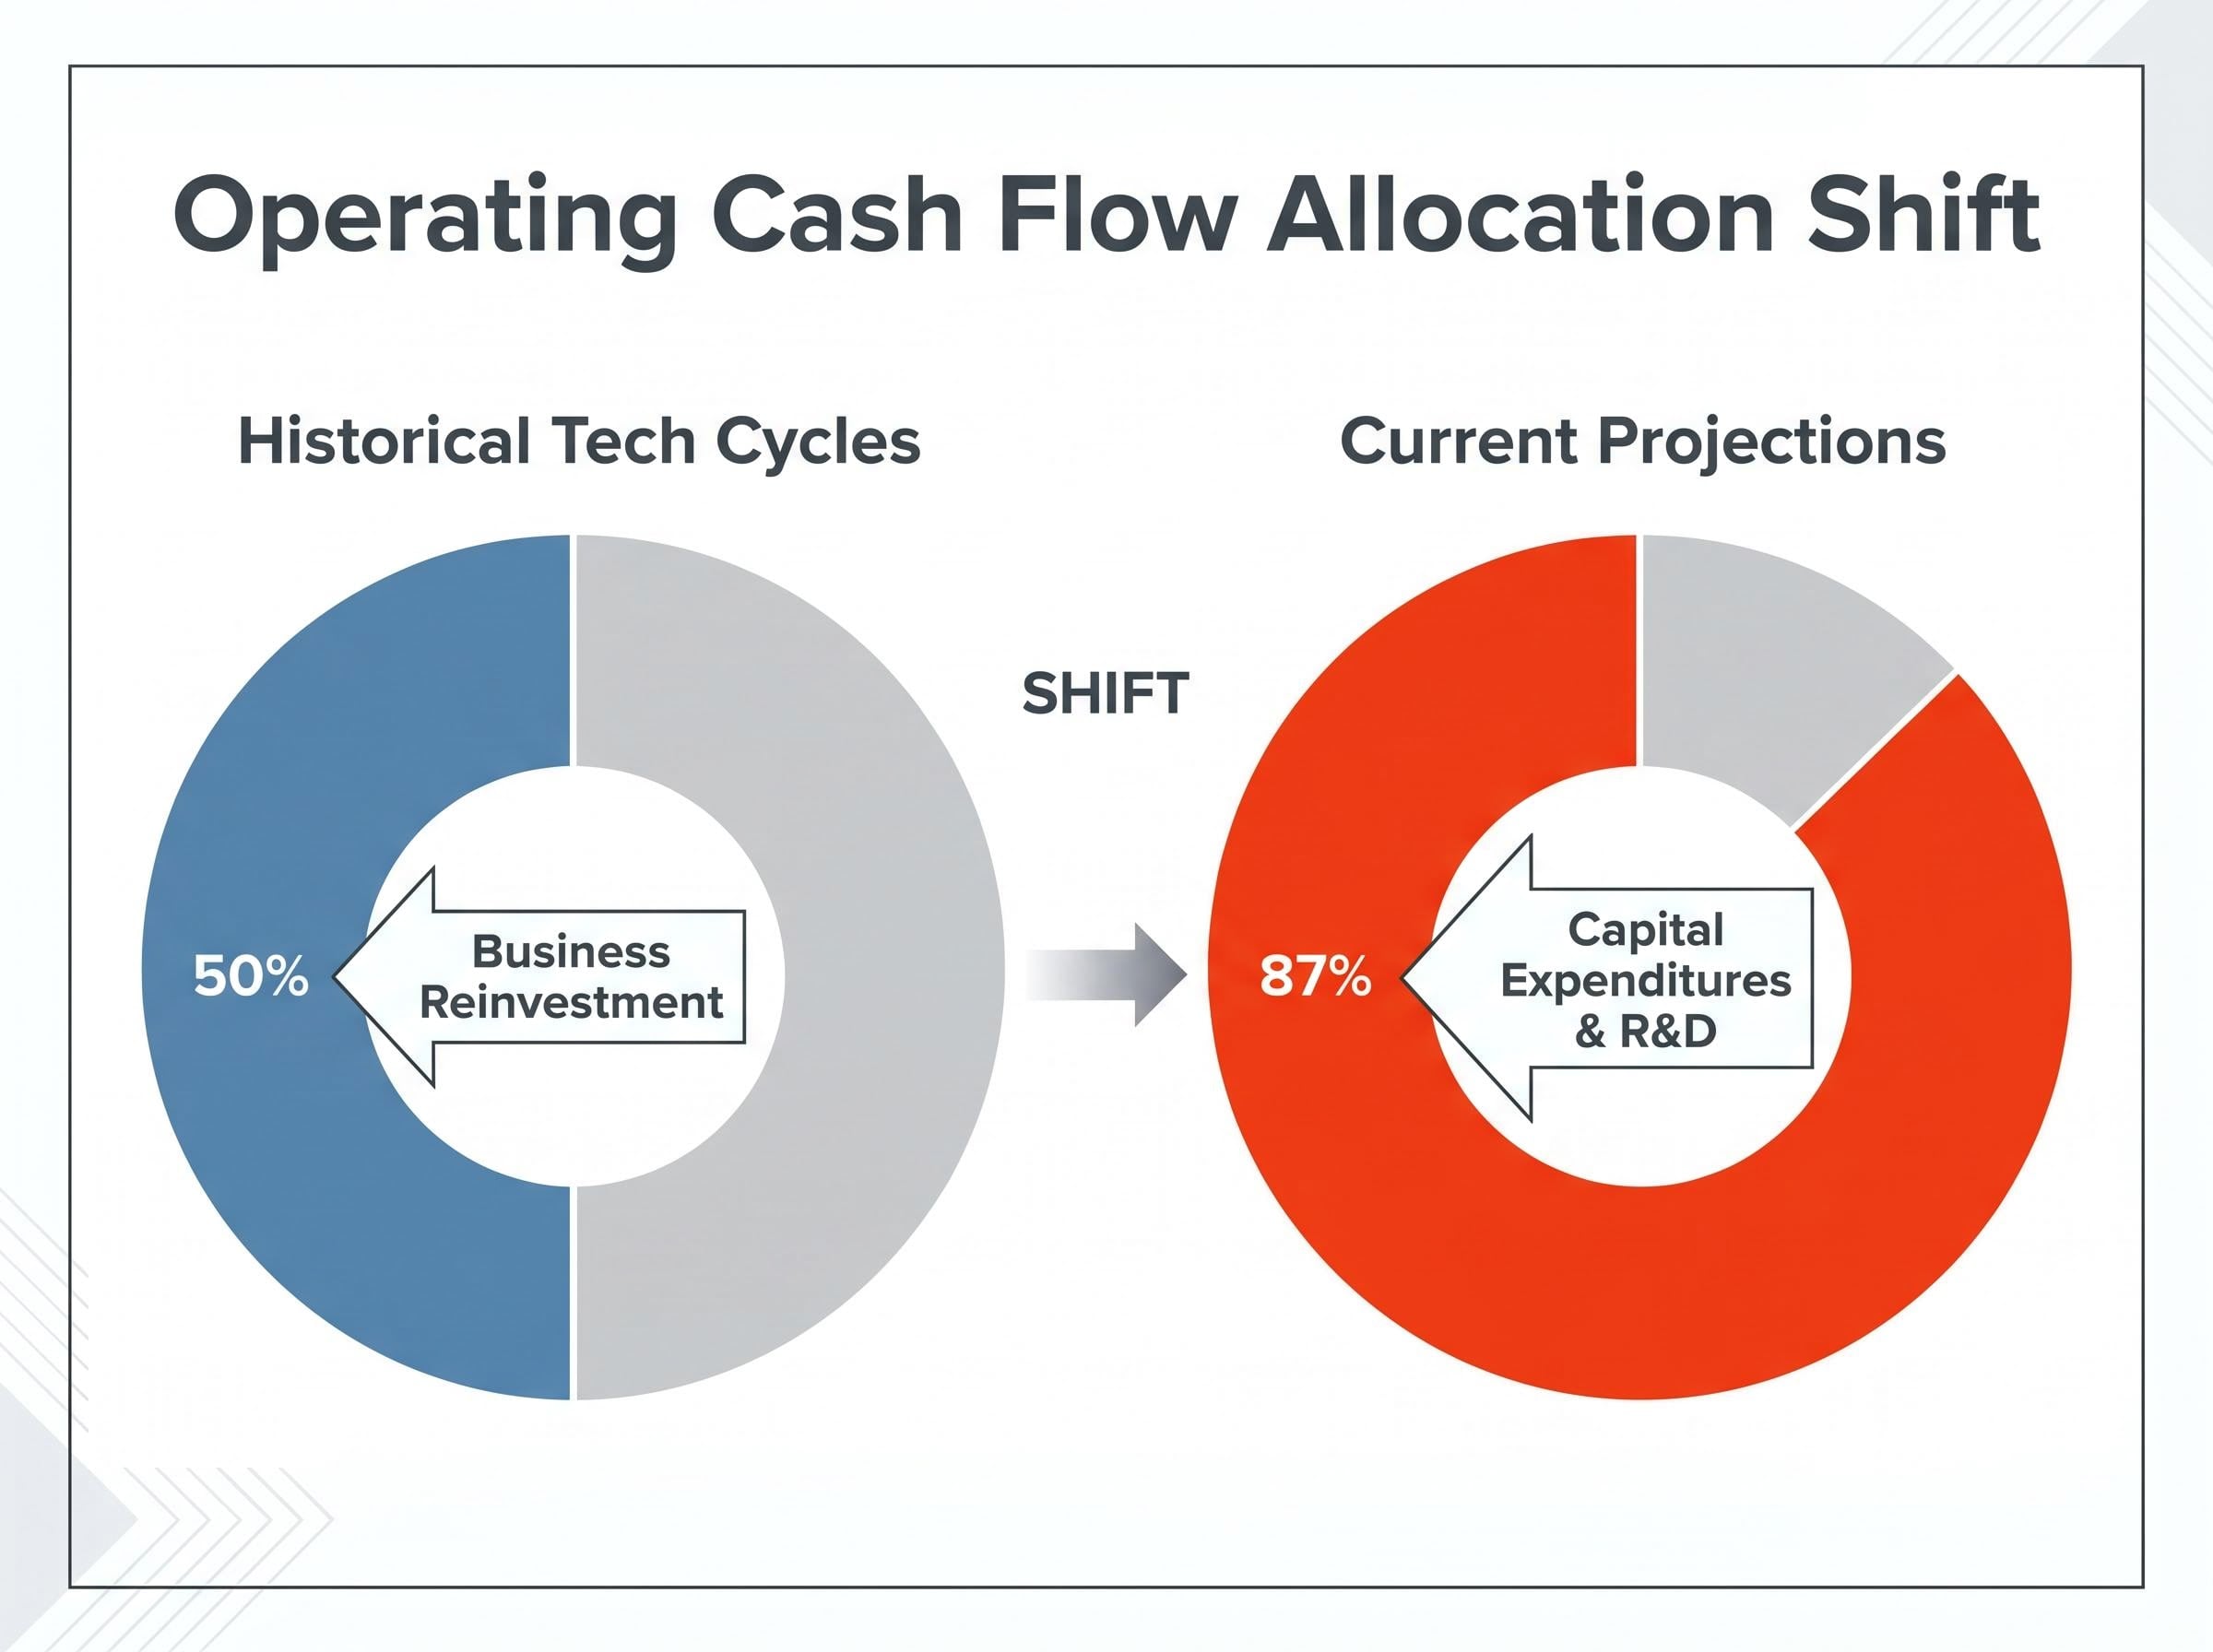
According to industry data, historical technology cycles typically saw companies utilise roughly 50% of their operating cash flow for business reinvestment. Current projections show a dramatic shift in this paradigm. Major firms are now directing an estimated 87% of their operating cash flow straight into capital expenditures and research development.
According to industry analysis, approximately 60% of Alphabet’s specific hardware budget now goes directly to proprietary servers such as graphics processing units and tensor processing units.
This unprecedented level of capital intensity means investors must learn to separate routine operational costs from generational hardware bets. A failure to distinguish between the two can lead to catastrophic portfolio misallocations. Diagnose these capital deployments by looking for the following physical components:
Evaluating these risks requires tracking hardware supply chain bottlenecks, as memory shortages often delay the rapid deployment of these ambitious infrastructure budgets.
Specialised graphics processing units requiring advanced fabrication and extended supply chain lead times Liquid cooling systems designed specifically for high-density computing arrays Expanded power facilities capable of sustaining massive continuous energy loads without grid interruption Acquisition of vast data centre real estate across multiple global jurisdictions to house server racks
The current buildout demands a perspective shift from abstract growth concepts to staggering, tangible dollar amounts. These are no longer standard corporate operating budgets designed for steady margin expansion. They are nation-state level infrastructure commitments designed to secure generational market dominance at almost any short-term cost.
Amazon has committed a staggering budget of $200 billion for the current calendar year. Alphabet forward guidance points to an immense outlay of $175 billion to $185 billion. Microsoft is currently operating at an annualised run rate of roughly $150 billion, while Meta has guided for $115 billion to $135 billion.
These figures reflect rapid upward revisions from major financial institutions as power demand and capacity requirements escalate continuously. Goldman Sachs released a hyperscaler capex consensus upgrade in February 2026, aggressively raising their forecast to $561 billion.
The underlying Goldman Sachs investment forecast attributes these continued upward revisions directly to the escalating physical power demands and capacity requirements of advanced artificial intelligence models.
By seeing the exact financial breakdown by company, investors can accurately gauge which platforms are taking the most aggressive financial risks. Evaluate the sheer scale of these corporate commitments against their current market footprint using the comparative data below.
| Company | 2026 Projected Capex | Late April 2026 Market Cap | S&P 500 Footprint Weight |
|---|---|---|---|
| Amazon | $200 billion | $2.58 trillion | ~4.5% |
| Alphabet | $175 billion to $185 billion | $3.89 trillion | ~6.7% |
| Microsoft | ~$150 billion | $2.85 trillion | ~4.9% |
| Meta | $115 billion to $135 billion | $1.70 trillion | ~2.9% |
The market optimism surrounding advanced computing often masks a stark reality of rapidly shrinking corporate cash reserves. Massive capital expenditures share a direct, inverse relationship with short-term free cash flow. When billions flow continuously into data centre real estate and physical hardware, the remaining liquid capital available to shareholders compresses rapidly.
Financial projections for 2026 show severe balance sheet degradation across the sector as infrastructure spending reaches its absolute peak. A severe reduction in free cash flow strictly limits a company’s ability to execute share buybacks or issue regular dividends. This directly impacts the tangible shareholder returns that typically support and justify premium equity valuations in the technology sector.
Amazon is currently on a defined trajectory toward negative free cash flow for the year, as infrastructure costs rapidly outpace its top-line revenue growth. Alphabet is projected to see its free cash flow plummet drastically from $73.3 billion in 2025 to an estimated $8.2 billion in 2026.
“Industry analysts warn that Big Tech free cash flow could drop by up to 90% in 2026 as companies prioritise hyperscaler infrastructure over short-term liquidity and shareholder distributions.”
Financial analysts model this prolonged period of compressed liquidity as a structural cash flow trough. The trough represents the lowest point of capital reserves before new physical infrastructure theoretically begins generating compensating service revenue.
Identify a successful exit from this deficit by tracking sequential quarterly improvements in operating cash margins rather than relying on absolute revenue alone. Companies sinking deeper into the trough will show accelerating capital expenditure growth paired with flat or declining software margins.
This dynamic teaches investors why a technology conglomerate can appear highly profitable on a standard income statement while still facing a severe internal cash crunch. Evaluate these underlying metrics carefully to avoid being spooked by sudden institutional shareholder rotations out of the sector.
Investors exploring how capital might shift during this liquidity squeeze will find our comprehensive walkthrough of big tech sector rotation, which tracks how institutional funds are actively fleeing dominant leaders for undervalued alternatives.
A core monetisation transparency problem is currently frustrating the market as the late April 2026 earnings season unfolds in real time. Massive spending realities are aggressively colliding with opaque, unproven revenue generation models. Financial strategists are growing increasingly impatient, demanding concrete proof that physical facility expansions will directly boost top-line sales.
Corporate leadership frequently cites strong customer demand in their forward guidance. However, there is a material difference between running a server facility at full capacity and actually delivering profitable cloud hosting margins. Meta and Alphabet have maintained deliberate, frustrating silence on specific financial returns tied directly to their infrastructure outlays.
An extensive MIT enterprise integration study found that nearly all companies adopting these generative models currently struggle to generate any tangible return on investment, casting doubt on the immediate enterprise demand narrative.
Microsoft has provided qualitative assertions regarding full data centre capacity and customer waitlists, but they lack specific, verifiable dollar quantifications. Look past optimistic corporate narratives and demand concrete return on investment timelines. When companies continuously obfuscate their direct revenue attribution, the risk of a speculative valuation bubble increases significantly.
Financial strategists have reached a broad consensus that corporate leadership faces a strict one-year timeline to prove these investments are generating top-line sales. If cloud providers cannot monetise their dramatically expanded capacity within four quarters, they will likely reduce their future hardware orders to preserve capital. A reduction in hyperscaler capacity orders would immediately collapse the elevated valuations of downstream processor manufacturers and supply chain vendors.
Monitor upcoming quarterly reports meticulously for the following specific financial milestones:
This specific silicon gamble structurally impacts the broader United States equities market and passive index fund holders alike. The unprecedented mega-capitalisation of these few technology companies strictly dictates the health of the entire stock market. Advanced computing-related stocks represent a staggering 45% of the S&P 500 index’s total $57.6 trillion market capitalisation as of mid-April 2026.
The Big Four companies alone account for a massive 19% weighting in the primary benchmark. Derivatives markets and options pricing heavily reflect underlying anxiety about the impending quarterly disclosures from these giants.
This heavy weighting fundamentally alters passive index investing risks, transforming ostensibly diversified portfolios into highly concentrated bets on global digital infrastructure.
According to market data, options trading currently implies post-earnings valuation shifts of 4% for Amazon and 7.1% for Meta. Interestingly, these implied moves remain notably lower than their 12-quarter historical averages. This suggests the broader market may be significantly underpricing the volatility risk.
A failure to comprehensively demonstrate software-level returns threatens to trigger a severe ripple effect across the broader index. According to market data, the primary benchmark tracking semiconductor equities has climbed 40% in the current calendar year, pricing in perfection. Evaluate the cascade of risks from cloud hosting platforms down to hardware manufacturers using this framework:
Index funds hold unprecedented concentration risk tied exclusively to a single capital expenditure cycle Semiconductor manufacturers remain entirely dependent on sustained hyperscaler order volume to justify current multiples Energy and utility equities face sudden demand shocks if data centre expansion pauses unexpectedly Broad market sentiment hinges heavily on the free cash flow reporting of just four massive technology conglomerates
The core tension defining the current tech cycle is the unprecedented scale of capital expenditures weighed against the urgent need for tangible revenue growth. The true financial test of these generational infrastructure investments will unfold over the next four quarters as drastic free cash flow drops become undeniable.
Use this analytical framework to evaluate all upcoming quarterly reports by focusing strictly on the ratio between capital allocated and new top-line cloud revenue generated. If the projected revenue does not materialise to successfully plug the cash flow trough, the broader equities market will face a significant and potentially painful recalibration.
For investors concerned about escalating inference costs and unproven software margins, our deep-dive into the hardware valuation bubble examines how long hyperscalers can sustain this spending without jeopardising their core profitability.
This article is for informational purposes only and should not be considered financial advice. Investors should conduct their own research and consult with financial professionals before making investment decisions. Past performance does not guarantee future results, and financial projections are subject to market conditions and various risk factors.
The dramatic increase in AI infrastructure investment is primarily driven by the strategic corporate mandate to secure generational market dominance through advanced computing, demanding massive upfront capital for physical hardware like GPUs and data centers. This reflects escalating physical power demands and capacity requirements for advanced AI models.
Massive capital expenditures are severely compressing free cash flow for major tech firms in 2026, with some like Alphabet projected to see significant drops. This reduction strictly limits a company's ability to execute share buybacks or issue regular dividends, impacting tangible shareholder returns.
The cash flow trough refers to a prolonged period of compressed liquidity when companies invest heavily in infrastructure, representing the lowest point of capital reserves. It is the period before new physical infrastructure theoretically begins generating compensating service revenue.
Investors should monitor sequential quarterly improvements in operating cash margins, explicit breakouts of computing-driven revenue strictly separate from legacy sales, and a stated plateau or reduction target for future capital expenditure guidance. Resumption of share repurchase programs also signals renewed cash generation.
Advanced computing-related stocks, driven by AI infrastructure spending, represent a staggering 45% of the S&P 500's total market capitalization. This creates significant concentration risk, making the broader market heavily dependent on the performance and free cash flow reporting of these few technology conglomerates.