
Four technology companies now control a staggering $11.6 trillion in combined market capitalisation, creating a gravitational pull that distorts traditional market benchmarks. The sheer scale of these megacap tech stocks requires investors to rethink standard portfolio diversification and risk management strategies. As the late April 2026 earnings season unfolds, derivative markets are signalling massive implied volatility for these exact market leaders.
Options traders are pricing in violent single-day swings for the upcoming financial disclosures, anticipating turbulent price action. The combination of concentrated index weights and unprecedented artificial intelligence infrastructure spending creates a unique structural environment for the S&P 500. Investors must understand how aggressive hardware capital deployment and options pricing mechanics intersect to evaluate broader index vulnerability.
This analysis examines how corporate spending targets and derivative market data triangulate to expose both outsized risks and opportunities in broad United States equities. The fundamental drivers dictating market performance have narrowed to a historically small cohort of corporate balance sheets.
The Mechanics of Market Weight and Options Pricing
A capitalisation-weighted index functions by assigning representation based on total market value rather than an equal share per company. The S&P 500 operates on this methodology, meaning the largest corporations dictate the directional movement of the entire benchmark. A minor percentage move in a massive entity mathematically overrides substantial price fluctuations in hundreds of smaller index constituents.
Relying solely on cap-weighted benchmarks often results in investors fundamentally underpricing stock market risk, especially when structural vulnerabilities coincide with unprecedented corporate concentration.
According to market analysts, this top-heavy structure proved highly influential during the October 2022 market recovery, which was driven predominantly by just seven entities. Today, the combined valuation of the top four technology giants exceeds $10 trillion, compounding this structural sensitivity.
To gauge how these massive entities might move, analysts look to implied volatility in the options market. Implied volatility represents the expected future price fluctuations of a security, as priced by traders buying and selling options contracts. It acts as a forward-looking risk gauge for upcoming events and financial disclosures.
Understanding how these two mechanics interact is essential for novices evaluating modern index funds before examining current Q1 2026 volatility data.
Market capitalisation weighting: An index structure where a company’s influence is strictly proportional to its total market value, heavily favouring the largest corporations. Equal weighting: An alternative index structure where every constituent receives the exact same allocation regardless of its total corporate valuation. * Implied volatility: A metric derived from options pricing that captures the market’s forecast of a likely movement in a security’s price.
When high implied volatility meets massive index weighting, the broader market absorbs the shockwaves.
When big ASX news breaks, our subscribers know first
Analysing the 19 Percent Footprint in the S&P 500
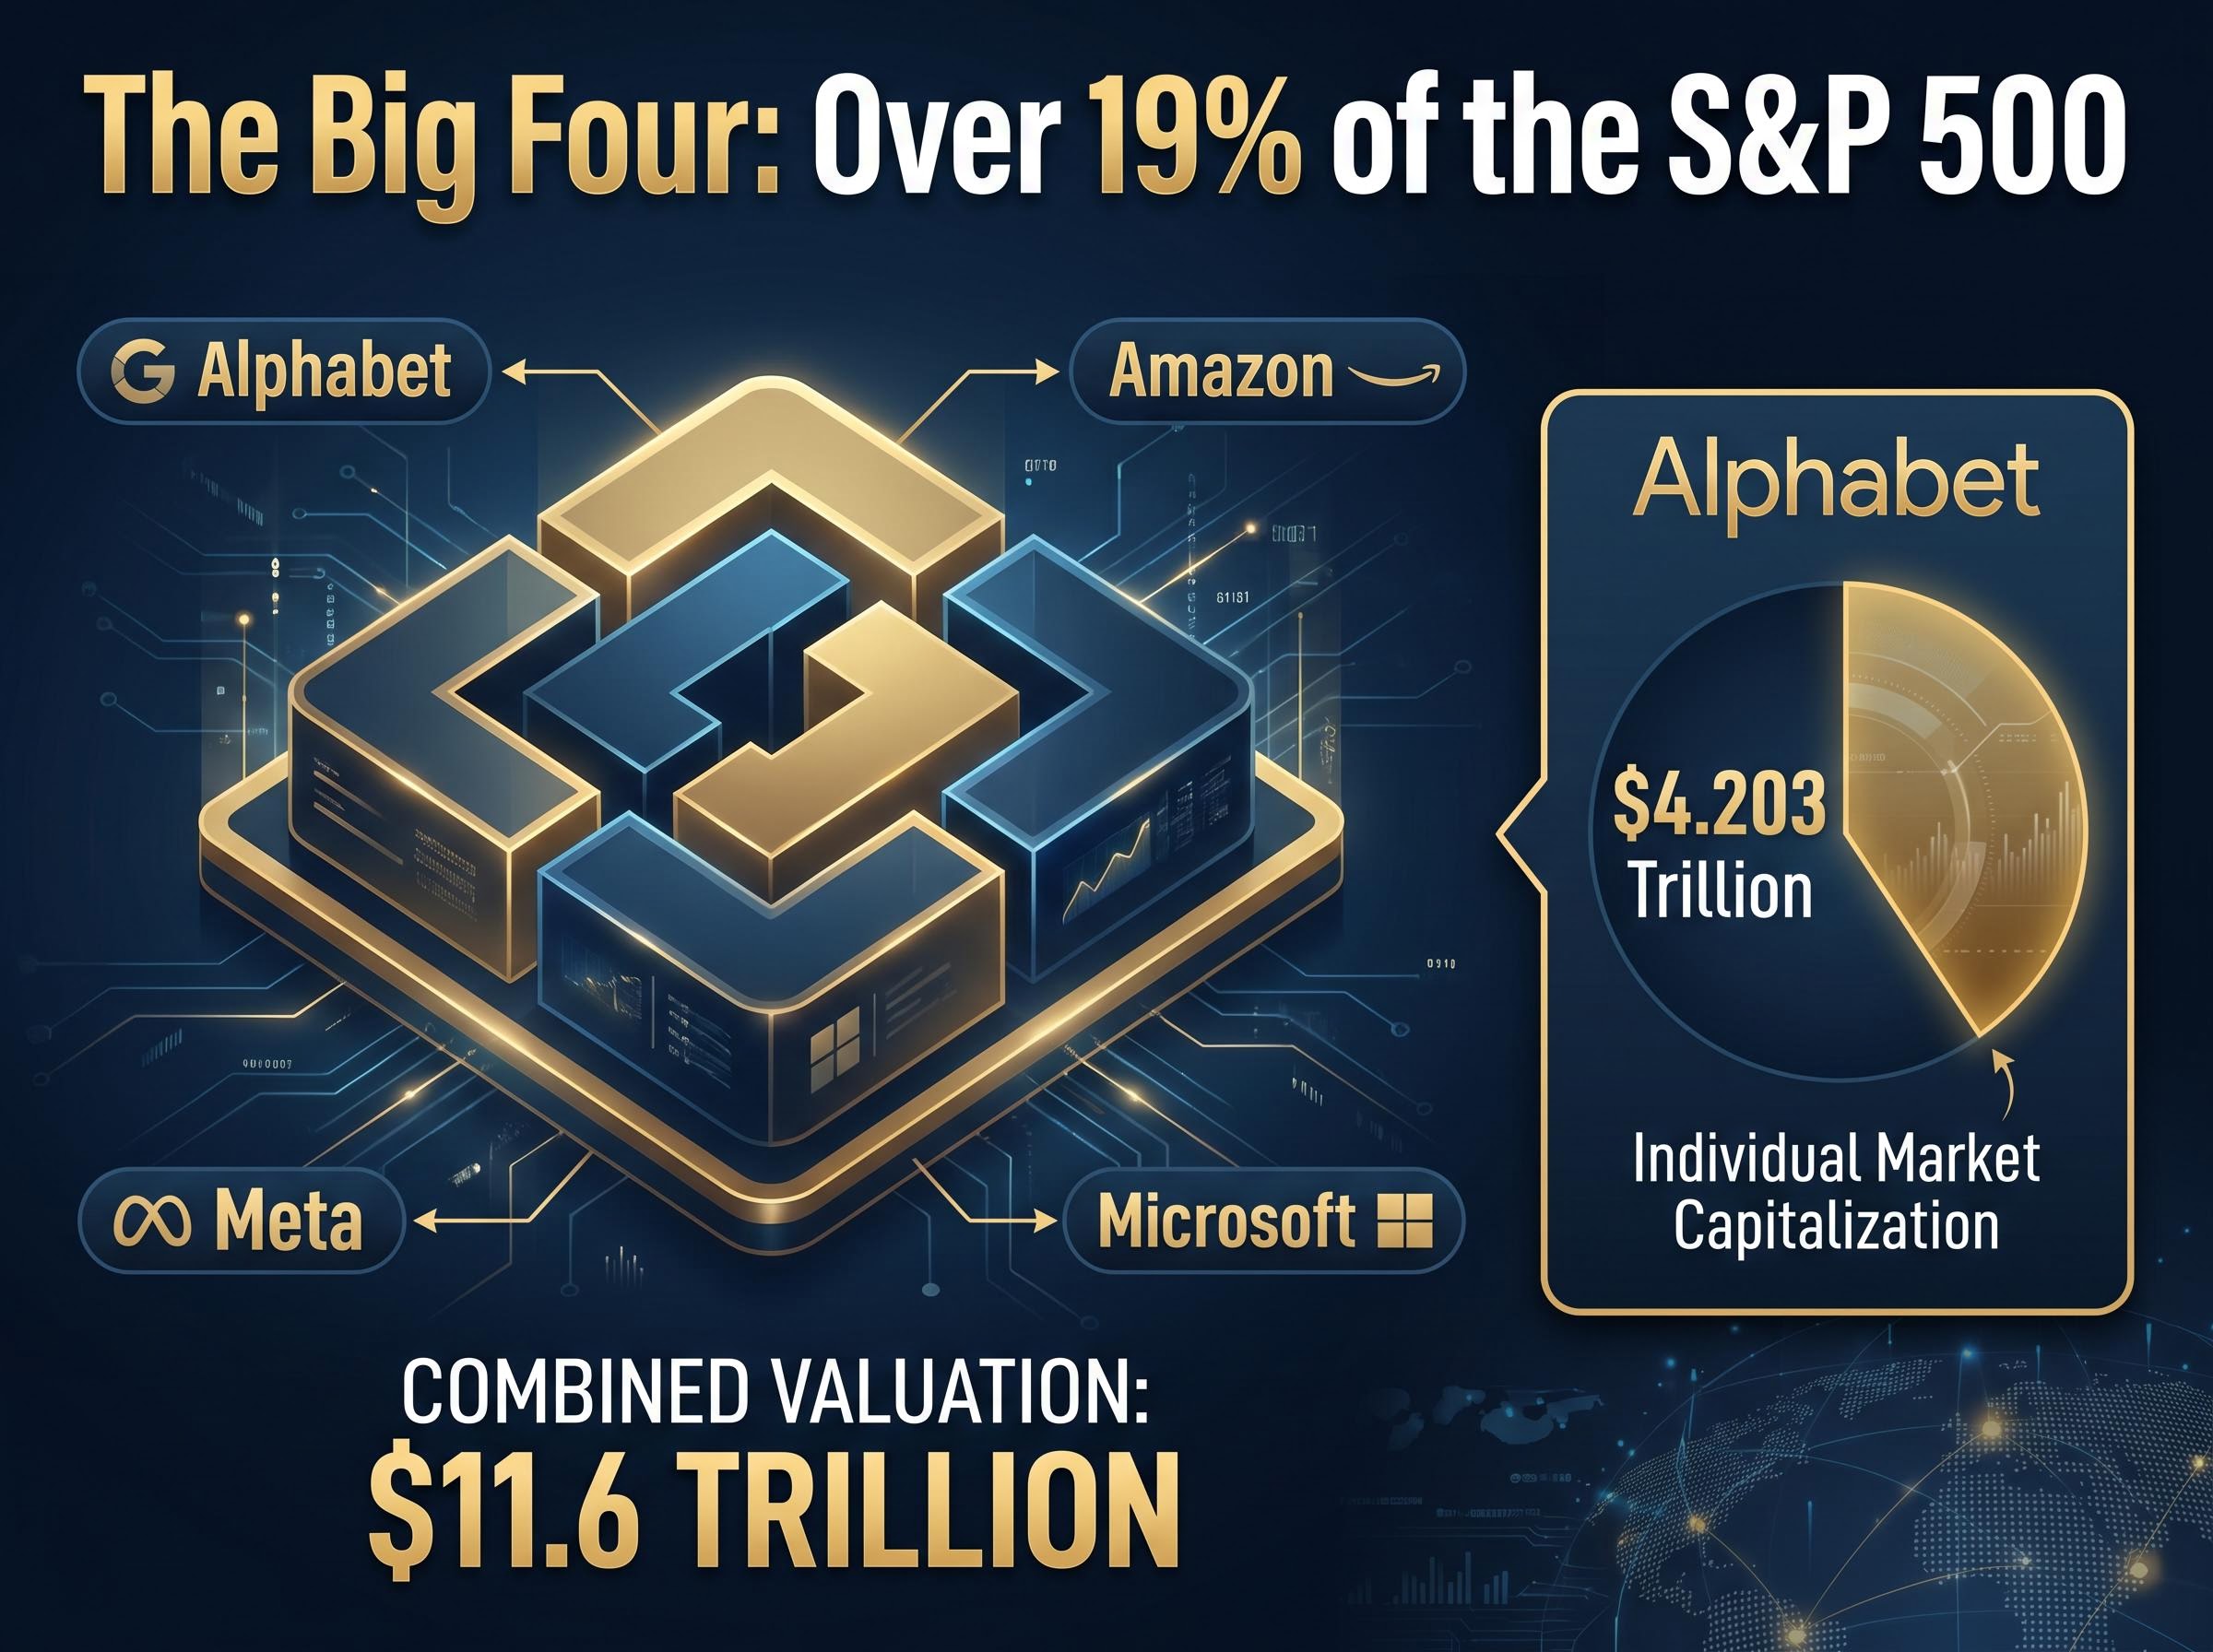
The specific index composition of Alphabet, Amazon, Meta, and Microsoft illustrates a historic concentration of market power. As of late April 2026, these four entities represent a combined valuation of approximately $11.6 trillion. Together, they hold over 19% of the total weight in the S&P 500.
This concentration functions as a structural double-edged sword for passive investors. When capital flows into these specific technology leaders, broad market index funds post outsized gains. Conversely, any isolated fundamental weakness within this small cohort amplifies market drawdowns, dragging down the entire index regardless of how the remaining 496 companies perform.
Market Concentration Context A 19% concentration in just four companies represents a historic deviation from traditional market breadth, fundamentally altering the risk profile of passive United States equity allocations.
The sheer scale of Alphabet provides necessary context for this dynamic. Individual estimates place the search giant’s market capitalisation alone at roughly $4.203 trillion.
Investors holding a broad US market index fund must recognise they are heavily concentrating their exposure into just four corporate balance sheets. The health of the entire equities environment relies on the continued performance of this narrow group.
Regulatory frameworks, including the FINRA guidance on concentration risk, emphasize that heavy exposure to a small cluster of correlated assets fundamentally alters portfolio vulnerability, leaving passive allocations susceptible to amplified drawdowns.
Options Markets Signal Violent Post Earnings Swings
Derivative markets are actively pricing in violent price corrections for major technology firms entering the Q1 2026 earnings season. Options traders expect above-average earnings volatility across the sector, adjusting their positions ahead of the announcements. This translates abstract index concentration into immediate, actionable market intelligence, showing readers exactly what level of turbulence Wall Street expects this week.
Current derivative projections highlight the specific single-day implied moves anticipated following imminent financial disclosures.
| Company | Ticker | Q1 2026 Implied Post-Earnings Move |
|---|---|---|
| Microsoft | MSFT | 6.8% |
| Alphabet | GOOGL | 5.81% |
| Amazon | AMZN | 3.28% |
These figures show Wall Street preparing for significant short-term fluctuations. According to market analysts, historical data adds further context to these projections, showing Meta Platforms averaging 8.4% post-earnings moves over the previous twelve quarters. Compared to historical averages, current derivative pricing reflects heightened anxiety regarding forward-looking revenue guidance.
Navigating the Post Announcement Volatility Crush
Implied volatility steadily increases as an earnings date approaches, inflating the premium cost of options contracts. Once the financial data is released to the public, the uncertainty vanishes, causing options premiums to deflate immediately. This specific pricing mechanic is known as an implied volatility crush.
Retail traders often lose capital by purchasing options right before an earnings announcement due to this mechanical phenomenon. Without understanding how the implied volatility crush operates, novice investors miscalculate the actual price movement required to generate a profit. Even if the underlying stock moves in the anticipated direction, the rapid deflation of the options premium can erase the position’s entire value.
The current high implied volatility surrounding the top four technology giants suggests a severe crush will follow their respective Q1 2026 disclosures, catching uninformed market participants off guard.
For readers wanting to contextualise these upcoming technology earnings within the broader macroeconomic environment, our detailed coverage of S&P 500 warning signals examines the specific geopolitical and commodity catalysts currently threatening the broader index.
The 600 Billion Dollar Infrastructure Gamble
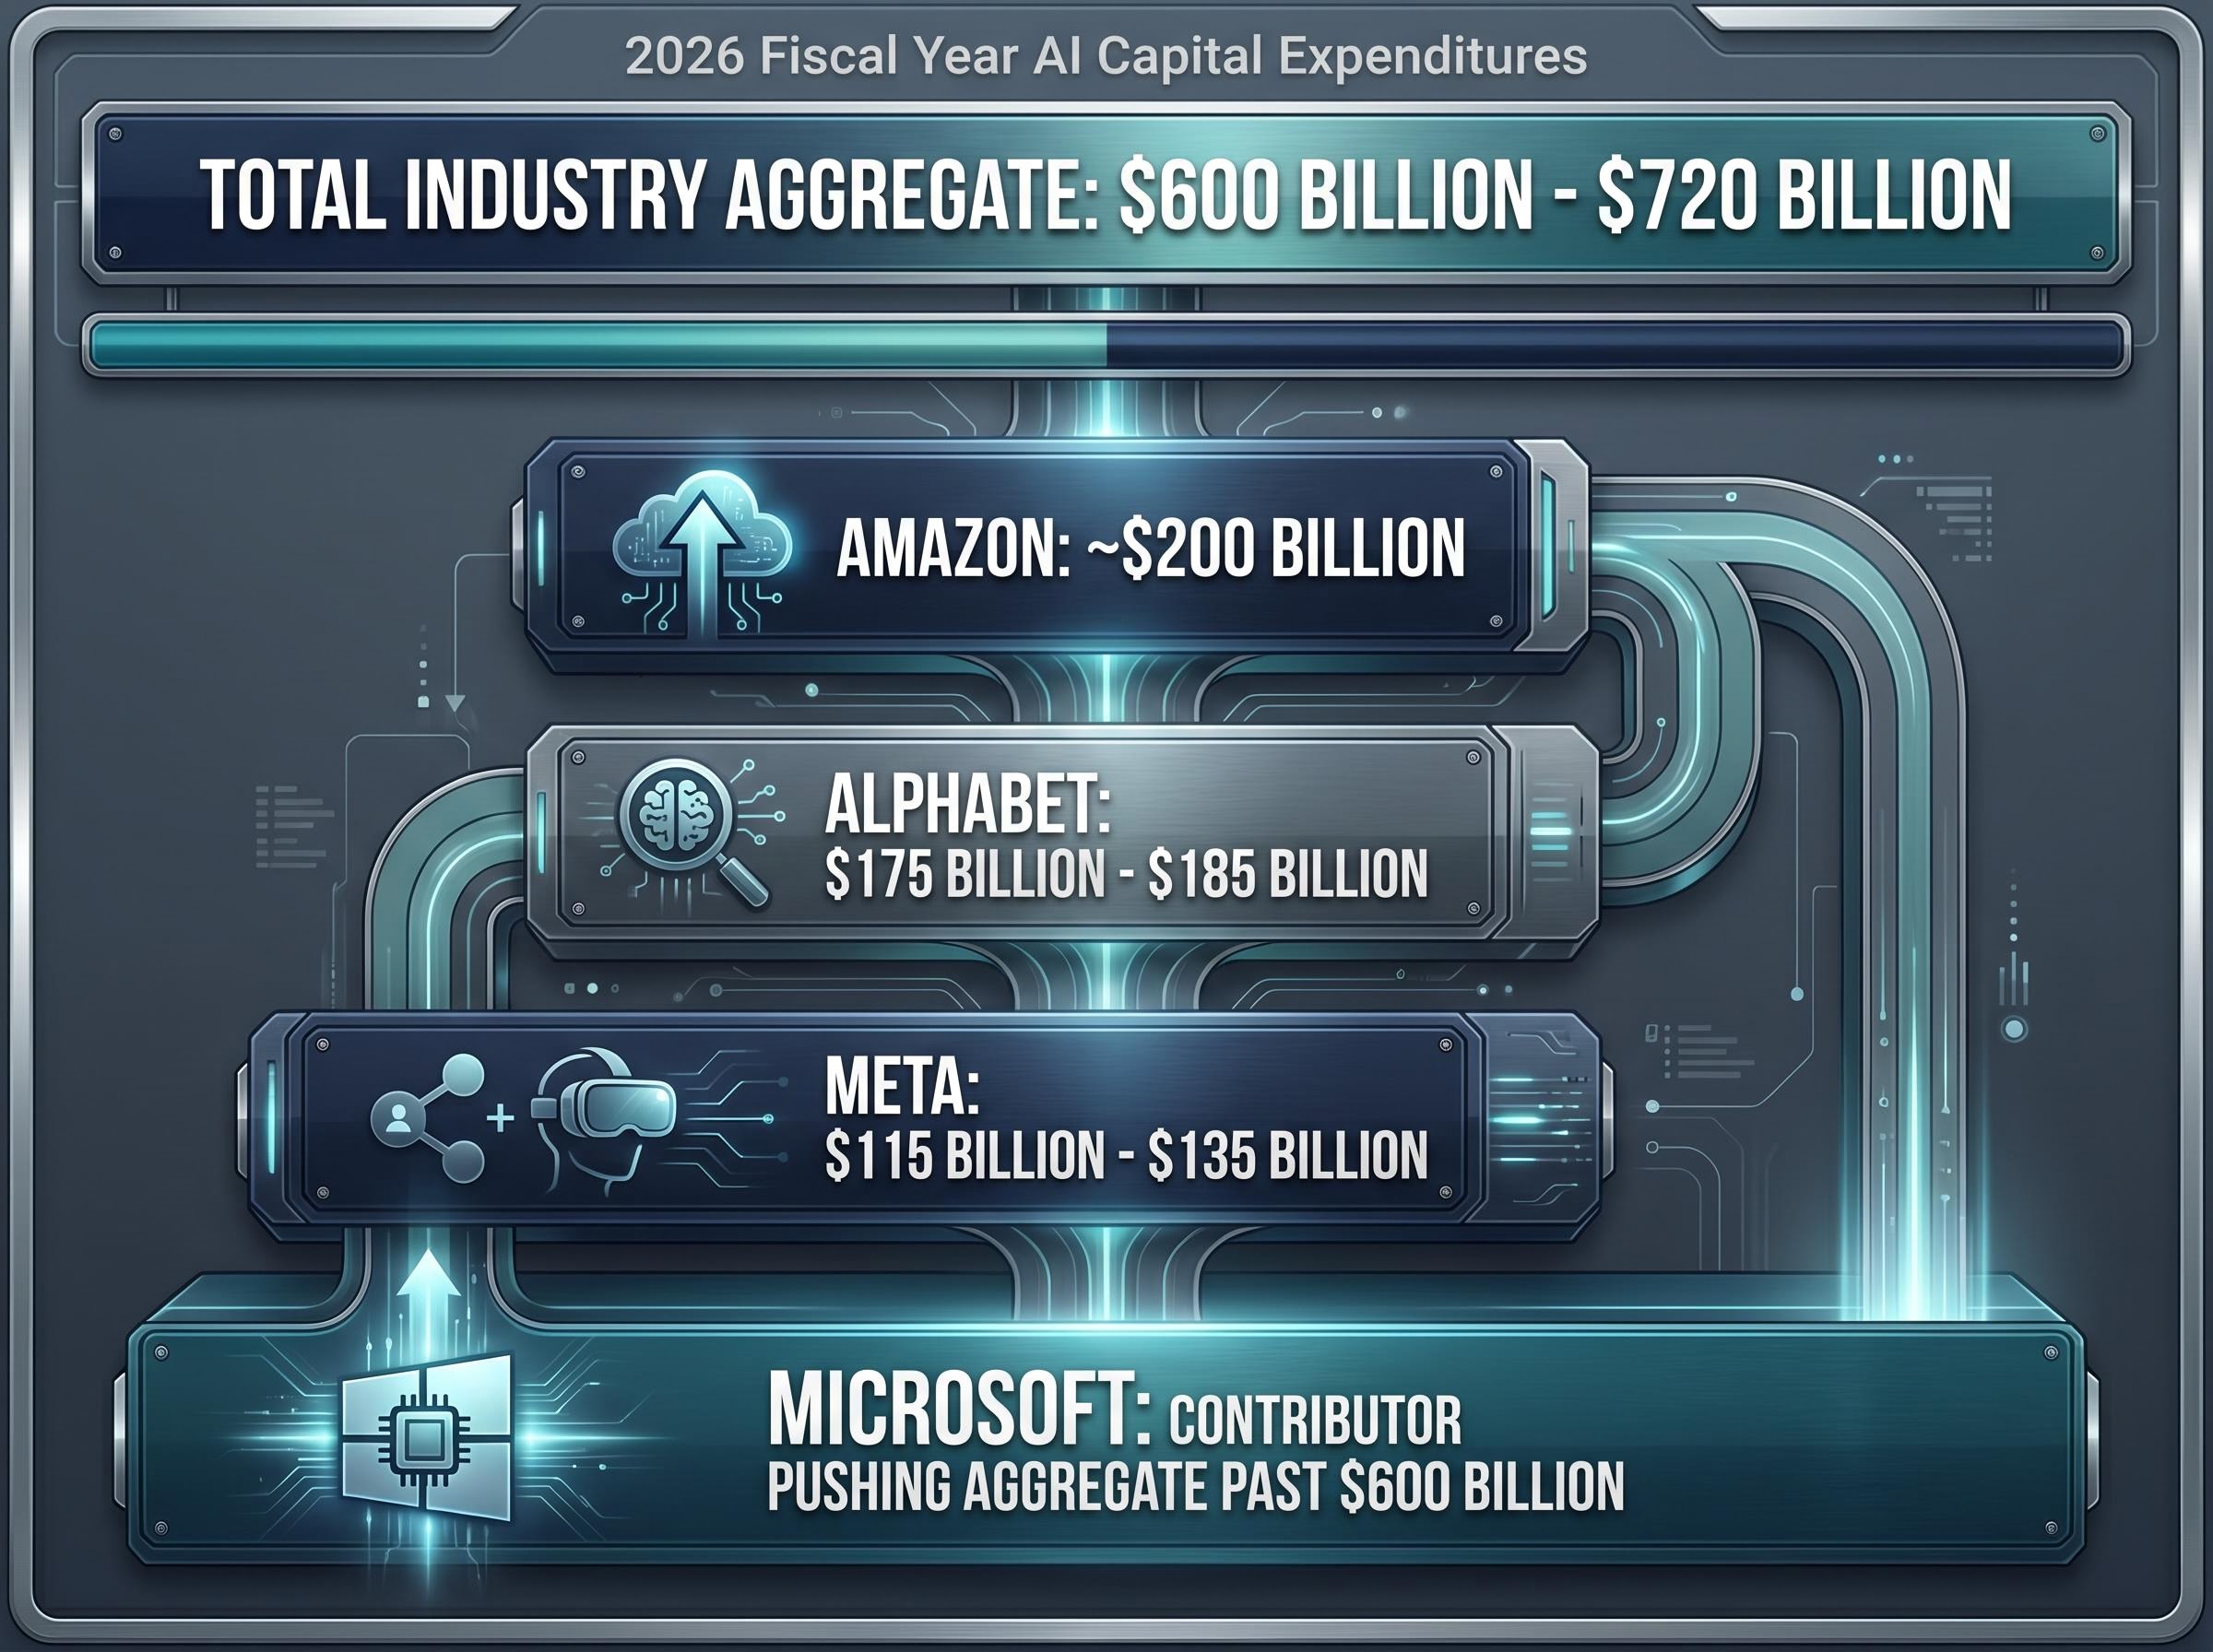
Beyond short-term trading volatility, the underlying fundamental driver for these corporations is the sheer velocity of capital flowing into hardware and facilities. Megacap technology companies are committing unprecedented capital to artificial intelligence infrastructure. Wall Street estimates project that aggregate technology industry artificial intelligence capital expenditures will reach between $600 billion and $720 billion for the 2026 fiscal year.
This aggressive capital deployment places mounting pressure on these entities. Financial analysts are actively demanding tangible revenue growth to justify these massive outlays. The market is becoming increasingly impatient, requiring immediate commercialisation of artificial intelligence tools.
Understanding where this capital is flowing helps investors identify the structural forces dictating corporate valuations over the next twelve to thirty-six months. Projected individual capital expenditure breakdowns show exactly how the largest players are allocating funds across the sector.
- Amazon: Projecting approximately $200 billion in capital expenditures for the fiscal year.
- Alphabet: Planning between $175 billion and $185 billion in dedicated infrastructure spending.
- Meta: Committing between $115 billion and $135 billion to facilities and hardware.
- Microsoft: Expected to act as a massive contributor to broader hyperscaler spending, helping push the aggregate technology industry totals past the $600 billion mark.
Tracking this corporate spending is essential for any investor evaluating the long-term viability of the current technology market cycle. The sheer volume of this capital expenditure will serve as the primary catalyst for earnings growth or contraction.
Hardware Obsolescence and Systemic Retirement Risks
The aggressive infrastructure spending creates secondary risks for the broader hardware ecosystem. Industry experts warn that billions of dollars are currently directed toward artificial intelligence infrastructure that risks becoming obsolete within a compressed three-year window.
Industry Analysis The rapid three-year depreciation cycle for current generation artificial intelligence hardware represents a sustainability hidden menace for the broader technology sector and interconnected supply chains.
This depreciation risk complicates the tracking of the hardware sector’s actual performance. Current public data regarding the Philadelphia Semiconductor Index (SOX) is highly fragmented. Year-to-date performance figures feature wide, conflicting variances across financial platforms, with reported levels ranging wildly from 7,194.71 to 13,461.30.
These discrepancies likely occur because platforms mix standard price index variants with total return variants. Without verifiable consensus on these index levels, investors must exercise caution when tracking semiconductor momentum and broader hardware sector trends.
Assessing 401k Vulnerabilities
This rapid capital deployment establishes a fragile link between corporate hardware spending and the stability of standard US 401k portfolios. Sudden pullbacks in technology capital expenditures ripple immediately through interconnected hardware enterprises. Passive funds absorb these shocks precisely because of their top-heavy index allocations.
These capital expenditure budgets are heavily influenced by logistical and operating pressures; evaluating historical high gas prices reveals that persistent inflationary environments frequently force immediate corporate spending reductions across the supply chain.
A reduction in capital expenditures by just one of the top four technology giants can simultaneously depress the primary stock and trigger sell-offs across the semiconductor supply chain. Retirement analysts note that passive accounts are increasingly vulnerable to sudden shifts in how the market views this megacap infrastructure spending cycle.
Navigating a Top Heavy Equities Market
The current United States equities environment is defined by the dual reality of incredible corporate capital power and the structural fragility it creates. A market where four companies dictate the trajectory of broad benchmarks requires careful analytical consideration.
While derivative markets project short-term turbulence around the April 2026 reporting cycle, the true systemic test lies in the return on investment for the massive infrastructure build-out. Wall Street will closely monitor whether the revenue generated over the next thirty-six months justifies the historic capital deployment. US investors must acknowledge that passive index investing now functions as a highly concentrated thematic bet.
When a handful of megacap stocks dictate overall benchmark performance, tracking institutional stock market warning thresholds becomes an essential strategy for anticipating sudden institutional capital flights.
Understanding the mechanics of market weighting, the signals from options pricing, and the vulnerabilities in hardware supply chains is essential for navigating this top-heavy market structure.
Past performance does not guarantee future results. Financial projections are subject to market conditions and various risk factors. This article is for informational purposes only and should not be considered financial advice. Investors should conduct their own research and consult with financial professionals before making investment decisions.