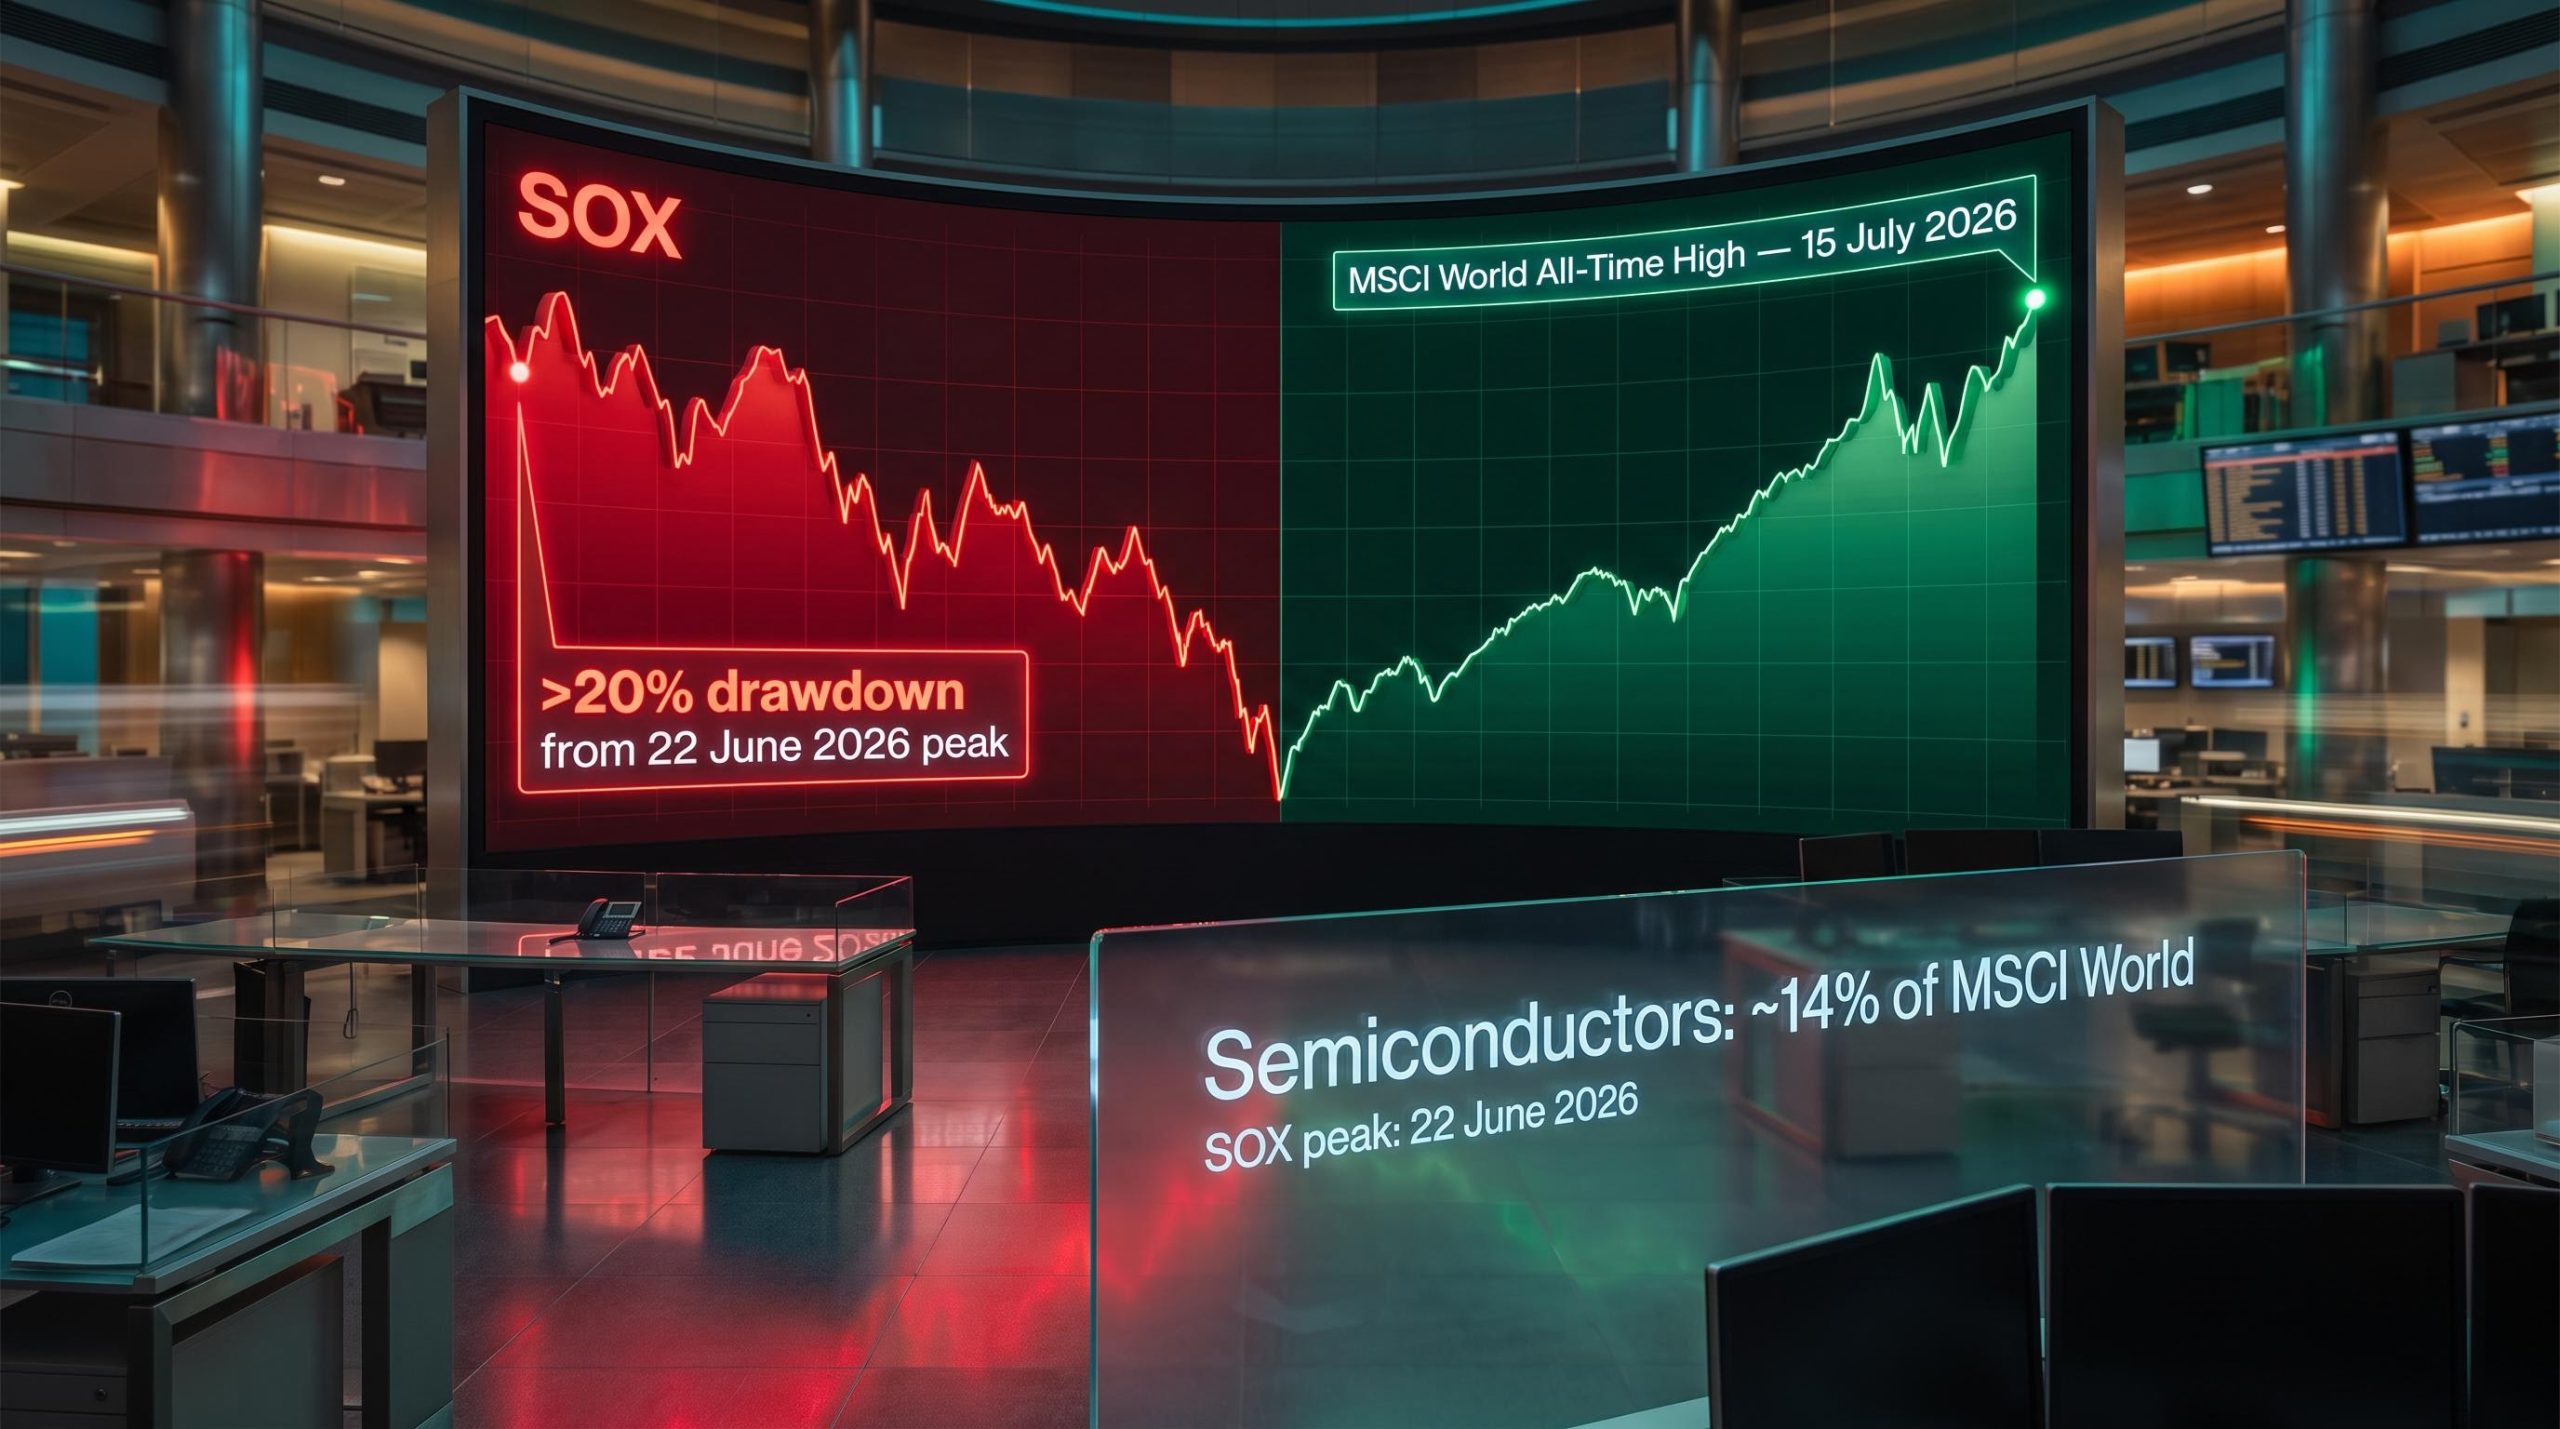
U.S. semiconductor stocks suffered their worst single session in more than six years on Thursday, 5 June 2026, with the PHLX Semiconductor Index (SOX) closing down approximately 10.3% and erasing more than $1 trillion in combined market capitalisation across the sector. The selloff followed Broadcom’s fiscal Q2 earnings release earlier in the week, where record revenue failed to satisfy investors who had priced in a more aggressive artificial intelligence chip growth outlook. What began as a single-stock reaction on Wednesday metastasised into a sector-wide rout by Thursday’s close, pulling Nvidia, AMD, Micron Technology, Marvell Technology, and Intel into double-digit percentage losses and dragging the Nasdaq Composite down approximately 4.2%. What follows is a breakdown of the catalyst, the scale of the damage, how each major chipmaker was affected, and what the episode signals about the fragility of AI-driven valuations heading into the second half of 2026.
How Broadcom’s earnings lit the fuse for a sector-wide selloff
Broadcom reported fiscal Q2 2026 revenue of approximately $22.19 billion, up roughly 48% year-over-year, according to company results released during the week of 2 June. AI semiconductor revenue reached approximately $10.8 billion, representing 143% year-over-year growth.
Broadcom’s AI chip revenue surged 143% year-over-year to approximately $10.8 billion. It still was not enough. The market wanted a bigger number on the forward outlook, and Broadcom did not deliver one.
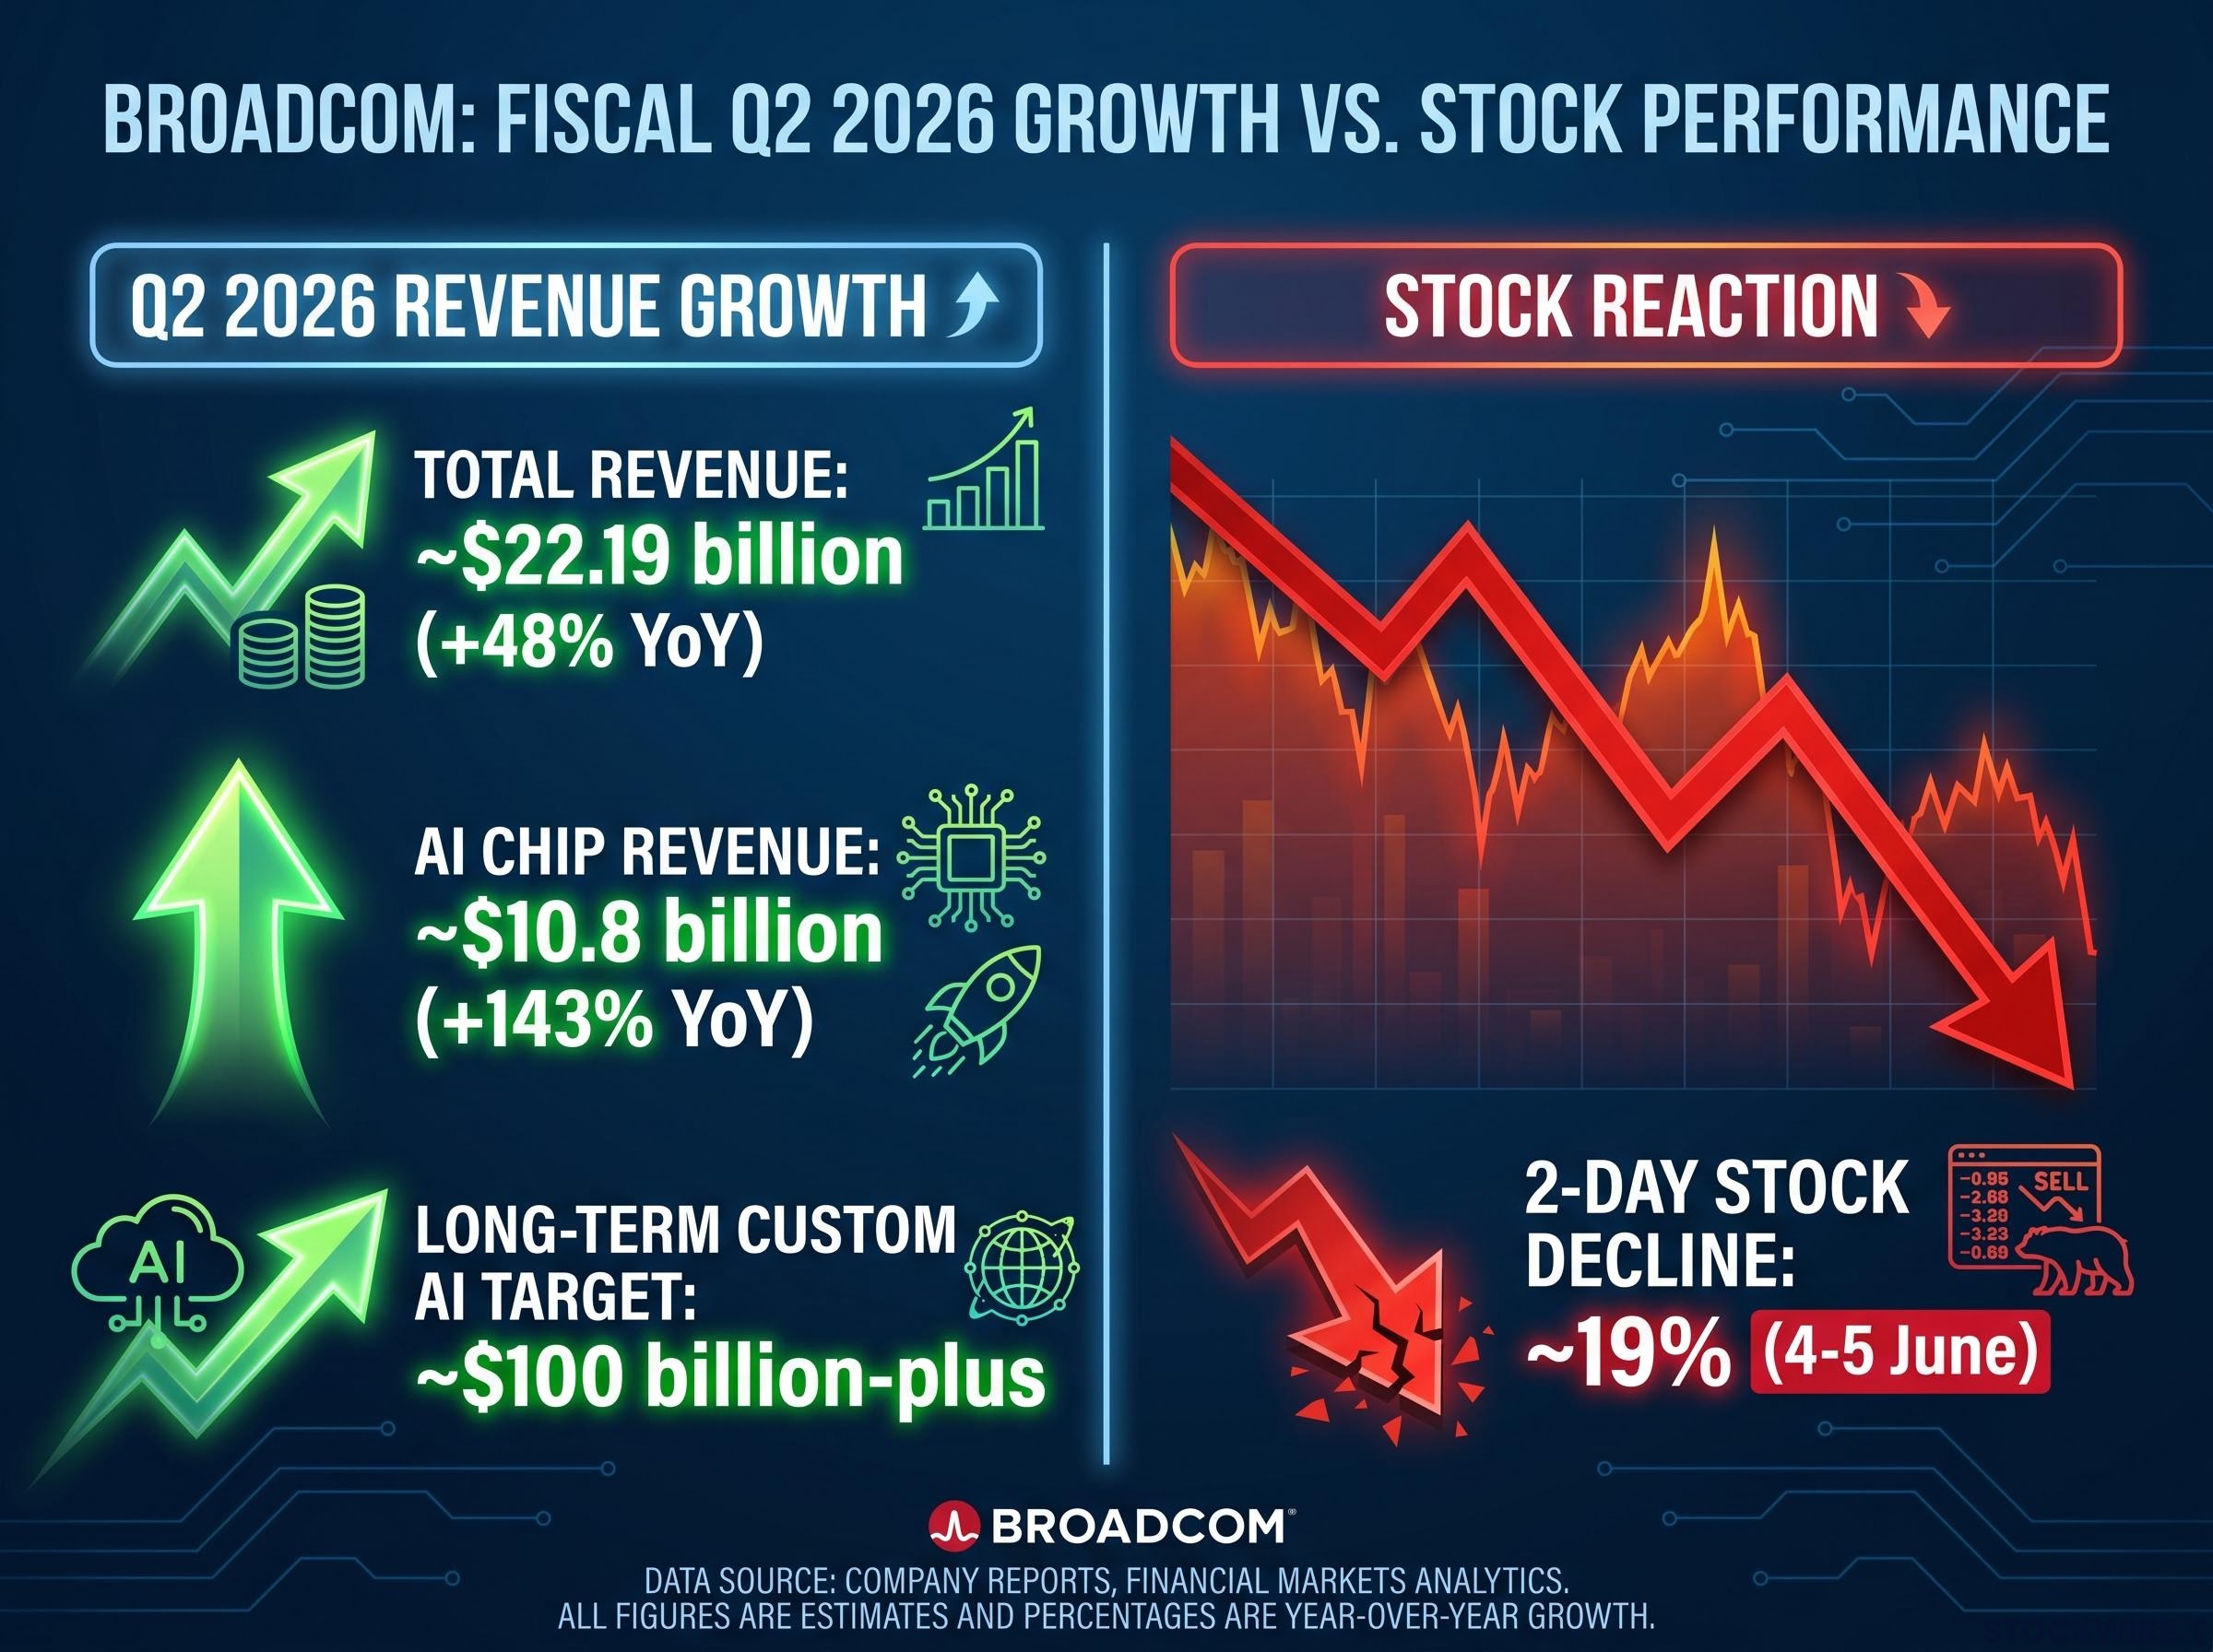
The specific disappointment centred on the company’s unchanged long-term annual custom AI chip revenue target, reported at approximately $100 billion-plus. That figure had been acceptable when Broadcom first guided to it. By the time Q2 results landed, investors had already priced in something more aggressive. The gap between what was reported and what was expected widened further when forward guidance for the current quarter fell short of elevated consensus estimates.
Broadcom’s shares dropped approximately 12-13% on Wednesday, 4 June, then extended losses on Thursday, closing at $385.73, down 7.92% on the session. The cumulative two-day decline reached approximately 19%. By Thursday afternoon, the damage had spread well beyond a single name.
Broadcom’s position in the selloff is distinct from Nvidia’s partly because its revenue is tied to custom ASIC programmes under multi-year contracts with Google and Meta rather than to open-market GPU sales, a structural difference that informed analysts like Bernstein’s Stacy Rasgon, who raised his price target to $550 even as shares were falling.
When big ASX news breaks, our subscribers know first
SOX in freefall: how the PHLX Semiconductor Index recorded its worst session in years
The SOX fell approximately 8.5% during afternoon trading on Thursday, according to Reuters. By the close, losses had deepened to approximately 10.3%, marking the index’s steepest one-day decline since March 2020.
Over two consecutive sessions (4-5 June), the combined SOX decline reached approximately 12%. The broader market absorbed significant collateral damage:
- SOX intraday (Thursday afternoon): down approximately 8.5%
- SOX at close: down approximately 10.3%
- SOX two-session decline (Wednesday-Thursday): approximately 12%
- S&P 500 (Thursday): down approximately 2.3%
- Nasdaq Composite (Thursday): down approximately 4.2%
The severity of the closing figure surpassed the April 2025 tariff-related selloff that had previously served as the modern benchmark for single-session SOX declines.
Yet the correction arrived within the context of an extraordinary rally. Entering the period, the SOX had gained approximately 73-92% on a year-to-date basis, depending on the source. Thursday’s losses, while historically steep, represented a sharp pullback within a larger bull run rather than necessarily signalling a secular reversal.
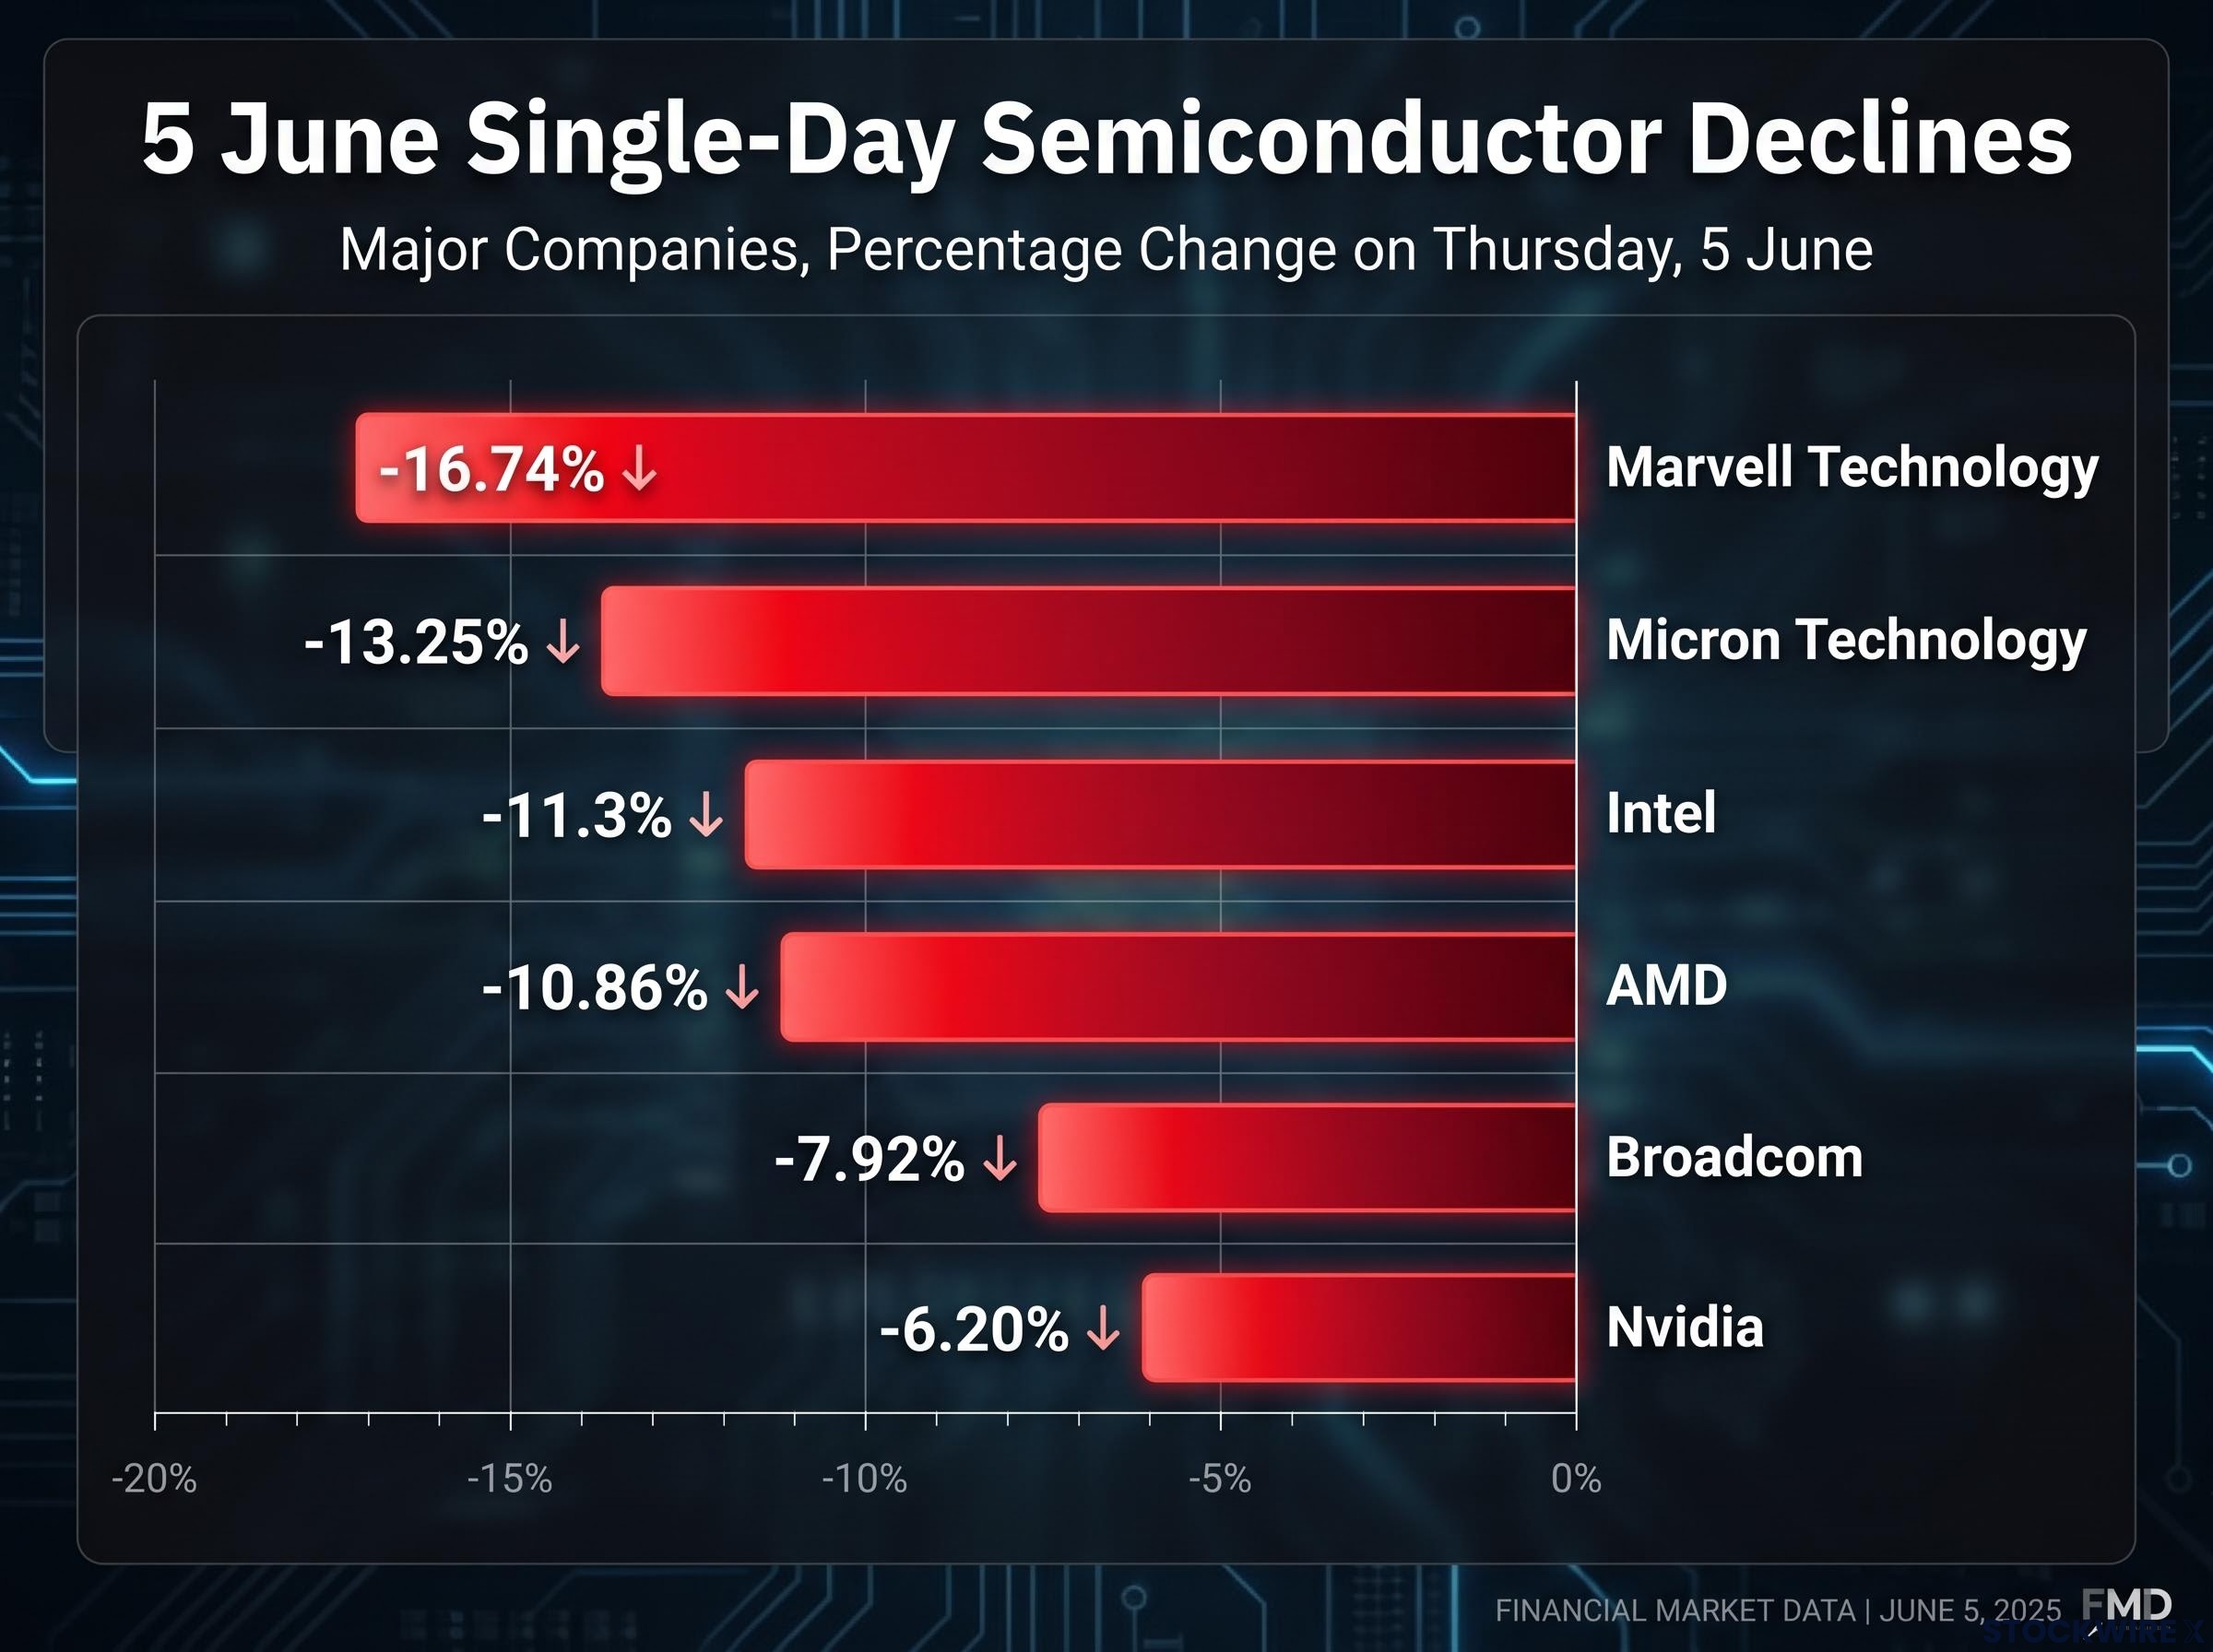
Stock by stock: which chipmakers took the hardest hits
| Company | 5 June Close Price | Single-Day Change (%) | Market Cap Impact | Note |
|---|---|---|---|---|
| Marvell Technology | $263.47 | -16.74% | — | Thursday only |
| Micron Technology | $864.01 | -13.25% | ~$127 billion erased | Thursday only |
| Intel | — | -11.3% | — | Thursday only |
| AMD | $466.38 | -10.86% | — | Thursday only |
| Broadcom | $385.73 | -7.92% | — | ~19% over two days |
| Nvidia | $205.10 | -6.20% | >$300 billion erased | Thursday only |
Two names stand out for different reasons. Marvell Technology posted the steepest single-session decline at -16.74%, a particularly sharp reversal for a stock that had been considered a favoured holding among investors during the prior rally. The fall reflected how quickly sentiment can turn on high-momentum names when sector confidence cracks.
Chip sector valuation extremes are not uniform across the index: Micron trades at under 9x forward earnings while Intel sat at approximately 101x forward earnings entering the correction, meaning a blanket bubble verdict misses the name-by-name dispersion that was already embedded in SOX constituents before Thursday’s selloff.
Nvidia’s 6.20% decline was the smallest in percentage terms among the six, but the largest in absolute scale. More than $300 billion in market capitalisation was erased from a single company in a single session, a figure that underscores Nvidia’s sheer weight in the semiconductor sector.
What the PHLX Semiconductor Index is, and why its single-day moves matter
What the SOX tracks
The PHLX Semiconductor Index, commonly referred to as the SOX, is a market-capitalisation-weighted index that tracks companies involved in the design, manufacture, and distribution of semiconductors listed in the United States. It covers the full semiconductor value chain, making it the standard benchmark cited by financial media and analysts when assessing sector-level chip performance.
Nasdaq’s SOX index methodology defines constituent eligibility as companies involved in the design, manufacture, and distribution of semiconductors listed in the United States, using a modified market-capitalisation weighting approach that concentrates index exposure in the sector’s largest names, which is precisely why a single-session decline in Nvidia and Broadcom can drive double-digit index-level losses.
A 10% decline in the SOX translates directly into portfolio pain for any investor with broad technology or AI-themed ETF exposure, because many of the index’s largest constituents also dominate the top holdings of those funds.
Where 5 June ranks historically
The 10.3% closing decline on Thursday marked the steepest single-day SOX drop since March 2020, during the early stages of the pandemic selloff. It also surpassed the April 2025 “Liberation Day” tariff-related decline, which had previously served as the most recent benchmark for severe single-session losses in the chip index.
The 8.5% intraday figure reported by Reuters during afternoon trading was already tracking toward the worst session since April 2025 before the close extended losses further. Despite the two-day wipeout, the SOX remained approximately 75% higher on a year-to-date basis, a reminder of how far the rally had carried the sector before the correction arrived.
“Buy the dip” or structural crack? What market participants said
The two dominant interpretations of Thursday’s session sat in direct tension with each other.
Some traders used the weakness to add exposure through options on Broadcom and Micron, treating the selloff as a corrective pullback within a larger AI bull thesis. The year-to-date gains supported that read: a 12% two-session decline within a 73-92% rally could be framed as healthy profit-taking rather than a fundamental break.
Dennis Dick, a proprietary trader at Triple D Trading, told Reuters that the previously reliable dip-buying strategy showed signs of breaking down during this specific session.
That observation carried weight precisely because dip-buying had worked so consistently throughout the prior rally. If the pattern was failing on a session where fundamentals (Broadcom’s headline numbers) were strong, it raised a harder question about whether valuations had outpaced even aggressive earnings growth.
The AI capex-to-revenue lag that Morningstar analyst Dennis Li identified as an 18-24 month risk in May 2026 had been a known structural concern before Thursday, meaning the Broadcom guidance disappointment may have served as a concrete data point that gave investors already uneasy about unproven returns a reason to reduce exposure.
- Opportunity signals: Options activity on Broadcom and Micron suggested some participants viewed the selloff as a buying opportunity; the sector’s year-to-date gains remained strongly positive
- Caution signals: Dip-buying showed signs of breaking down; the SOX’s prior rally had pushed AI chip multiples into territory where even record earnings could not justify further expansion; no formal brokerage rating upgrades or price-target increases emerged in the immediate aftermath
No widespread analyst downgrades were reported in the 4-5 June period, but neither did any major brokerage move to defend current valuations with upgraded targets.
The chip sector selloff in context: what comes next for chip investors
The SOX remains approximately 75% higher on a year-to-date basis despite the two-session decline of roughly 12%. Broadcom lost approximately 19% over two days. Nvidia shed more than $300 billion in market capitalisation in a single session. The scale was historic; the question is whether it was a reset or a warning.
Two forward-looking signals will tell investors which interpretation was correct. The first is the next round of major chip earnings, where updated AI revenue guidance from companies including Nvidia and Broadcom will either confirm that demand growth is decelerating or reaffirm the infrastructure spending thesis. The second is any updated AI capital expenditure guidance from hyperscale cloud providers, whose spending plans ultimately underpin the revenue forecasts that semiconductor valuations are built on.
Hyperscaler capital expenditure commitments totalling approximately $725 billion in 2026 are the foundation on which semiconductor revenue forecasts and, by extension, chip stock valuations are built, which is why any signal that those commitments are softening or that AI monetisation is lagging the spending pace represents a structural concern for the sector well beyond a single earnings miss.
Investors who track those two data points, rather than reacting to a single-day headline loss, will be better positioned for what comes next.
This article is for informational purposes only and should not be considered financial advice. Investors should conduct their own research and consult with financial professionals before making investment decisions. Past performance does not guarantee future results.
—
—