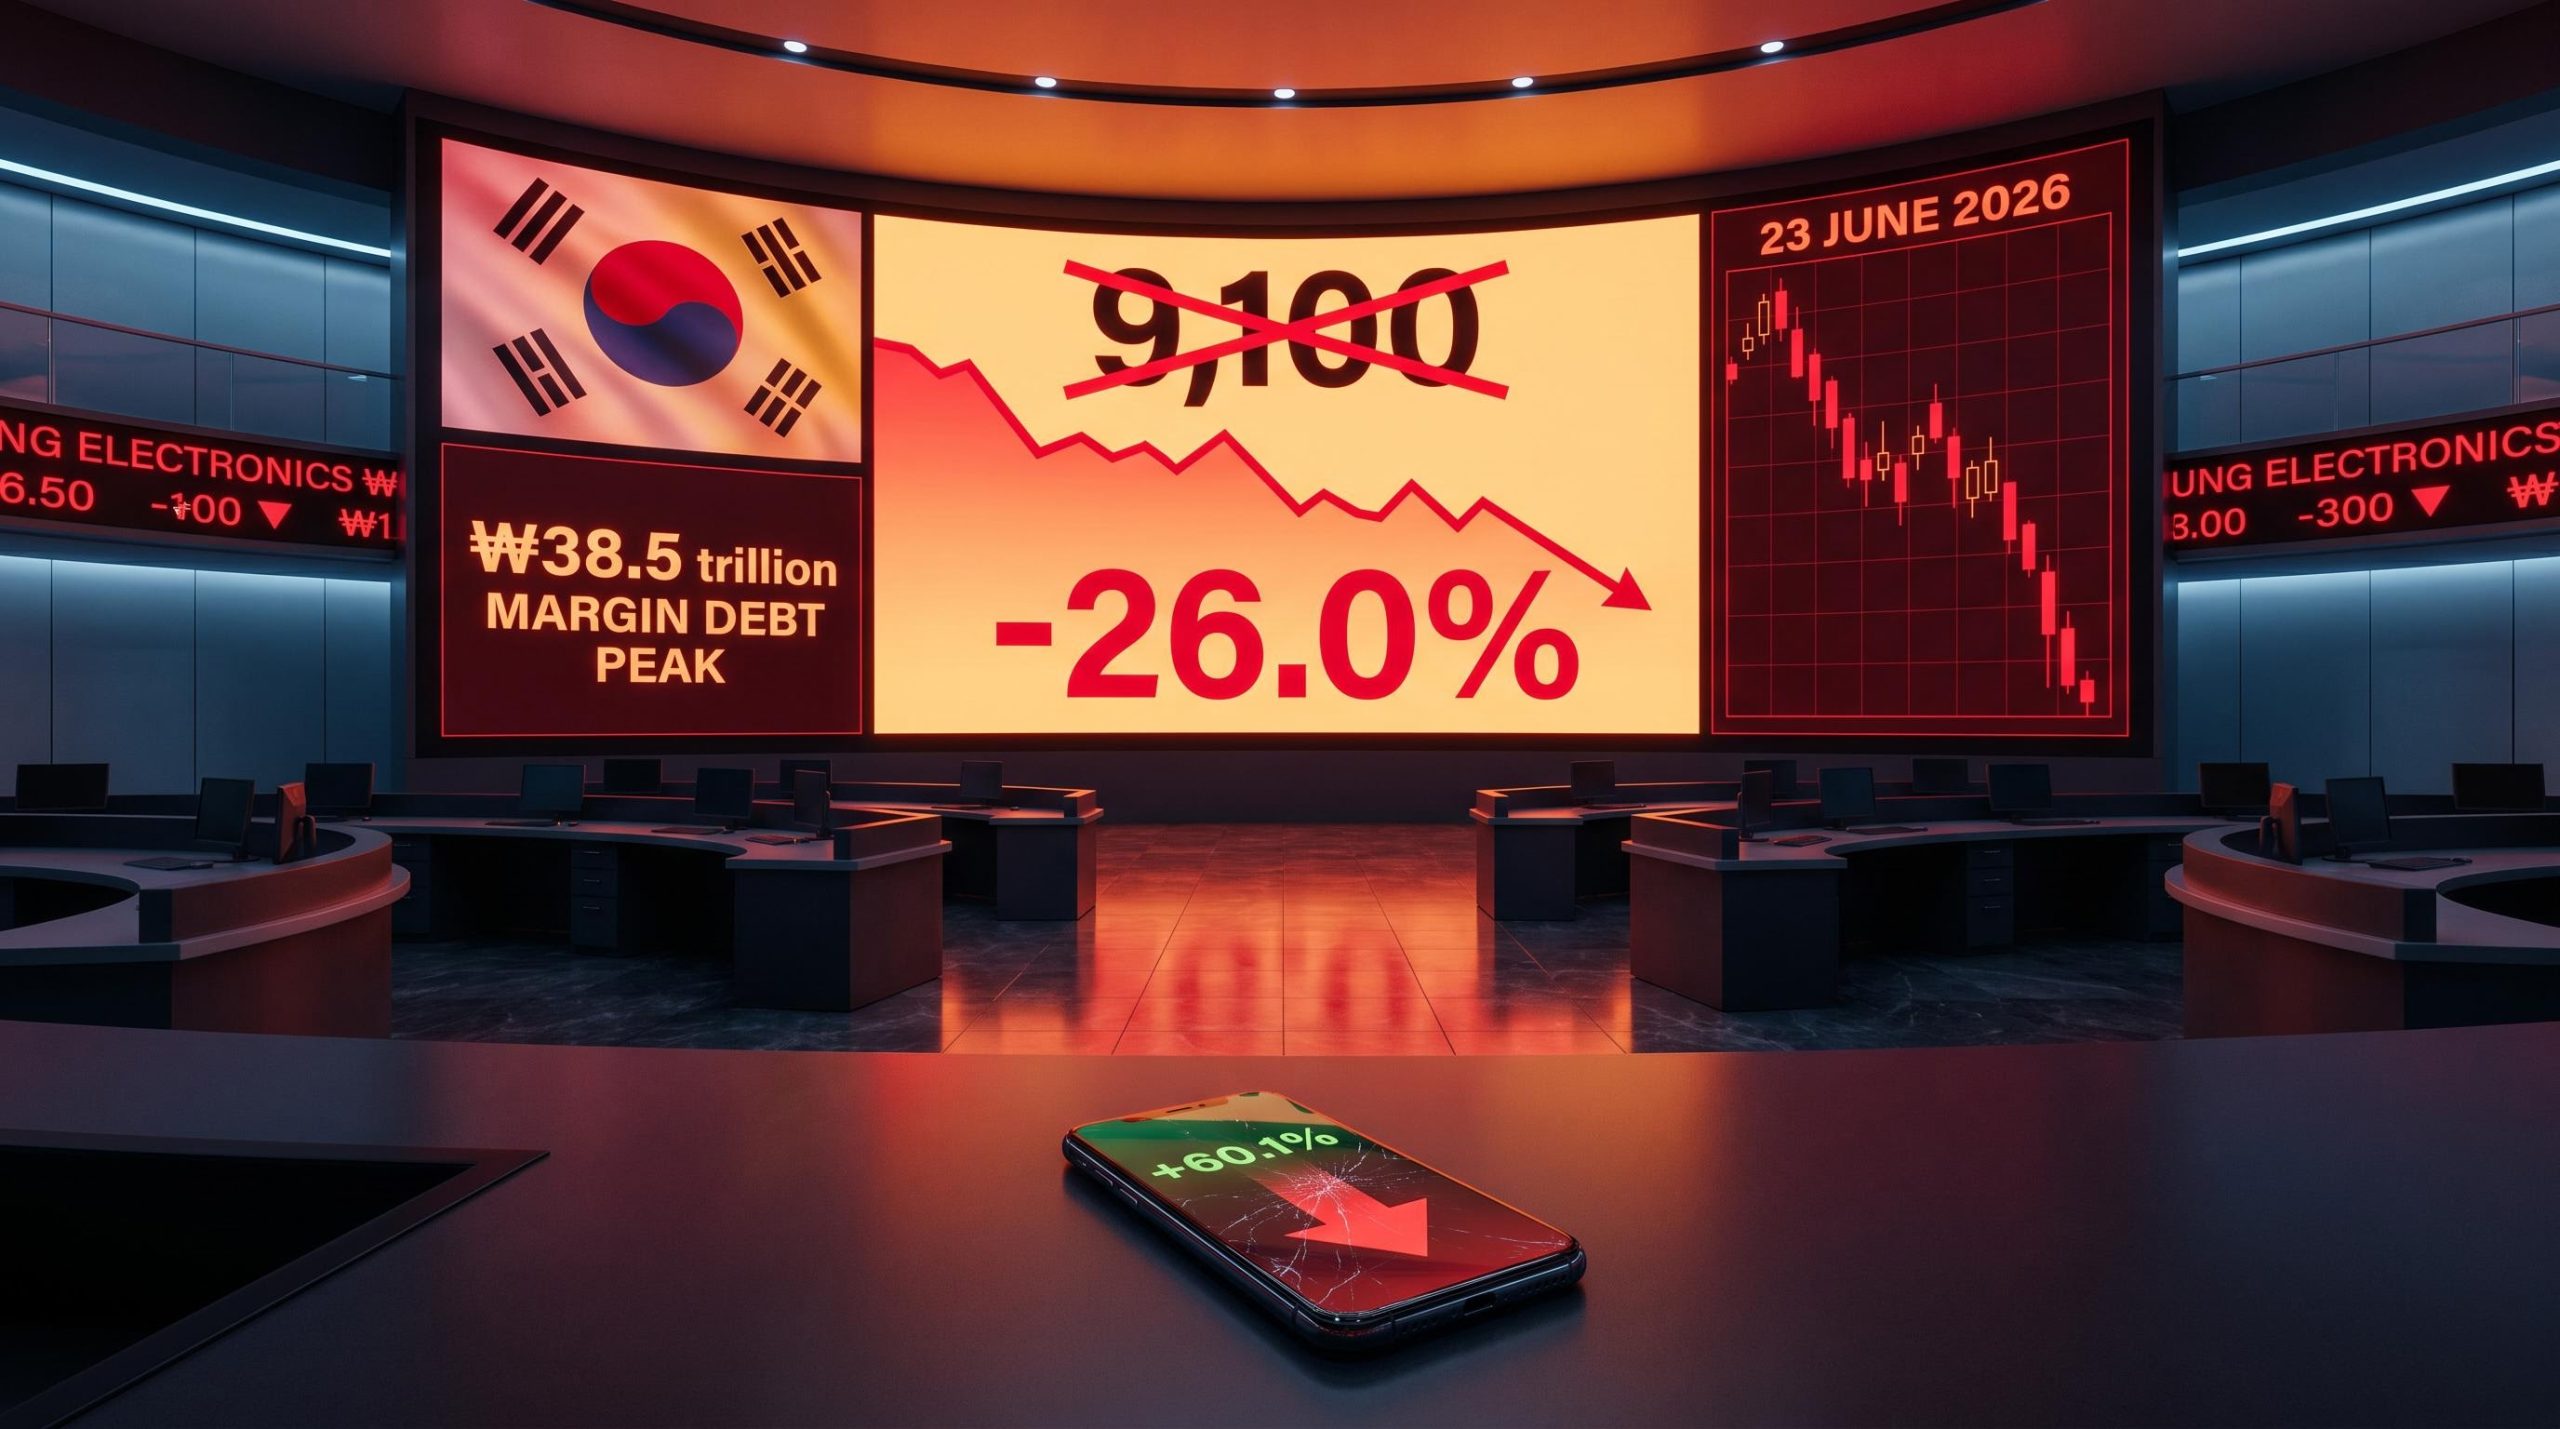
According to Korean brokers, the number of trading accounts registered in children’s names rose by a factor of ten in the opening quarter of 2026 compared with the same period a year earlier. Parents were opening trading accounts for their children while the country’s benchmark index, the KOSPI, raced toward a 60% gain. By the time teenagers were buying Samsung Electronics shares with pocket money, the rally had stopped being a market story. It had become a social phenomenon.
What happened next was not a story about semiconductors or artificial intelligence policy. It was a near-perfect modern specimen of a speculative bubble: a legitimate fundamental narrative, record leverage, demographic saturation across an entire society, and a mechanical crash that erased 26% in under a month. The AI and chip earnings that powered the rally remained broadly intact throughout the collapse. The severity of the fall was structural, not fundamental.
Here is a map of exactly how it happened, what the warning signs looked like in real time, and what the episode tells you about recognising structural fragility the next time it appears in a market you hold.
A 60% rally and a 26% crash: what the KOSPI episode actually was
Before the mechanics, the framework, or the lessons, the raw numbers deserve a moment on their own:
- KOSPI total return: +60.1% from 31 December 2025 through the 22 June 2026 peak (FactSet)
- KOSPI peak level: approximately 9,100 on 22 June 2026
- KOSPI drawdown: –26.0% from peak to 21 July 2026 (FactSet)
- Single-day crash: approximately 8-9% on 23 June 2026, triggering circuit breakers
- Index concentration: Samsung Electronics and SK hynix together accounted for more than 50% of KOSPI market capitalisation at the peak
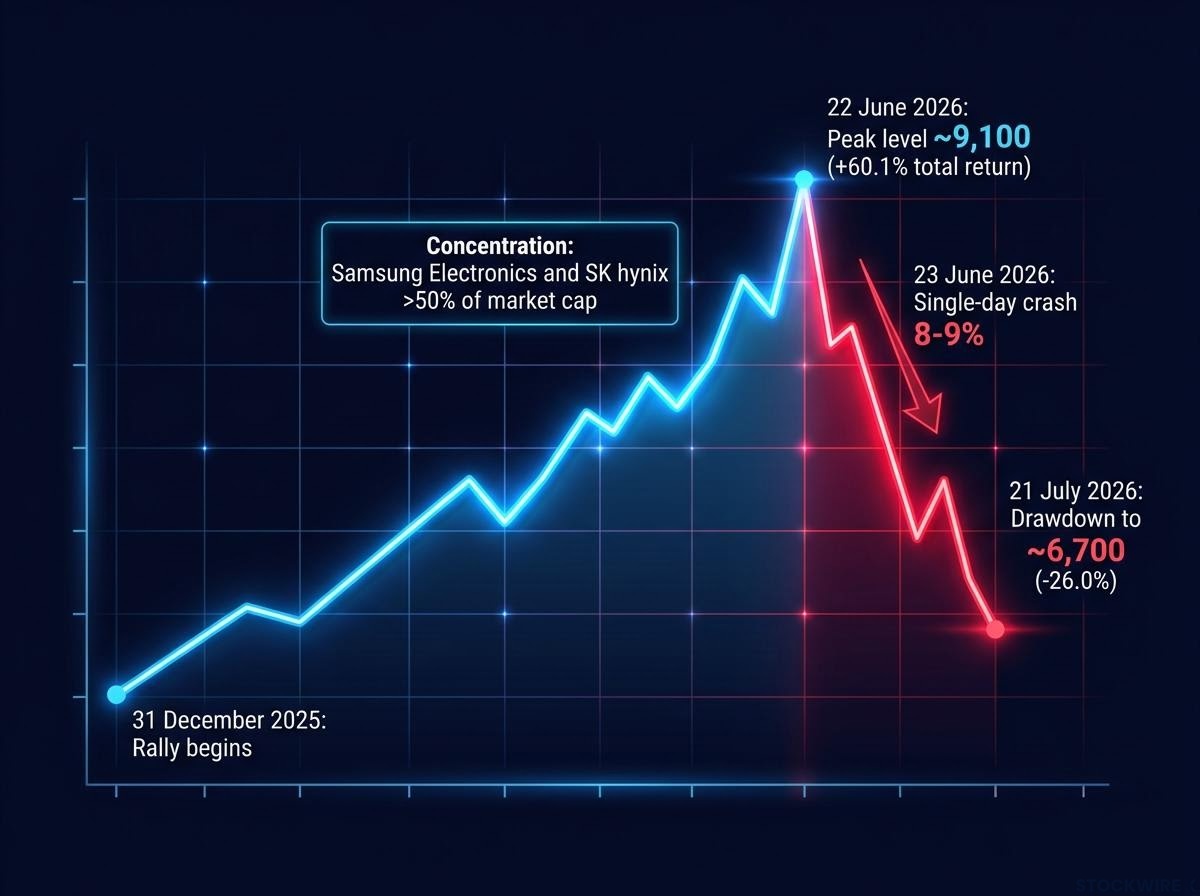
The rally was real. South Korea’s semiconductor giants sit at the centre of the global AI supply chain, and the earnings revisions that drove the first leg of the move reflected genuine demand. But the crash, when it arrived on 23 June, did not come because those fundamentals deteriorated. Circuit breakers fired in subsequent sessions not because chip demand collapsed, but because the market’s internal structure buckled.
The AI and semiconductor fundamentals that drove the rally did not deteriorate materially during the crash. The severity of the fall was a structural story, not a fundamental one.
That distinction matters for every market you hold today. Price severity in a correction is determined by structural fragility, by the leverage, concentration, and product design embedded underneath the price, not by whether the underlying business story remains compelling. A strong narrative can coexist with dangerous architecture. The KOSPI proved it.
When big ASX news breaks, our subscribers know first
How speculative bubbles actually form: the four-stage framework
The four stages you just watched unfold in those numbers have a name. Economists Hyman Minsky and Charles Kindleberger formalised the pattern decades ago, and the KOSPI episode maps onto it with unusual precision.
The four-stage framework the KOSPI followed maps directly onto Minsky’s financing stages, which classify borrowers by whether their cash flows can service debt, repay principal, or require asset price appreciation to stay solvent; the shift from the second to the third category is precisely when systemic fragility becomes acute.
- Displacement. A real economic shift creates a credible reason for asset prices to rise. In Korea, the global AI boom and the country’s genuine semiconductor leadership gave investors a rational basis for repricing equities upward. This is where every bubble begins, and it is precisely why the early warning signs are easy to dismiss. The story is real.
- Credit boom. Margin debt roughly doubled from approximately ₩18.3 trillion in mid-2025 to approximately ₩38.5 trillion by 22 June 2026, a record high. At the end of May 2026, single-stock 2x leveraged ETFs tied to Samsung and SK hynix launched, embedding even more leverage into the system. The market was no longer just rising. It was rising on borrowed money.
- Euphoria. Estimates suggested approximately one in three Koreans were trading domestic stocks. Accounts under minors’ names nearly tripled in 2025, and broker data showed the rate of new account registrations for under-18s ran at roughly ten times the Q1 2025 pace during the first quarter of 2026. National media described a “stock frenzy.” When the marginal buyer is a teenager funded by a parent who opened an account last quarter, the rally’s social momentum has overtaken its fundamental anchor.
- Correction. The mechanical deleveraging spiral that turned a sentiment shift into a 26% drawdown. This is where the architecture matters most, and it deserves its own section.
The presence of a real, compelling narrative in Stage 1 is not incidental. It is what allows the credit and euphoria stages to develop unchallenged, because you always have a story ready to explain away the warning signs. Recognising that pattern in your own reasoning is the first step toward spotting it in real time.
Why leverage turns a correction into a crash
Here is how the spiral worked, step by step:
- ETF rebalancing forces selling. A 2x leveraged ETF (a product designed to deliver twice the daily return of a single stock) must adjust its exposure at the end of every trading day. When the underlying stock falls, maintaining a constant 2x ratio requires selling. That selling is automatic, systematic, and hits a declining market with additional downward pressure.
- Margin calls force additional liquidation. As stock prices fall, investors who bought on margin (using borrowed money to purchase shares) face margin calls, demands from their brokers to either deposit more cash or sell holdings. Most sell. Because retail positioning was concentrated in the same chip stocks, margin-call selling hit the same names the ETFs were already selling.
- Index concentration transmits stock shocks to the whole market. With Samsung and SK hynix representing more than 50% of KOSPI capitalisation, forced selling in those two names translated almost directly into index-level drawdowns. There was no diversification buffer. Every stock-specific shock became a market-wide event.
The result was a feedback loop where falling prices created more selling, which created more falling prices.
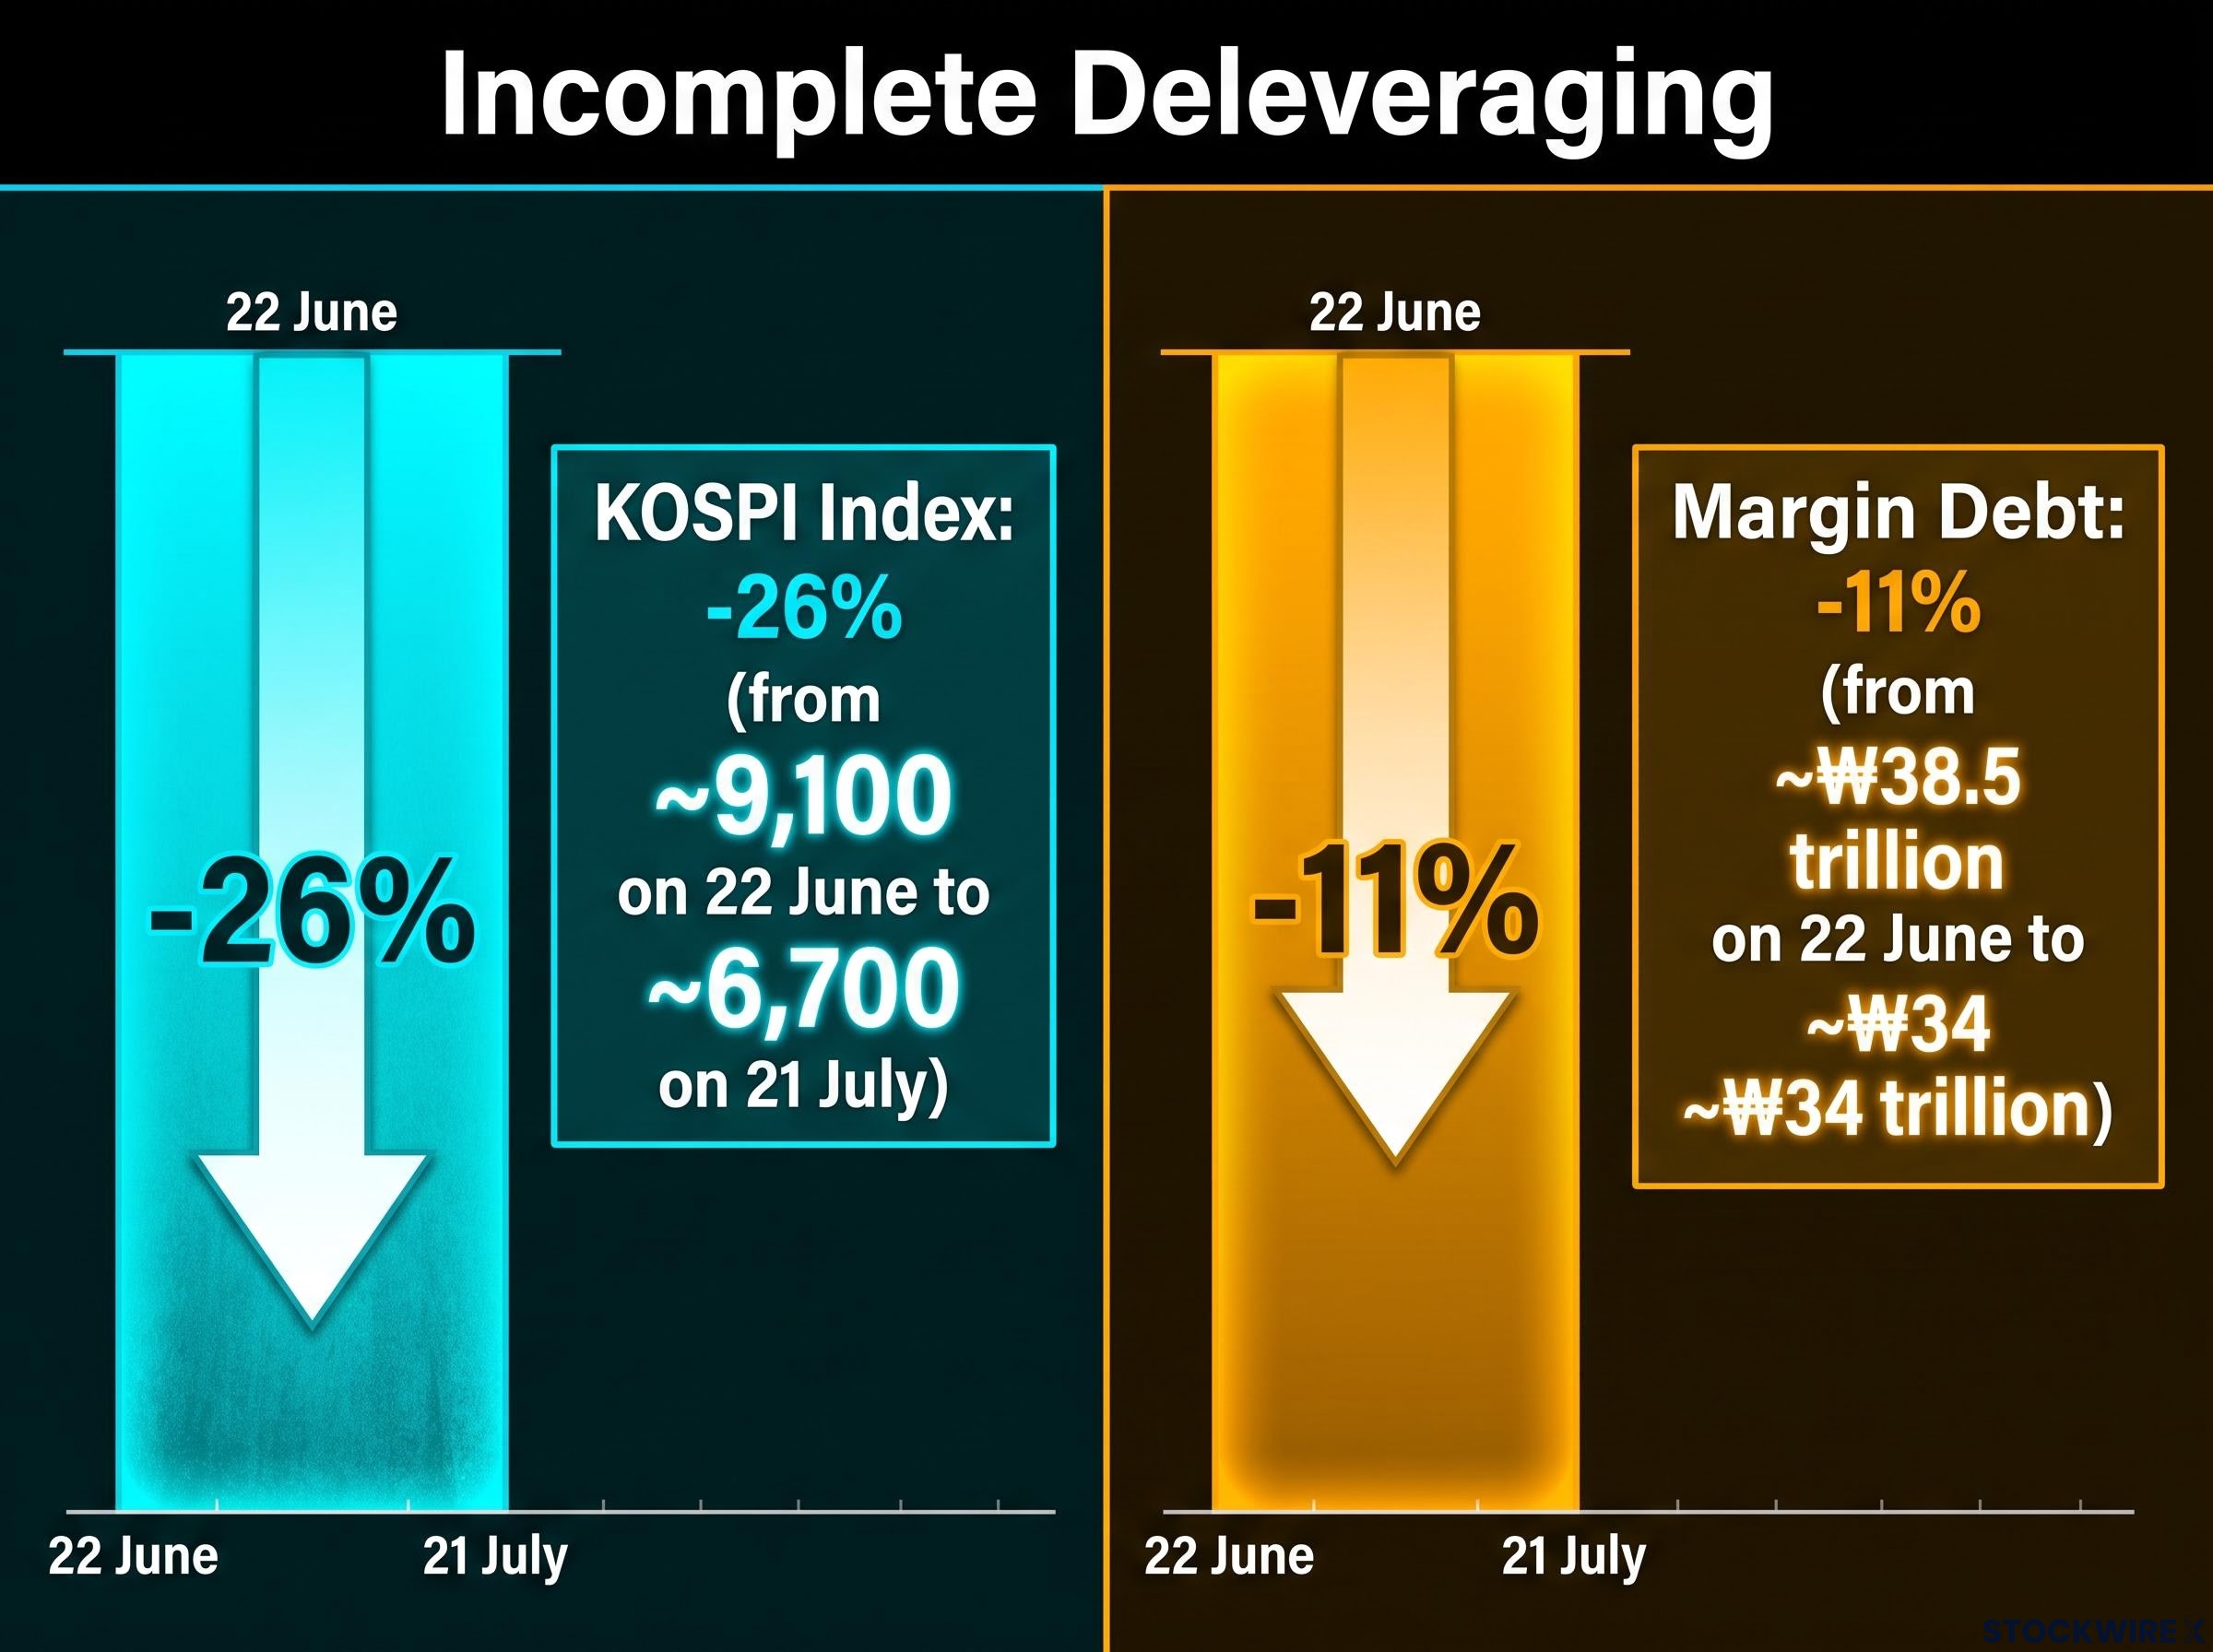
| Metric | Pre-crash level | Post-crash level | Change |
|---|---|---|---|
| Margin debt | ~₩38.5 trillion (22 June peak) | ~₩34 trillion (implied) | ~-11% |
| KOSPI index | ~9,100 (22 June) | ~6,700 (21 July) | ~-26% |
Look at the asymmetry. The index fell more than 25%, but margin balances declined only approximately 11%. Deleveraging was incomplete. That tells you something important: leverage embedded in markets does not simply disappear in a correction. Any portfolio carrying similar exposure during a downturn faces ongoing forced-selling pressure even after the first shock wave passes.
The KOSPI’s margin debt doubling to a record high is not an isolated regional anomaly; margin debt warning signals have been flashing simultaneously in US markets, where margin balances rose 54% year-over-year to a record $1.416 trillion by May 2026, a configuration that preceded the dot-com crash, the global financial crisis, and the 2022 drawdown.
Both JPMorgan and Korean regulators identified single-stock leveraged ETFs as central amplifiers of the crash’s volatility. Regulators later expressed regret about the speed at which these products were approved, acknowledging that the pace of launches had outstripped their assessment of systemic risk.
The five warning signs the KOSPI episode validates
These are not predictions of when a crash will happen. They are signals that a market has entered a structurally fragile regime where the risk-reward of holding leveraged exposure has deteriorated. Each one appeared in the KOSPI case with measurable specificity:
- Explosive new-to-market participation. Broker data indicated that the pace of new account openings for under-18s ran approximately ten times higher in early 2026 than in the equivalent period of 2025. When the marginal buyer is the least experienced investor, traditional valuation discipline is typically absent from the price-setting process.
- Record margin debt and embedded leverage. Margin balances doubled to a record ₩38.5 trillion. When the marginal buyer is also a leveraged buyer, any price decline triggers forced selling rather than discretionary portfolio adjustment.
- Rapid proliferation of short-term amplification products. Reportedly approximately 16 single-stock leveraged ETFs launched within one month, concentrated in AI and chip names. Product design that amplifies short-term gains also amplifies short-term losses asymmetrically under stress.
- Narrow leadership and sector concentration. Samsung and SK hynix exceeded 50% of KOSPI market capitalisation. When two stocks are the market, any sector-level mean reversion becomes an index-level event with no diversification cushion.
- Cultural saturation and mainstream media coverage. National media ran “stock frenzy” coverage. Anecdotes about children’s accounts tripling circulated widely. When a bull market becomes a social story rather than a financial one, the pool of new buyers is approaching exhaustion.
No single indicator in isolation is definitive. Multiple indicators converging simultaneously is what matters. When you see several of these signals present in a market you hold, the practical response is not to sell everything immediately. It is to reduce leveraged exposure, trim concentration in the most euphoric segments, and improve diversification, because the structural fragility is real even if the timing of any correction is unknowable.
The KOSPI’s pattern is a textbook case of a fragile market rally: narrow leadership concentrated in two names, leverage embedded across multiple product types, and an index level that looked strong until the architecture beneath it buckled; the same configuration has been identified by major institutional strategists in other markets running comparable AI-linked gains through mid-2026.
What crashes like this one actually do: the self-correcting function of market corrections
It is tempting to read the KOSPI’s 26.0% drawdown as a pure disaster story. For leveraged retail investors, particularly those who opened accounts for their children near the peak, the damage was severe and real. But a correction of this kind also performs structural functions:
- Forced deleveraging removes the most stretched positions from the system
- Expectation reset forces a recalibration of what growth rates the market was pricing in
- Speculative product exposure reduction pushes the riskiest instruments to the margins
Global strategists described this dynamic as the market’s “self-correcting mechanism,” a painful but structurally necessary process that surfaces vulnerabilities rather than creating them.
The honest caveat is that the correction exposed the market’s fragility rather than fully resolving it. Post-crash margin balances declining only approximately 11% against a 25%-plus index fall tells you that a correction’s first wave rarely cleanses all the structural fragility at once. Markets exiting a speculative episode may carry residual vulnerability for longer than a simple price-recovery chart suggests.
Whether the KOSPI correction fully resets AI and semiconductor sentiment more broadly remains genuinely uncertain. Short-term sentiment movements are not reliably predictable. What you can observe is whether the structural conditions, leverage, concentration, and product design, have actually changed. As of late July 2026, the evidence suggests incomplete resolution.
This article is for informational purposes only and should not be considered financial advice. Investors should conduct their own research and consult with financial professionals before making investment decisions.
Reading the next bubble before it peaks
The KOSPI episode demonstrates something that historical precedents have shown repeatedly: a compelling fundamental narrative, record leverage, and demographic saturation can coexist in the same market at the same time. Recognising that combination as a risk regime is more useful than attempting to predict the date of a correction.
The five warning indicators from this case are not Korea-specific. They are structural signals. Any market where a real, compelling story meets record leverage, broad inexperienced participation, narrow sector leadership, and media saturation warrants a structural review of your exposure, regardless of geography or asset class.
AI stock bubble frameworks applied to the S&P 500 in mid-2026 identify comparable configurations, including Minsky speculative financing classifications, record index concentration, and CAPE ratios exceeded only once in 155 years of market data, giving the KOSPI’s five structural warning signs an immediate application to portfolios beyond Korean equities.
Your job is not to predict crashes. It is to ensure that your portfolio’s leverage and concentration profile does not put you in the position of the forced seller when the next speculative unwind arrives. The KOSPI’s 26.0% drawdown was the cost of ignoring the structural signals. The framework for reading those signals is transferable. The question is whether you apply it before the next episode peaks, not after.
Any market where a real story meets record leverage, broad inexperienced participation, narrow sector leadership, and media saturation warrants a structural review of exposure. That is the durable lesson of the Korean case, and it applies to whatever you hold next.
Past performance does not guarantee future results. Financial projections and market analyses are subject to market conditions and various risk factors.