UBS Maps 3 Market Paths From $200 Oil to S&P 500 at 8,200
3 hrs ago
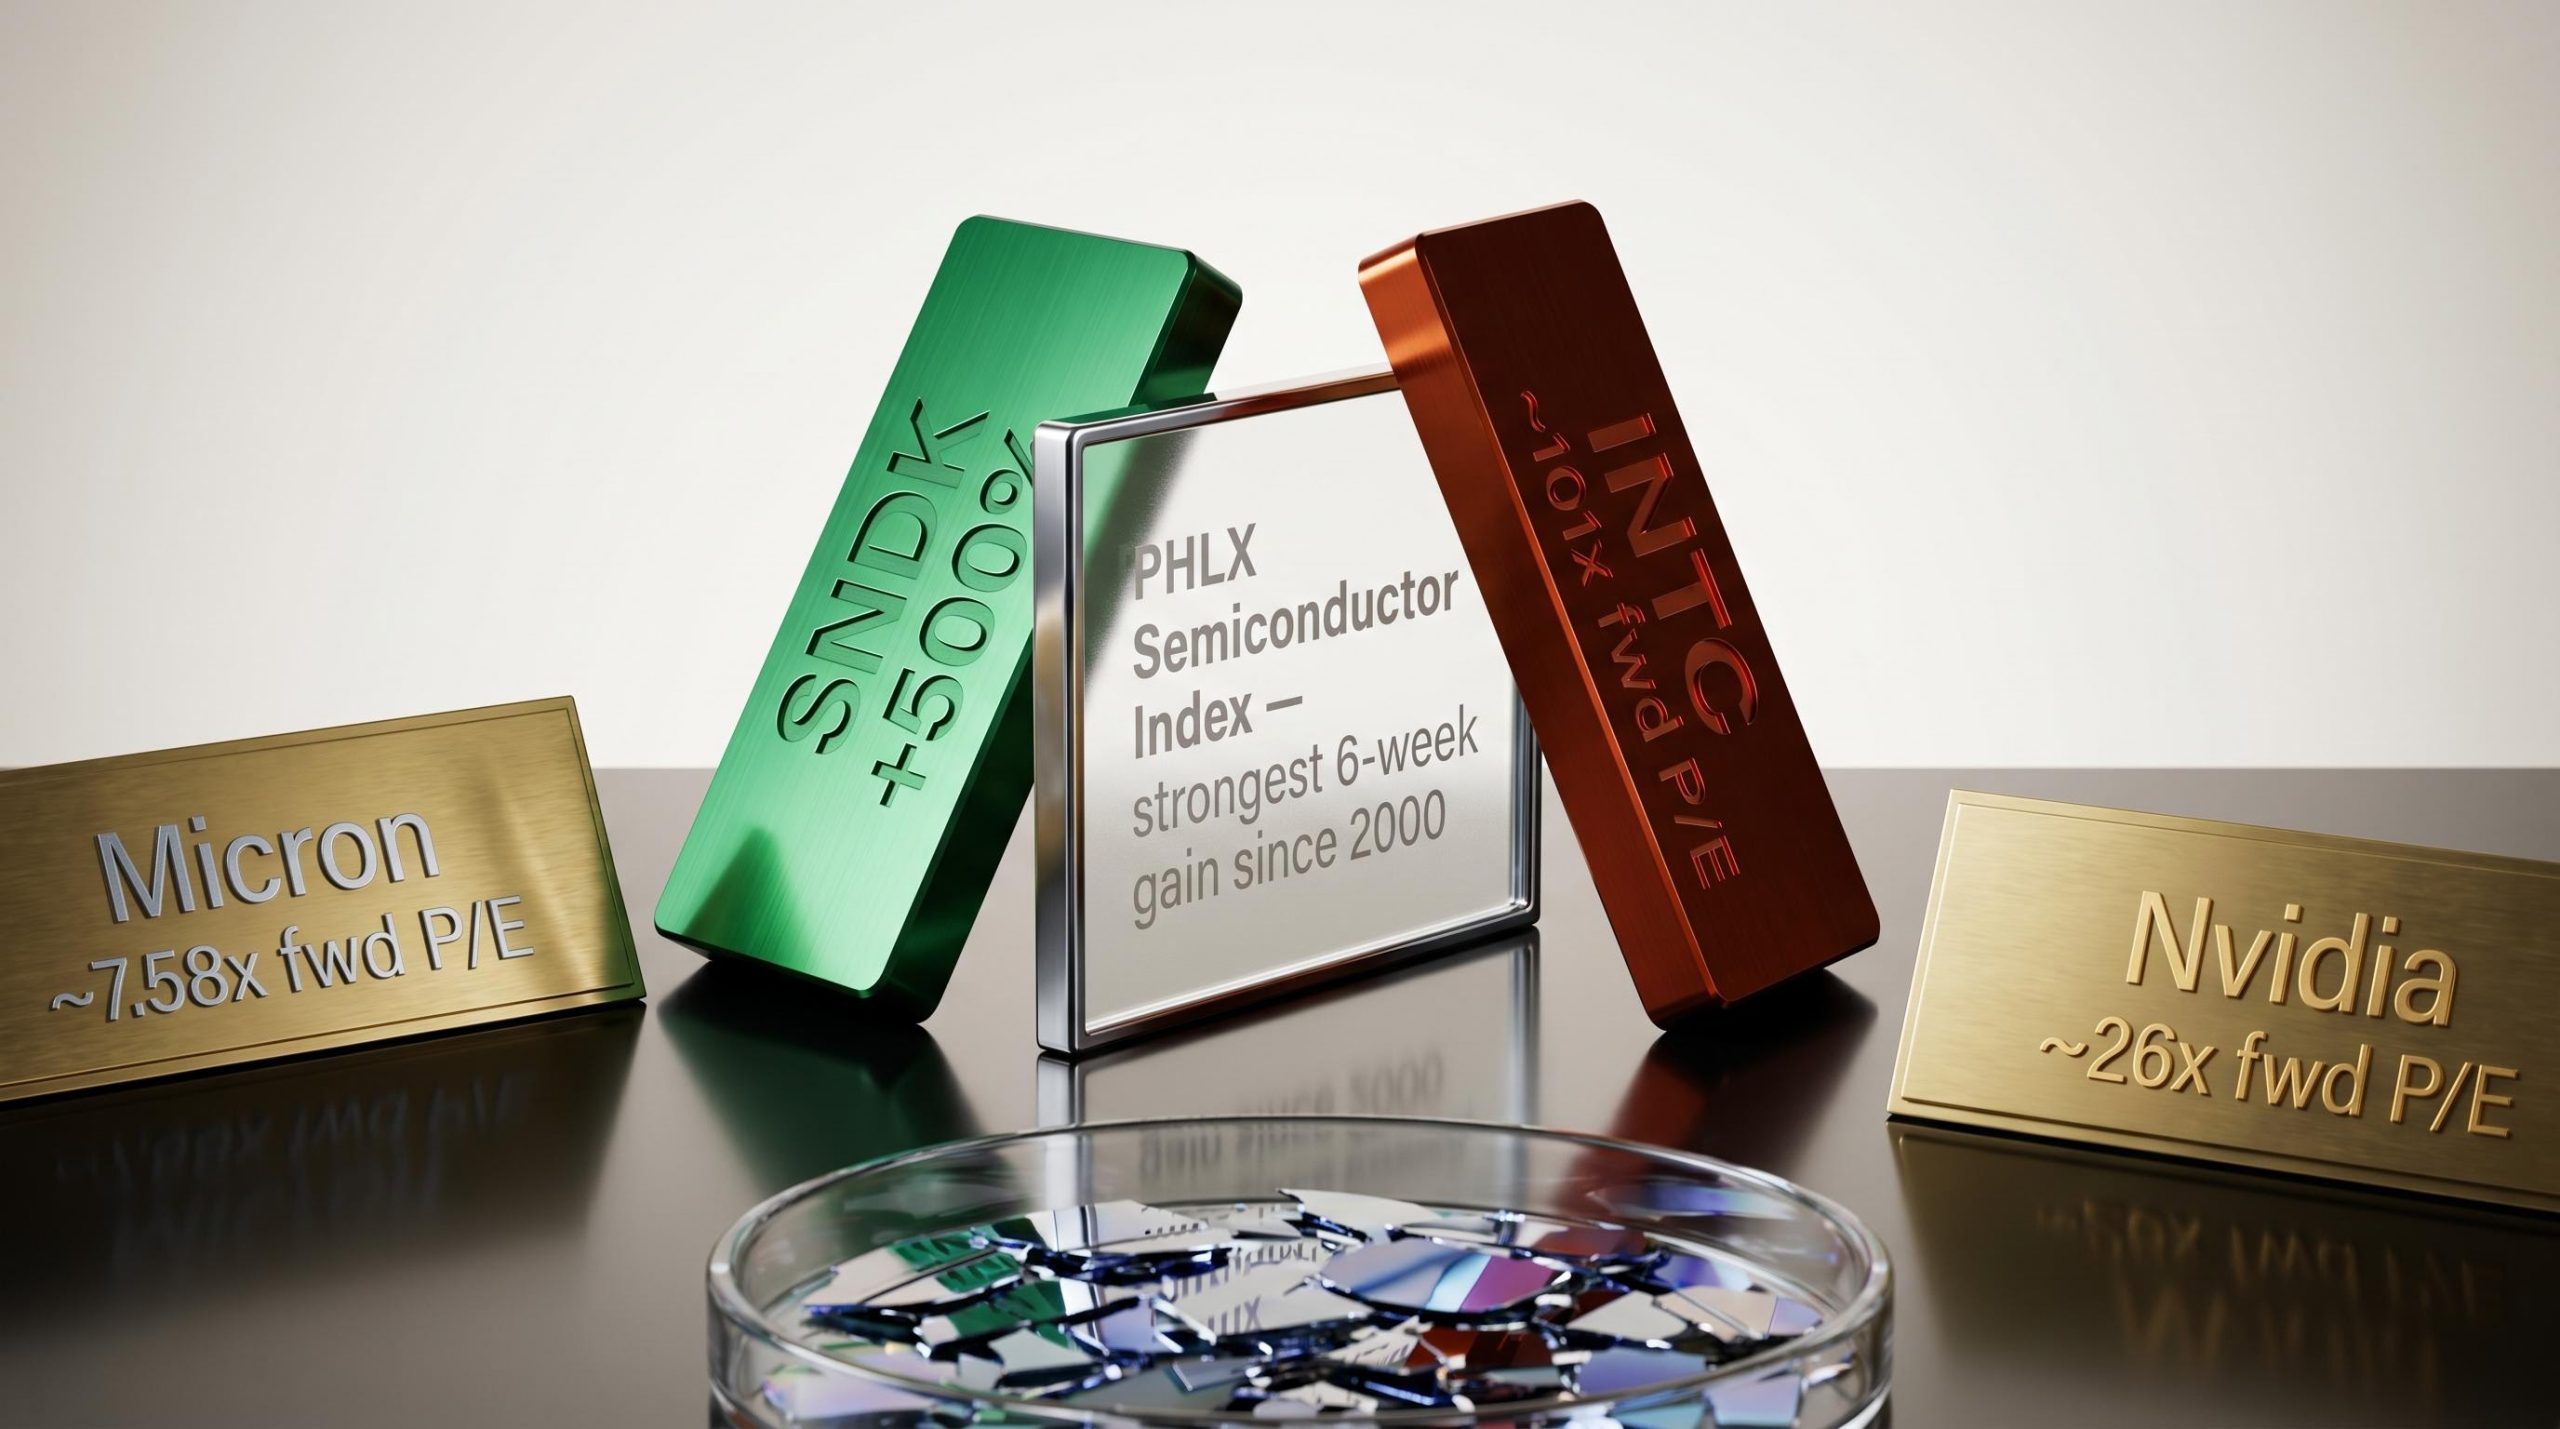
SanDisk is up nearly 500% in 2026. Micron trades at roughly 8.9x forward earnings, well below the S&P 500 average multiple. Those two facts coexist in the same sector, in the same quarter, and they capture the question every semiconductor investor must answer before the next earnings cycle arrives.
The PHLX Semiconductor Index just posted its strongest six-week gain since the dot-com era. The comparison to 2000 is now unavoidable. Whether that comparison is instructive or misleading depends entirely on which valuation framework an investor applies, and to which stock. What follows is a framework-based approach to distinguishing a speculation-driven rally from an earnings-driven one, using real 2026 data and explicit dot-com-era benchmarks, without pretending the answer is simple.
The numbers are not subtle. Intel has gained approximately 217% year to date as of 9 May 2026, reaching its first all-time high in 26 years. SanDisk has climbed roughly 500%. Lam Research has added approximately 72%. The PHLX Semiconductor Index’s six-week surge is, by several measures, the most aggressive sector move in a quarter century.
The disagreement is not about whether the gains are real. It is about what they mean. Ross Mayfield at Baird describes the underlying AI chip earnings as “robust, not a bubble.” On the other side, veteran market participants see something less comfortable in the velocity itself.
Steve Sosnick of Interactive Brokers has characterised the price velocity as unlike anything he can recall in prior market cycles.
The core question is not whether earnings are growing. They are. The question is whether price has already consumed the next several quarters of that growth in six weeks.
The bull case starts with a simple observation: these companies are delivering earnings beats that would look exceptional in any cycle, not just this one.
Micron’s turnaround is the most dramatic. The company posted losses through much of 2023. By Q2 FY2026, it reported revenue of $23.86 billion against expectations of $20.07 billion, with adjusted earnings per share of $12.20 versus the $9.31 consensus. Operating profit for 2026 is projected at approximately $77 billion. Despite that transformation, the stock trades at a forward price-to-earnings ratio of approximately 7.58x on one estimate basis, or roughly 8.9x on an alternative basis. Either figure sits well below the broader market average.
Intel beat revenue expectations in Q1 2026, delivering $13.58 billion against the $12.41 billion consensus, and guided Q2 revenue to a range of $13.8-$14.8 billion. Lam Research reported Q2 fiscal 2026 revenue of $5.345 billion, up 22.1% year on year, with earnings per share of $1.27 beating the $1.17 estimate.
Across the sector, Q1 2026 delivered 29% earnings growth, with a 40% beat rate for the broader technology sector versus consensus estimates. Denise Chisholm at Fidelity has described the earnings growth strength as anomalous compared to historical norms.
| Company | Revenue Beat | EPS vs. Estimate | Forward P/E | YTD Return |
|---|---|---|---|---|
| Micron | $23.86B vs. $20.07B | $12.20 vs. $9.31 | ~7.58x | Strong gain |
| Intel | $13.58B vs. $12.41B | Beat (Q1 2026) | ~101x | ~+217% |
| Lam Research | $5.345B (+22.1% YoY) | $1.27 vs. $1.17 | Moderate Buy | ~+72% |
The earnings are real, they are broad, and they are accelerating. That is why serious analysts are reluctant to label the rally speculative.
Raw price-to-earnings ratios can mislead when earnings are growing at 40-50% annually. Professional valuation of hypergrowth semiconductor names requires three distinct tools, each suited to a different type of stock.
The P/E ratio is only one of five fundamental analysis metrics that work together to build a complete picture of a company’s financial health; reading it in isolation, without cross-checking revenue growth, profit margins, and return on equity, is precisely how investors mistake a cyclical trough for a structurally cheap stock.
The framework matters because applying the wrong tool to the wrong name produces systematically misleading conclusions. PEG suits hypergrowth. EV/EBITDA suits cyclical recovery. Forward normalisation suits names whose current earnings understate their medium-term trajectory.
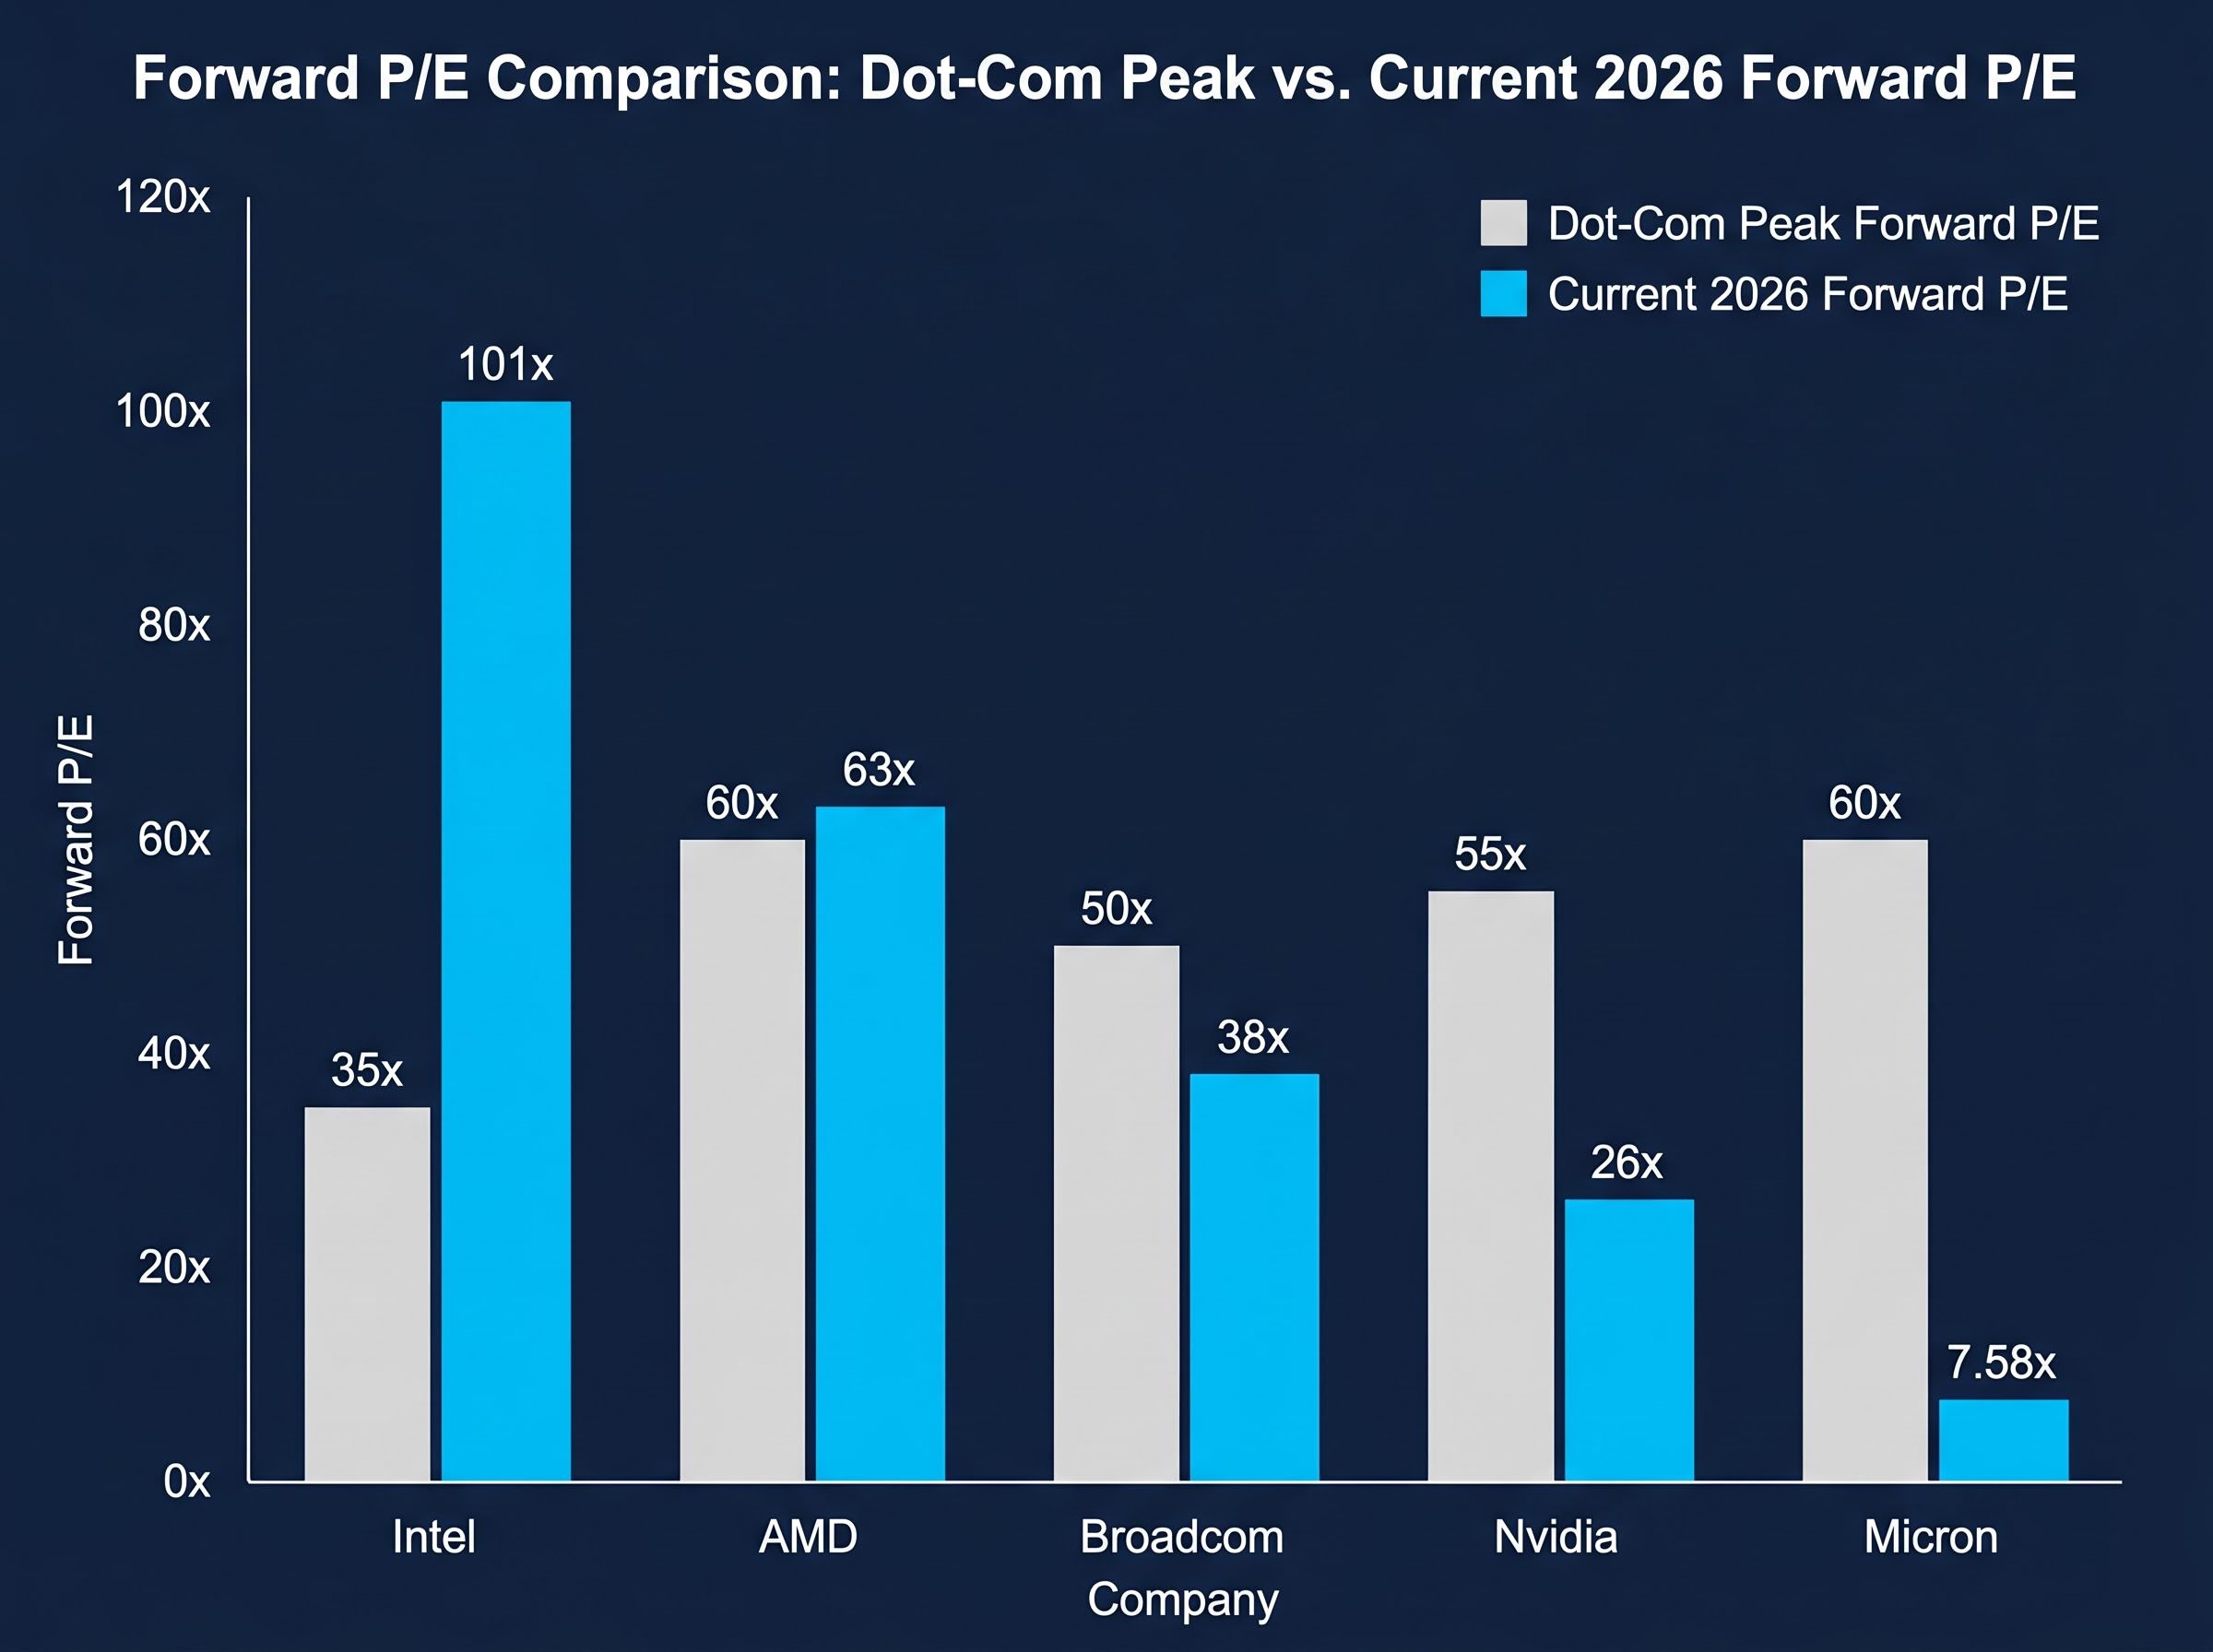
The dot-com comparison requires precision, not abstraction. At the 2000 peak, the PHLX Semiconductor Index traded at an average forward P/E of approximately 45x. Cisco reached roughly 70x. Intel peaked near 35x. Memory analogs like SanDisk traded around 25x.
| Company / Category | Dot-Com Peak Forward P/E | Current Forward P/E | Verdict |
|---|---|---|---|
| Cisco (2000 benchmark) | ~70x | N/A (benchmark only) | N/A |
| Intel | ~35x | ~101x | Above historical peak |
| AMD | ~60x | ~63x | At/above historical peak |
| Broadcom | ~50x | ~38x | Below historical peak |
| Nvidia | ~55x (sector avg) | ~26x | Below historical peak |
| Micron / memory | ~60x | ~7.58x | Far below historical peak |
The table reveals a split that sector-level analysis obscures. Nvidia at roughly 26x and Broadcom at roughly 38x sit comfortably below their dot-com-era category benchmarks. Micron, despite its enormous year-to-date gain, trades at a fraction of the multiple that memory names commanded in 2000.
The outliers are specific. Intel’s forward P/E of approximately 101x is nearly three times its 2000 peak of 35x. AMD at approximately 63x has crept above the 60x hypergrowth benchmark of that era.
Intel carries a consensus analyst rating of “Reduce” from 37 analysts, with a consensus price target of approximately $55, significantly below current trading levels. The gap between where the stock trades and where professional estimates place fair value is the widest disconnect in the sector.
The dot-com comparison is not a blanket answer. It is a stock-by-stock diagnostic that produces different verdicts depending on which name an investor holds.
Semiconductor market concentration has reached a record 13% of US domestic equity valuations as of April 2026, a level that surpasses dot-com era peaks and amplifies the index-level impact of any sector-specific correction, meaning passive investors carry significantly more chip-sector exposure than their headline allocation to broad indices might suggest.
The bull case rests on earnings. The bear case rests on something earnings cannot measure: the structural fragility that comes from the speed of the move itself.
Three risk categories deserve monitoring:
Hyperscaler capex growth is the upstream driver that sustains semiconductor demand, and a sustained deceleration below 25% year on year would directly threaten the valuation premiums built into names trading at 60-85x forward earnings, making it the single most important macro signal to monitor alongside individual stock multiples.
Sosnick of Interactive Brokers has described the price velocity as without precedent in his experience of prior cycles. Peter Feinberg, a long-term investor, has separately raised caution about declaring this cycle fundamentally different.
Jonathan Cofsky at Janus Henderson has acknowledged that profits for chip producers have been exceptional, but notes the concentration in specific segments. Valuation frameworks tell investors whether a stock is priced correctly for its fundamentals. They do not capture the risk embedded in a market structure where positioning has already assumed the best outcome.
The framework-based approach, applied consistently across the sector, produces three distinct categories rather than a single verdict.
The intersection of semiconductor cycle and AI tailwinds has compressed what would normally be a multi-year memory recovery into a matter of quarters, with agentic AI workloads driving HBM and NAND demand simultaneously and making trailing earnings figures a particularly poor guide to forward valuation for names like Micron.
Qualcomm, at approximately 22x earnings with a $20 billion buyback authorised, represents a separate category: a dividend-paying name with asymmetric upside that has been largely bypassed by the AI-driven surge.
Treating the semiconductor sector as uniformly expensive or uniformly cheap produces poor investment decisions. The data supports a precise, name-by-name assessment using PEG for hypergrowth names, EV/EBITDA for cyclical recovery names, and analyst consensus target gaps as an early warning signal for positions where market price has moved significantly beyond professional estimates.
The 2026 chip rally is structurally different from the dot-com era at the sector level. Current PEG ratios, EV/EBITDA multiples, and sector-wide earnings growth rates all sit below their 2000 equivalents. But the sector contains specific names where multiple expansion has moved beyond what current fundamentals justify.
Three tools, each with a specific application: PEG for hypergrowth names where earnings growth exceeds 30% annually; EV/EBITDA for cyclical recovery names normalising from a trough; and cycle-adjusted forward estimates for memory names whose trailing figures understate their medium-term trajectory.
Even a rigorous framework cannot eliminate uncertainty when price velocity is this extreme. Position sizing, earnings-event monitoring, and the discipline to track analyst consensus target gaps as early warning signals remain the practical risk controls that complement valuation analysis. The next major earnings cycle will test whether these multiples hold, or whether the market has once again mistaken acceleration for permanence.
For investors wanting to situate the semiconductor rally within the broader market valuation debate, our full explainer on CAPE and Minsky bubble frameworks examines the Shiller CAPE ratio at 40-41, the second-highest reading in 155 years, alongside Minsky’s financing stage classification for hyperscalers, providing the macro-level context that individual stock P/E comparisons cannot supply on their own.
This article is for informational purposes only and should not be considered financial advice. Investors should conduct their own research and consult with financial professionals before making investment decisions. Past performance does not guarantee future results. Financial projections are subject to market conditions and various risk factors.
The PEG ratio divides a stock's price-to-earnings multiple by its earnings growth rate, correcting for the distortion that rapid growth creates in headline P/E figures. A PEG of 1.0x suggests fair value relative to growth, while above 2.0x signals overvaluation; Nvidia and AMD currently sit at approximately 1.2x, well below dot-com-era levels that frequently exceeded 2.0x.
At the 2000 peak, the PHLX Semiconductor Index traded at an average forward P/E of roughly 45x, with names like Cisco reaching 70x; in 2026, sector leaders like Nvidia trade at approximately 26x and Micron at under 8x, though Intel at 101x forward earnings has exceeded its own dot-com-era peak of 35x.
Intel, with a forward P/E of approximately 101x and a consensus analyst rating of Reduce with a price target of around $55, and AMD at approximately 63x forward earnings (at or above its dot-com-era benchmark) are the two names where multiple expansion has moved materially beyond what analyst consensus and historical norms support.
Micron's forward P/E of approximately 7.58x-8.9x reflects the market still applying a cyclical discount to a memory name, even after the company reported Q2 FY2026 revenue of $23.86 billion against a $20.07 billion consensus estimate; the stock's valuation sits far below the roughly 60x multiple that memory names commanded at the dot-com peak.
For cyclical recovery names like Intel, where earnings are normalising from a deep trough, EV/EBITDA (enterprise value to earnings before interest, taxes, depreciation, and amortisation) provides a more stable signal than P/E alone; current sector leaders trade in a target range of 20-25x EV/EBITDA, compared to 30-40x at the dot-com peak.