
Tesla reported 480,126 vehicle deliveries for Q2 2026 on 2 July, a number that landed roughly 74,000 units above Wall Street’s consensus and ended a two-year streak of year-over-year delivery declines in a single quarter.
The beat is not simply a production story. It carries immediate downstream effects on analyst earnings-per-share models, automotive margin assumptions, and how the market prices Tesla heading into the Q2 earnings call. Morgan Stanley and Barclays have already revised their estimates, and the gap between those two banks reveals a live dispute about whether the volume surge translates into durable earnings quality.
Here is what the delivery numbers actually confirmed, what the analyst revisions signal about the sustainability of the beat, and what the data does and does not tell you about Tesla’s near-term financial trajectory, so you can assess the result on its own terms before the earnings call arrives.
Tesla’s Q2 delivery numbers by the figures that actually matter
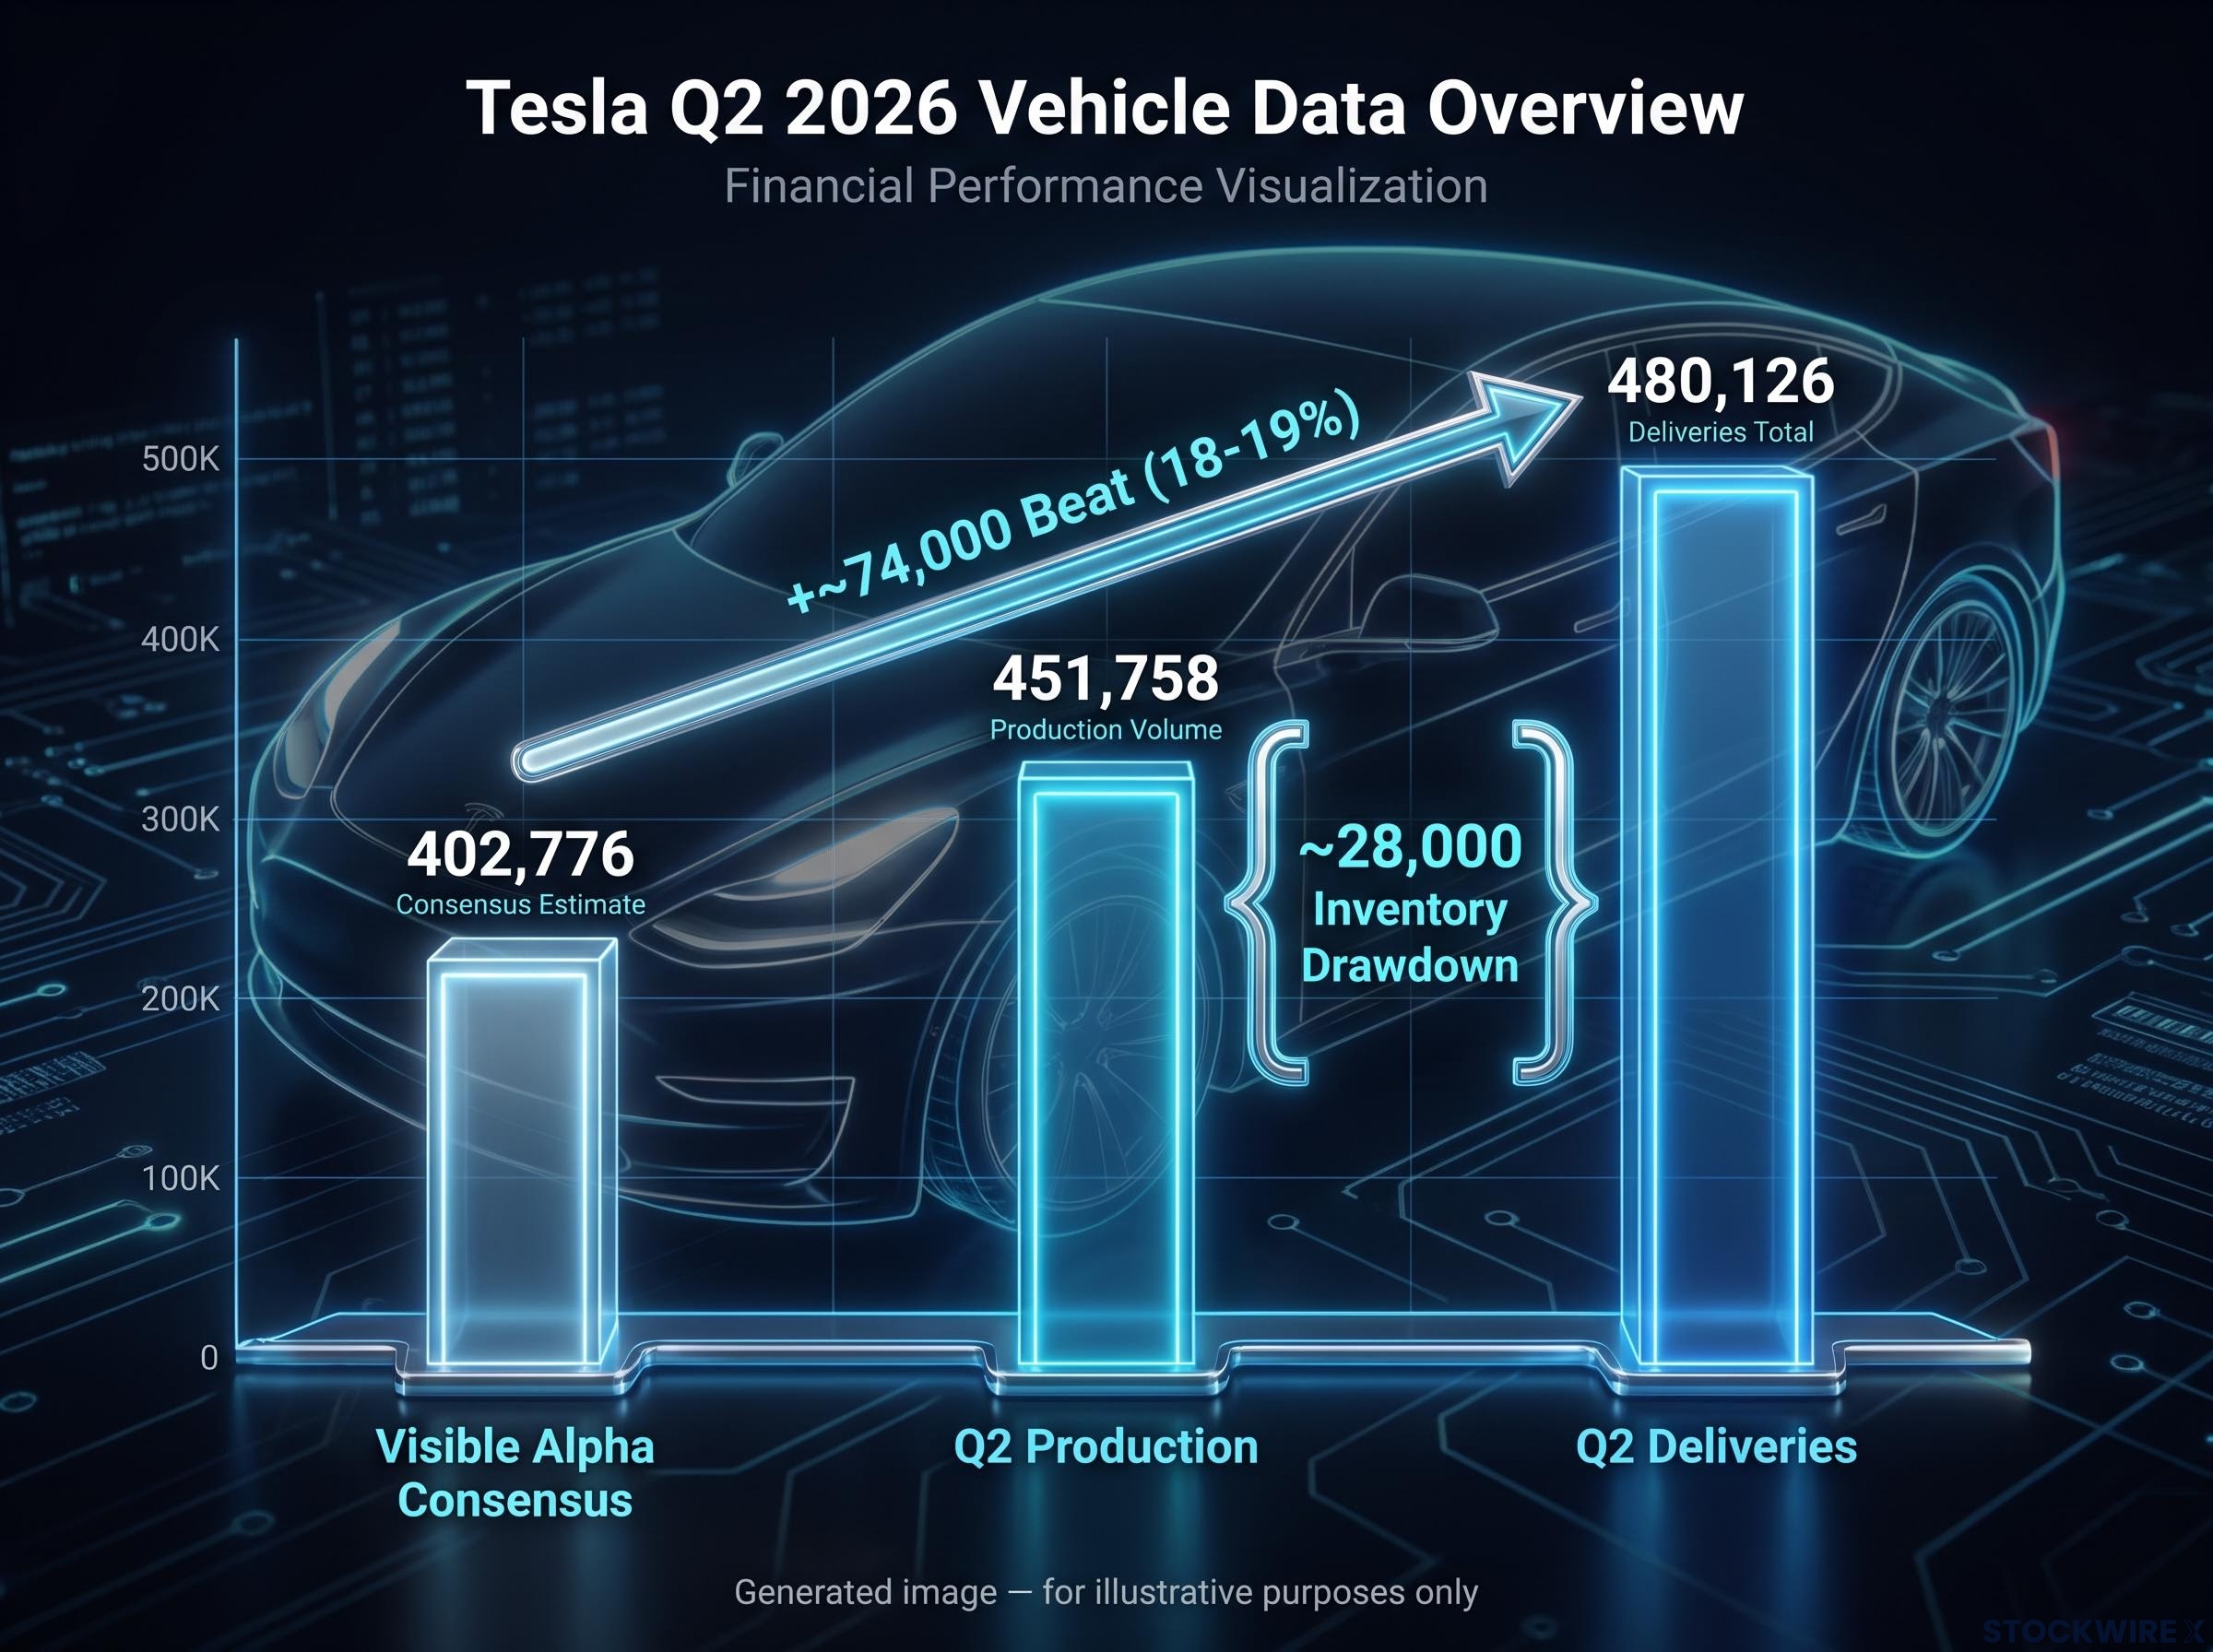
Tesla’s Q2 2026 deliveries came in at 480,126 vehicles. Production for the quarter was 451,758 vehicles. That gap of approximately 28,000 units is an inventory drawdown: Tesla sold through previously built stock rather than delivering purely from new production.
Year-over-year, the result represents roughly 25% growth versus Q2 2025 (approximately 384,000 units). Sequentially, it marks a 34% jump from Q1 2026’s 358,023 vehicles. This was Tesla’s strongest second quarter on record and the first clear year-over-year delivery growth after two consecutive years of declines.
The inventory component matters. Some of this delivery surge came from clearing old stock, not purely from incremental new demand, and that distinction shapes how sustainable the result looks heading into Q3.
How the beat compares to what analysts were expecting
The Visible Alpha consensus estimate compiled by Reuters stood at 402,776 vehicles. Broader estimates from StreetAccount and Bloomberg ranged from 397,000 to 406,000. The beat of approximately 74,000 vehicles, or 18-19% above consensus, represents one of the larger delivery surprises in Tesla’s recent reporting history.
| Metric | Q2 2026 | Q1 2026 | Consensus | Beat / Change |
|---|---|---|---|---|
| Deliveries | 480,126 | 358,023 | 402,776 | +74,000 (~18-19%) |
| Production | 451,758 | — | — | — |
| Delivery-Production Gap | ~28,000 | — | — | Inventory drawdown |
| YoY Growth | ~25% | — | — | First YoY growth in 2 years |
| QoQ Growth | ~34% | — | — | Sequential acceleration |
When big ASX news breaks, our subscribers know first
What Morgan Stanley and Barclays are now forecasting
Morgan Stanley set its Q2 2026 adjusted earnings-per-share (EPS) estimate at $0.69, according to a research note dated approximately 3 July 2026. Barclays came in at $0.55 in a note from the same period. The sell-side consensus before the delivery report sat at approximately $0.47-$0.49.
The $0.14 gap between those two banks is not noise. It tells you that the most important unresolved question after this delivery beat is whether volume gains translate to earnings quality, and the answer depends entirely on margin assumptions.
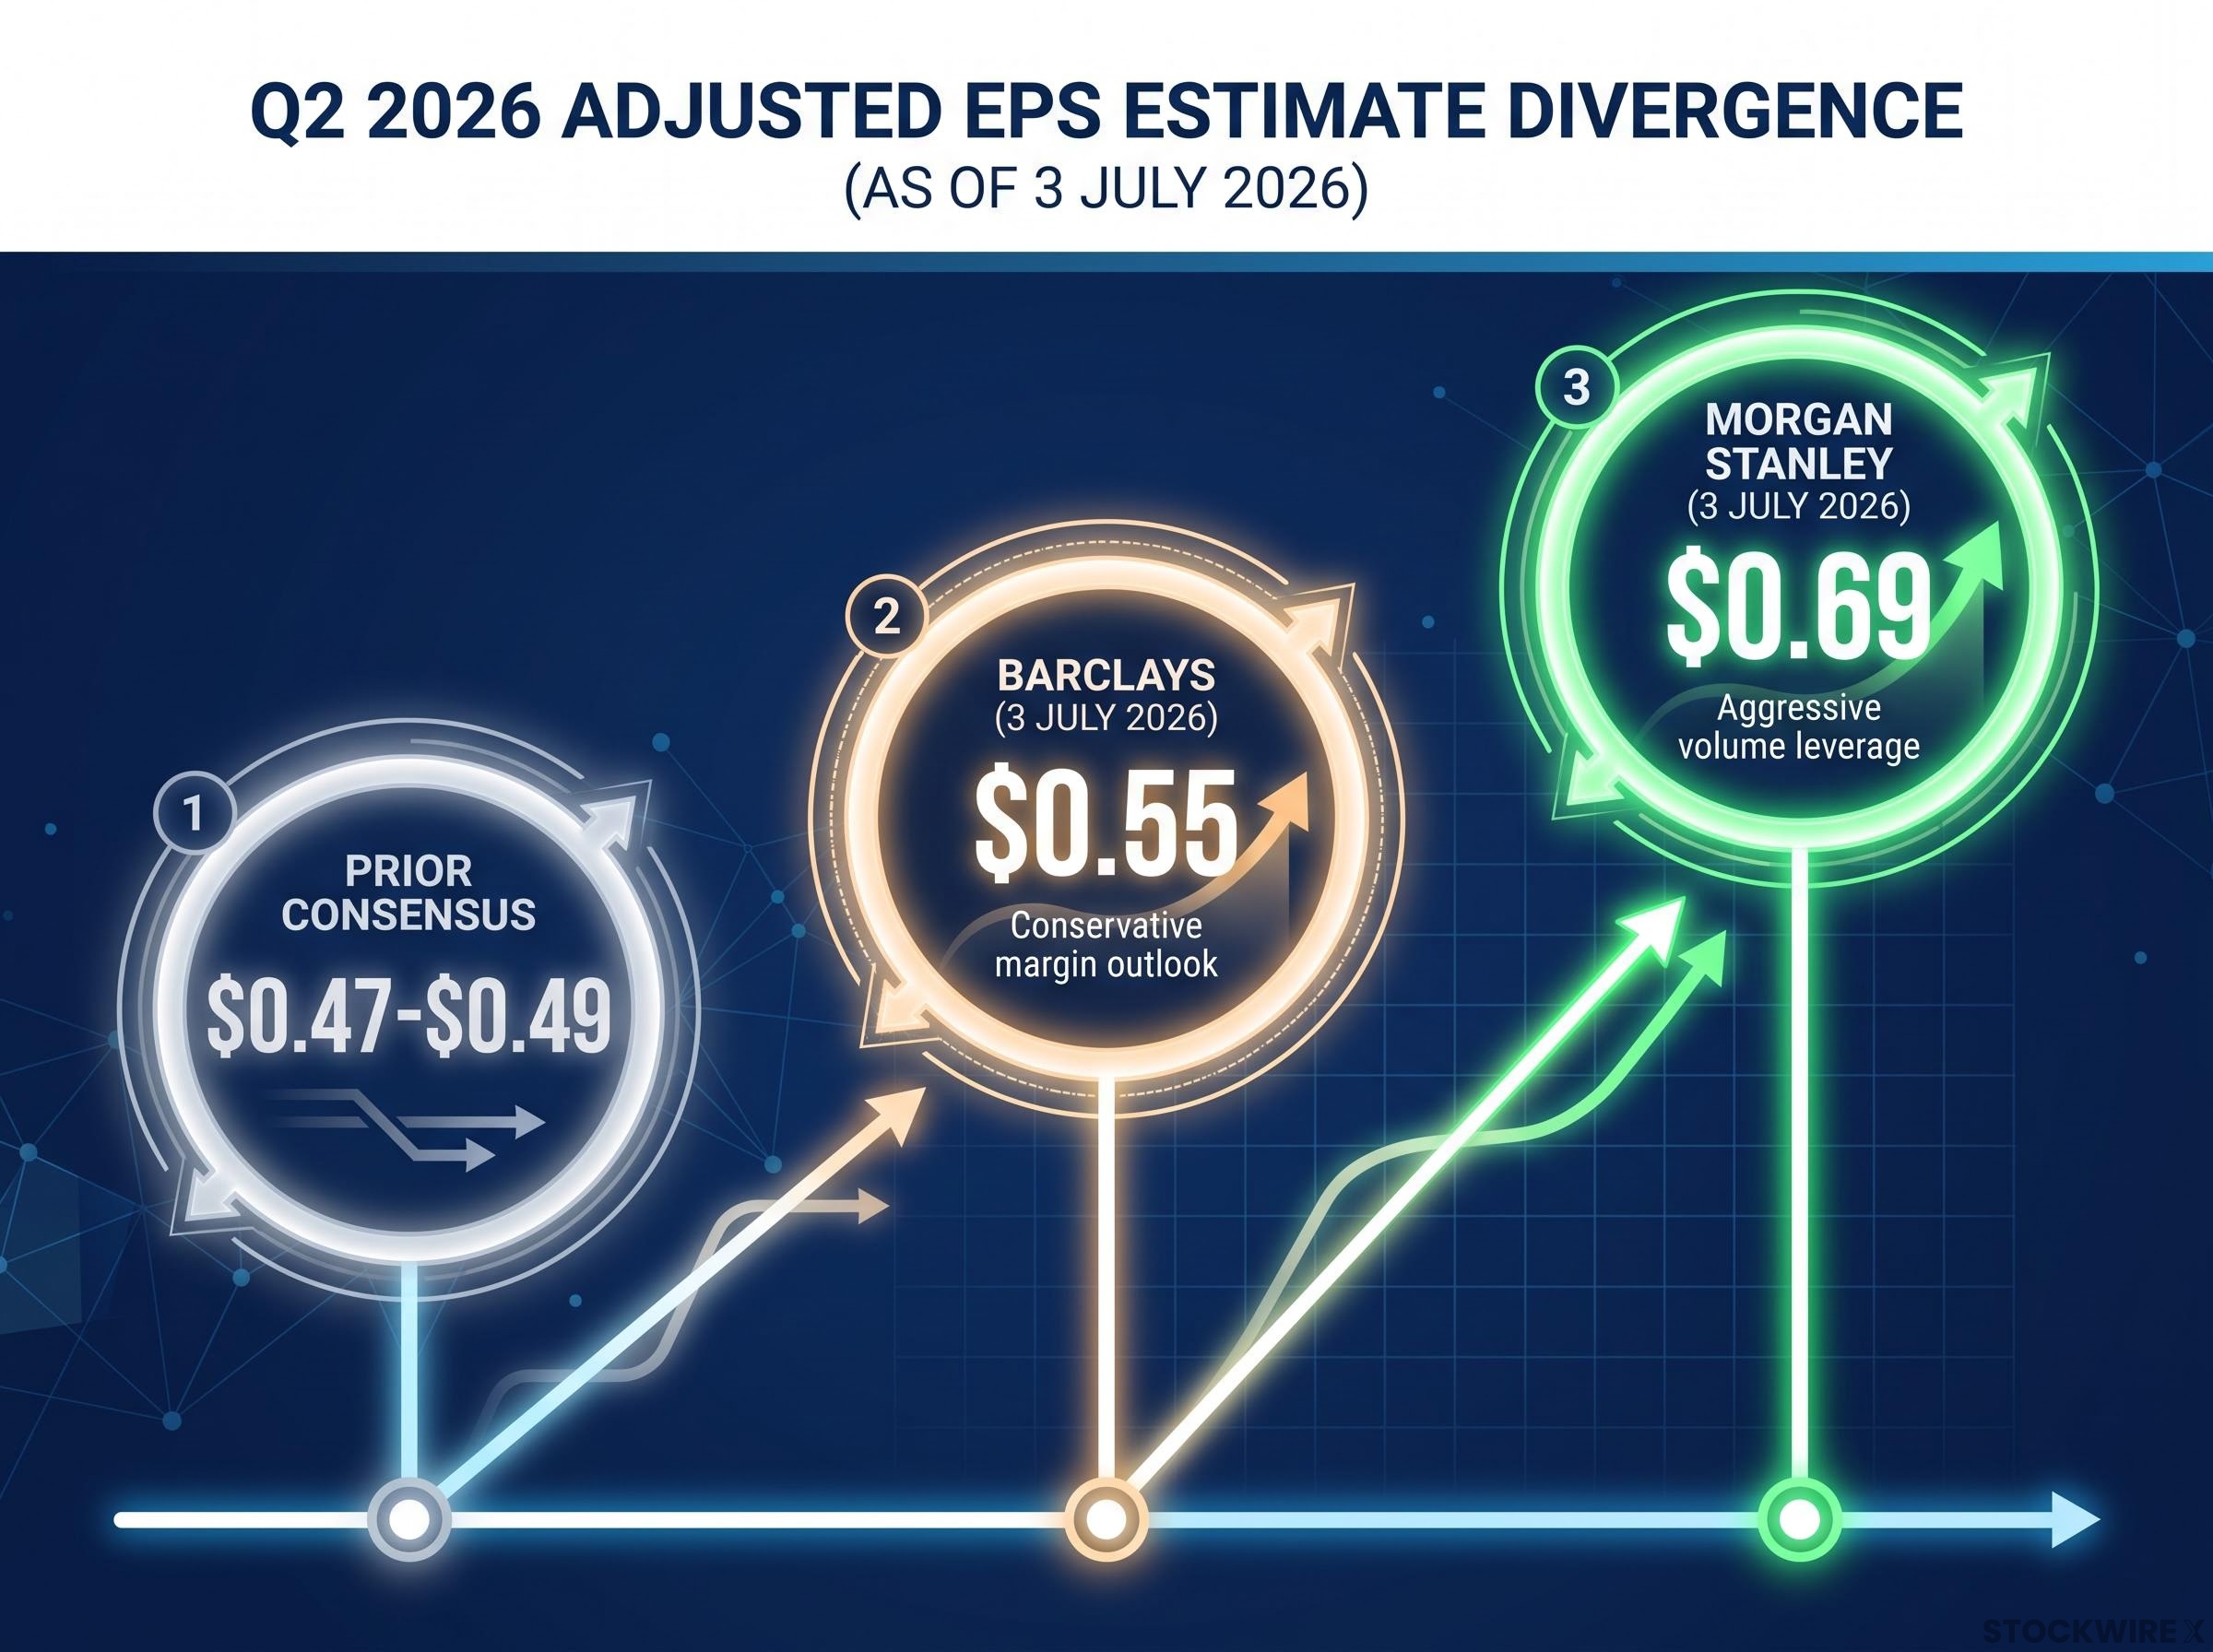
Morgan Stanley’s higher figure reflects more aggressive assumptions around volume leverage from the delivery beat. Barclays takes a more cautious view on margins, pointing to rising input costs and the lack of any one-time tailwinds that had propped up profitability in the prior quarter.
Morgan Stanley updated its annual delivery outlook, lifting its 2026 unit forecast to 1.67 million vehicles and its 2027 figure to 1.86 million vehicles. These are analyst projections contingent on continued H2 execution, not company guidance.
| Firm | Q2 2026 Adj. EPS | Consensus Ref. | 2026 Delivery Forecast | Key Assumption |
|---|---|---|---|---|
| Morgan Stanley | $0.69 | $0.49 | 1.67M units | Aggressive volume leverage |
| Barclays | $0.55 | $0.47 | — | Conservative margin outlook |
Why automotive margins are the number to watch in Tesla’s earnings report
The delivery beat answers the revenue question. It does not answer the profitability question.
The automotive segment contributes roughly 70% of Tesla’s total revenues, making per-vehicle margin the variable that determines whether higher deliveries actually translate into higher earnings. Morgan Stanley puts Q2 automotive gross margin (excluding regulatory credits) at around 18.1%, which sits broadly in line with what the market anticipated. Barclays takes a more cautious stance, anticipating that per-unit profitability will slip quarter-on-quarter as raw-material expenses weigh on results.
Volume versus margin: why the distinction matters for earnings quality
A volume-driven EPS upgrade means more cars were sold, so revenue rose proportionately. A margin-driven EPS upgrade means profitability per unit improved, signalling operational leverage that supports a higher valuation multiple. Q2 primarily delivered the former.
For investors, that distinction matters because volume gains can reverse in a single weak quarter, while margin improvement signals durability. The key risk factors heading into the earnings report include:
Competitive pricing pressure from Chinese EV manufacturers is a recurring risk in the margin outlook, though their ability to exert that pressure directly in the US market remains constrained by a three-layer policy barrier combining a 100% tariff, a connected vehicle software ban, and federal tax credit exclusion.
- Volatile battery raw-material input costs
- Competitive pricing pressure from Chinese EV manufacturers
- No recurrence of the non-recurring cost benefits that boosted margins in Q1
The Q2 earnings report, not the delivery report, will resolve whether the delivery surge translated into the profitability improvement that justifies equity price appreciation.
What drove the beat, and how much of it may last
Cyclical tailwinds: gas prices and geopolitical disruption
High gasoline prices, linked in reporting to U.S.-Iran and Middle East geopolitical tensions, are repeatedly cited as a meaningful tailwind for EV demand during Q2. Elevated pump prices nudged incremental buyers toward electric vehicles in a way that may not persist if geopolitical conditions stabilise.
The IEA Global EV Outlook 2026 documents that elevated oil prices materially increased the cost savings associated with driving EVs during this period, providing authoritative independent context for why gasoline-price tailwinds were a credible demand driver in Q2.
If those tensions ease in Q3, this tailwind fades with them.
Structural contributors: European recovery and platform scaling
European demand recovery is a different kind of signal. It is less dependent on geopolitical conditions and more indicative of lasting market-share expansion for Tesla on the continent.
Continued scaling of the Model 3/Y platform underpins the volume base and is the structural foundation the Q2 result was built on.
The inventory clearance component (the approximately 28,000-unit delivery-over-production gap) is a one-quarter dynamic. It does not by itself signal sustained demand-side strength. A reader who assumes the full 25% year-over-year growth reflects durable structural demand is taking on a risk the data does not justify. The European recovery is the thread worth watching into Q3 and Q4; the gas-price tailwind and inventory clearance are real but transient.
How to read analyst forecast revisions after a delivery beat
Analyst EPS revisions following a delivery beat typically follow a sequential process:
- Higher volume assumptions raise revenue projections.
- Revenue projections flow through to operating leverage assumptions.
- Operating leverage assumptions adjust the EPS model.
- The revised EPS figure is published, often within 24-48 hours of the delivery report.
Sell-side estimates are not company guidance. They are probabilistic forecasts based on analyst assumptions about margin, pricing, and macroeconomic conditions, all of which can shift before the earnings report. Morgan Stanley’s $0.69 versus Barclays’ $0.55 versus the prior consensus of $0.47-$0.49 illustrates how wide the range of outcomes can be after a single delivery beat.
Analyst EPS revisions following a delivery beat are conditional models, not confirmed outcomes, and the gap between Morgan Stanley’s $0.69 and Barclays’ $0.55 illustrates precisely the dynamic that causes stocks to move sharply on earnings day even when the underlying business result looks straightforward.
The direction of consensus revision, whether estimates are moving up or down across multiple banks, is a more reliable signal than any single bank’s number. Direction tells you about market conviction; individual estimates tell you about individual assumptions.
Tesla releases delivery figures ahead of the full earnings report, creating a window in which the market prices in volume expectations before profitability data is confirmed. Understanding that these revisions are conditional models rather than confirmed outcomes gives you a more disciplined framework for interpreting stock price moves in the days between the delivery report and the earnings call.
What Q3 2026 needs to confirm before this becomes a trend
Two consecutive quarters of year-over-year growth (Q1 and Q2 2026) are encouraging, yet they are not on their own enough to secure Tesla’s first full-year delivery increase since 2023. Q3 and Q4 execution will determine that outcome.
The variables worth tracking heading into Q3 and the Q2 earnings call:
- Whether gasoline prices and European demand maintain Q2-level tailwinds or soften
- Whether automotive gross margins improve sequentially or contract as Barclays warns
- Whether Morgan Stanley’s 1.67 million full-year unit forecast proves achievable through H2
- What management guidance on the Q2 earnings call (expected in late July 2026) reveals about margin trajectory and demand visibility
Morgan Stanley’s full-year forecast of 1.67 million deliveries for 2026 is an analyst projection contingent on continued H2 execution. It is not company guidance and should not be treated as a confirmed outcome.
The delivery beat changes Tesla’s near-term story meaningfully. It does not resolve the longer-term question of whether this represents a durable inflection or a strong quarter built partly on temporary conditions. Q3 will begin to answer that.
A strong quarter with open questions: how to position before Tesla’s earnings call
What Q2 confirmed
- 480,126 deliveries, the strongest second quarter on record
- An 18-19% beat against sell-side consensus
- The first year-over-year delivery growth after two consecutive years of declines
- Upward EPS revisions from both Morgan Stanley and Barclays
What remains open
- Whether demand drivers (particularly elevated gas prices) are sustainable or cyclical
- Automotive margin trajectory, the single most important variable for earnings quality
- The long-term Robotaxi, Optimus, and AI monetisation thesis, which the delivery report does not address
The Tesla valuation debate extends well beyond the delivery report: even with upward EPS revisions from Morgan Stanley and Barclays, Tesla’s 188x forward P/E means the automotive beat does not independently justify the share price without progress on AI and robotics timelines.
The Q2 earnings call, expected in late July 2026, will resolve the most important remaining question: whether higher deliveries produced higher margins, or simply higher revenue on thinner profitability. That distinction is what separates the delivery story (largely positive, confirmed) from the earnings story (dependent on margin data not yet reported).
For investors wanting to understand how a major sell-side firm builds a Tesla price target without relying on FSD or Optimus, our full explainer on Oppenheimer’s Tesla bull case examines the Megapack energy storage growth thesis and the macro oil price tailwind underpinning its 2026-2027 delivery estimates.
This article is for informational purposes only and should not be considered financial advice. Investors should conduct their own research and consult with financial professionals before making investment decisions. Past performance does not guarantee future results. Analyst projections referenced throughout are forward-looking estimates subject to change based on market developments and company performance.