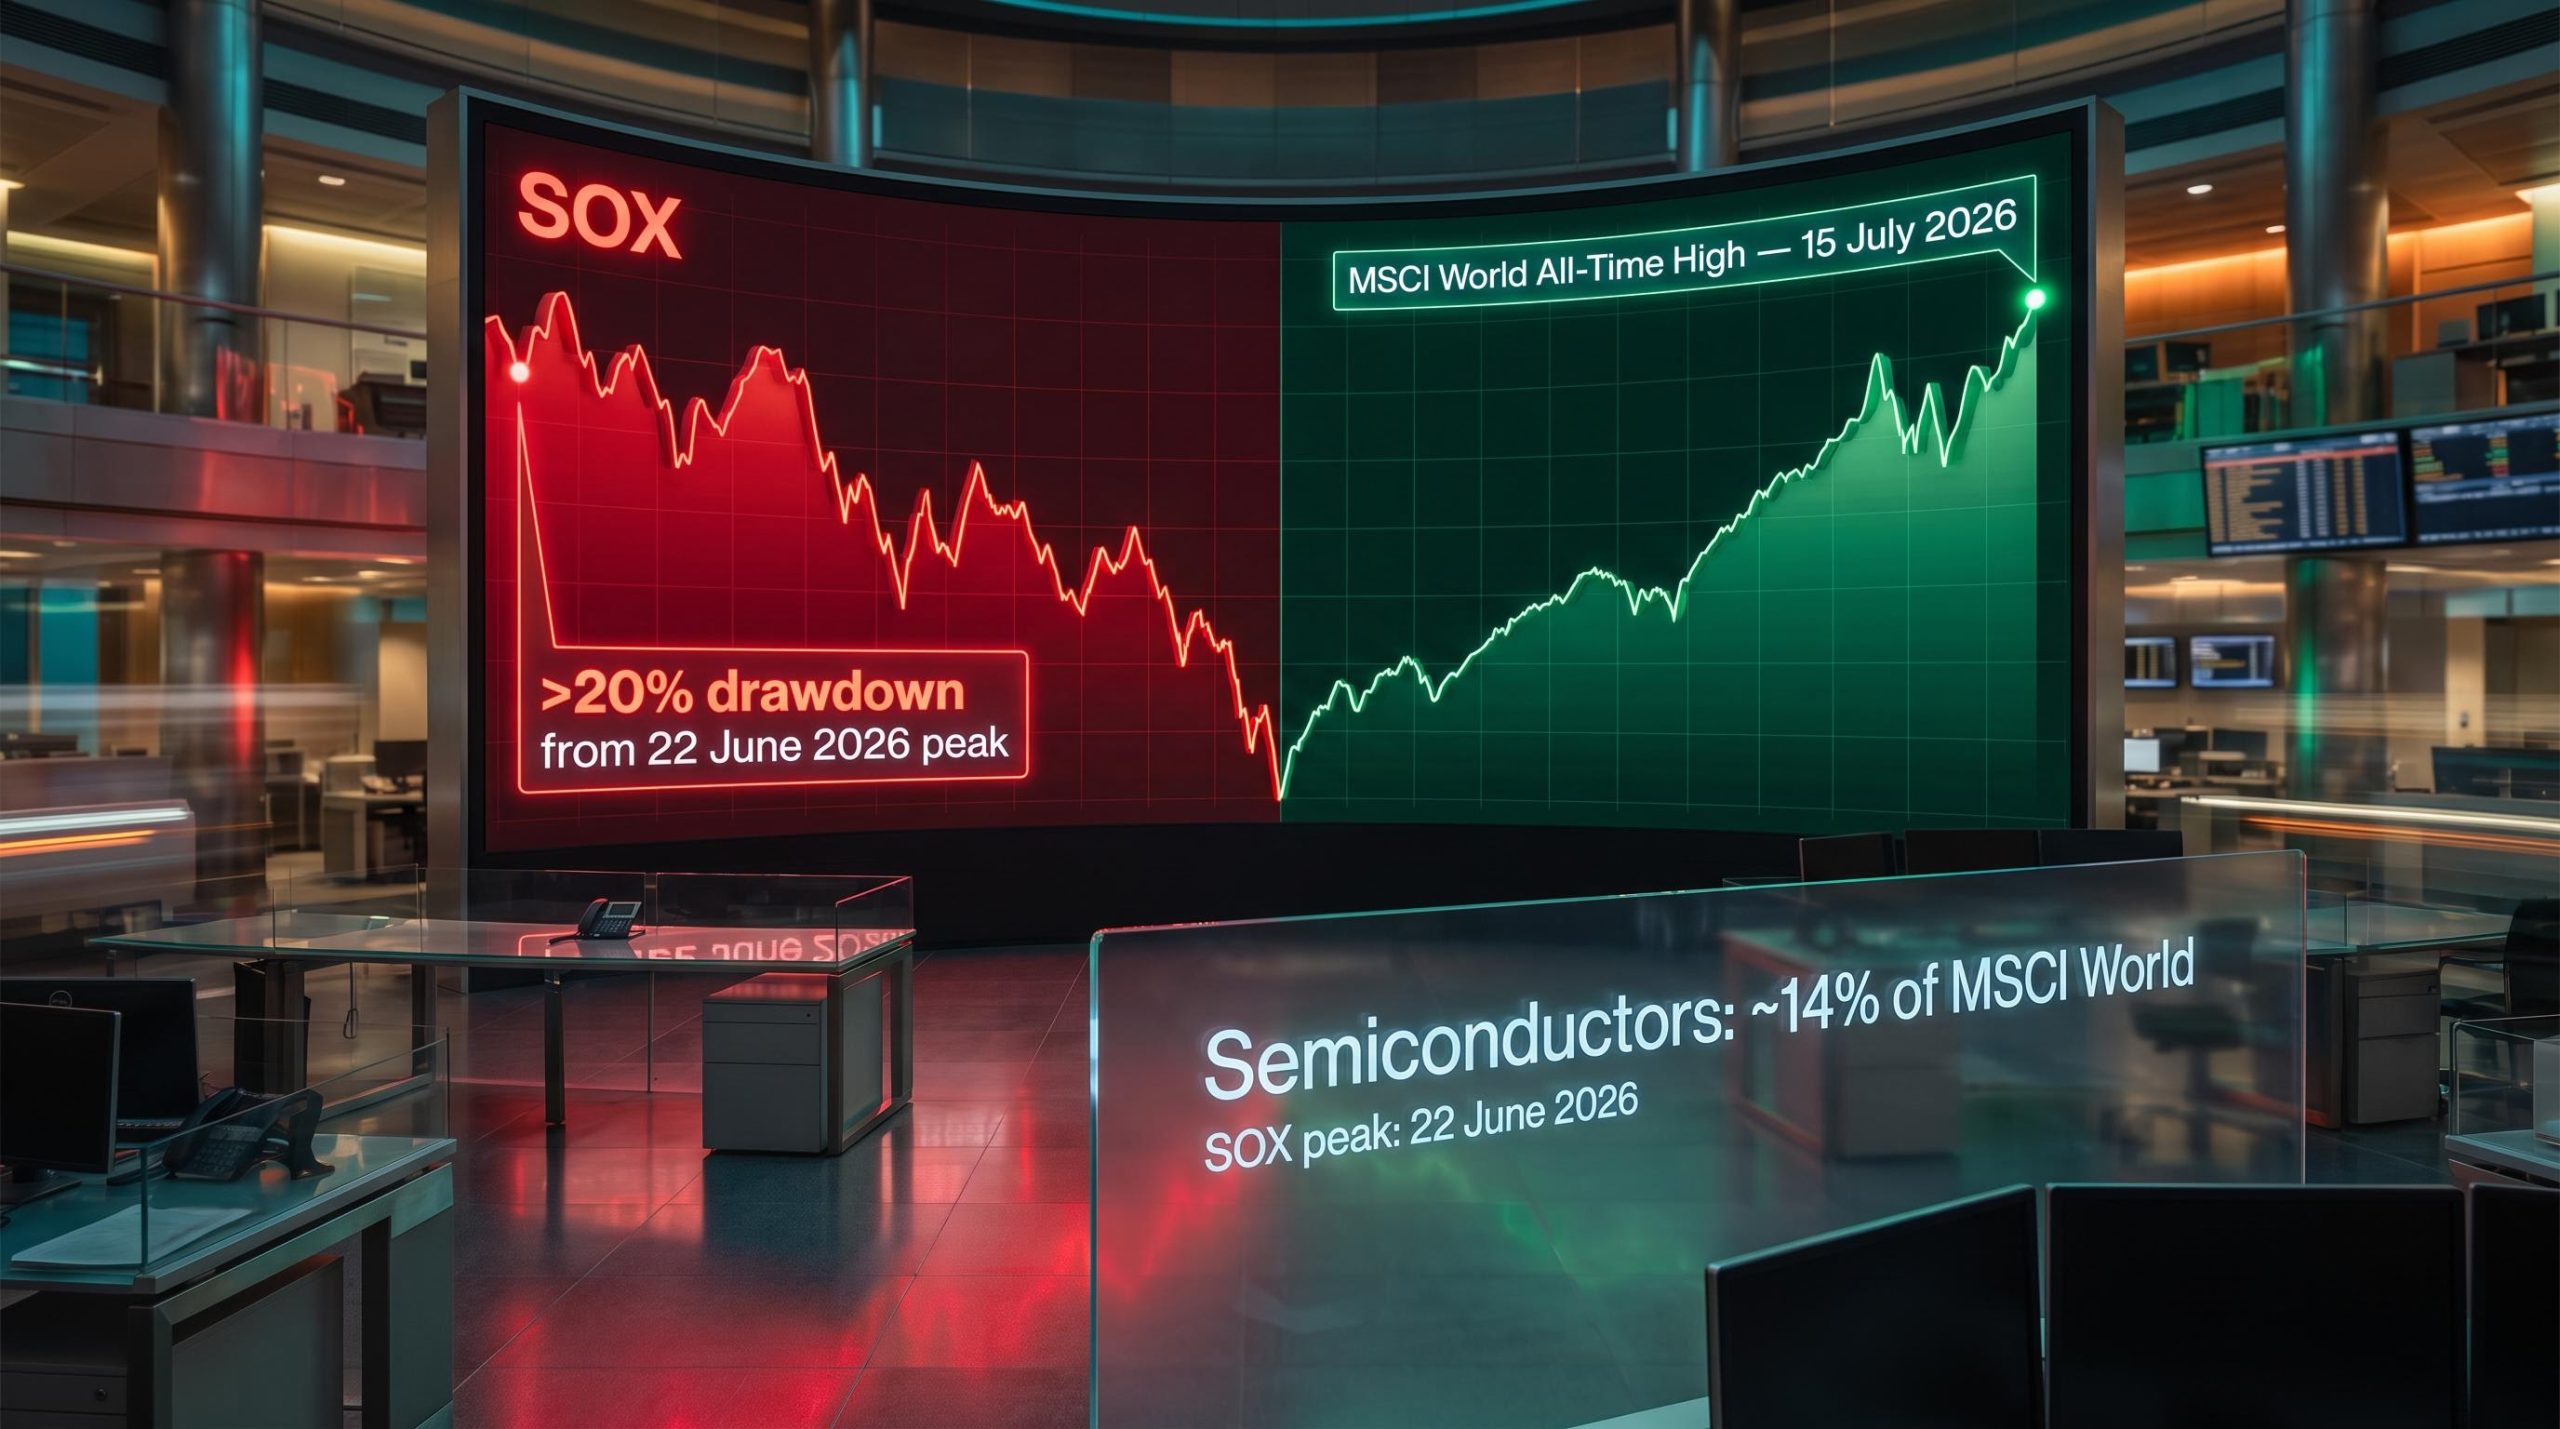
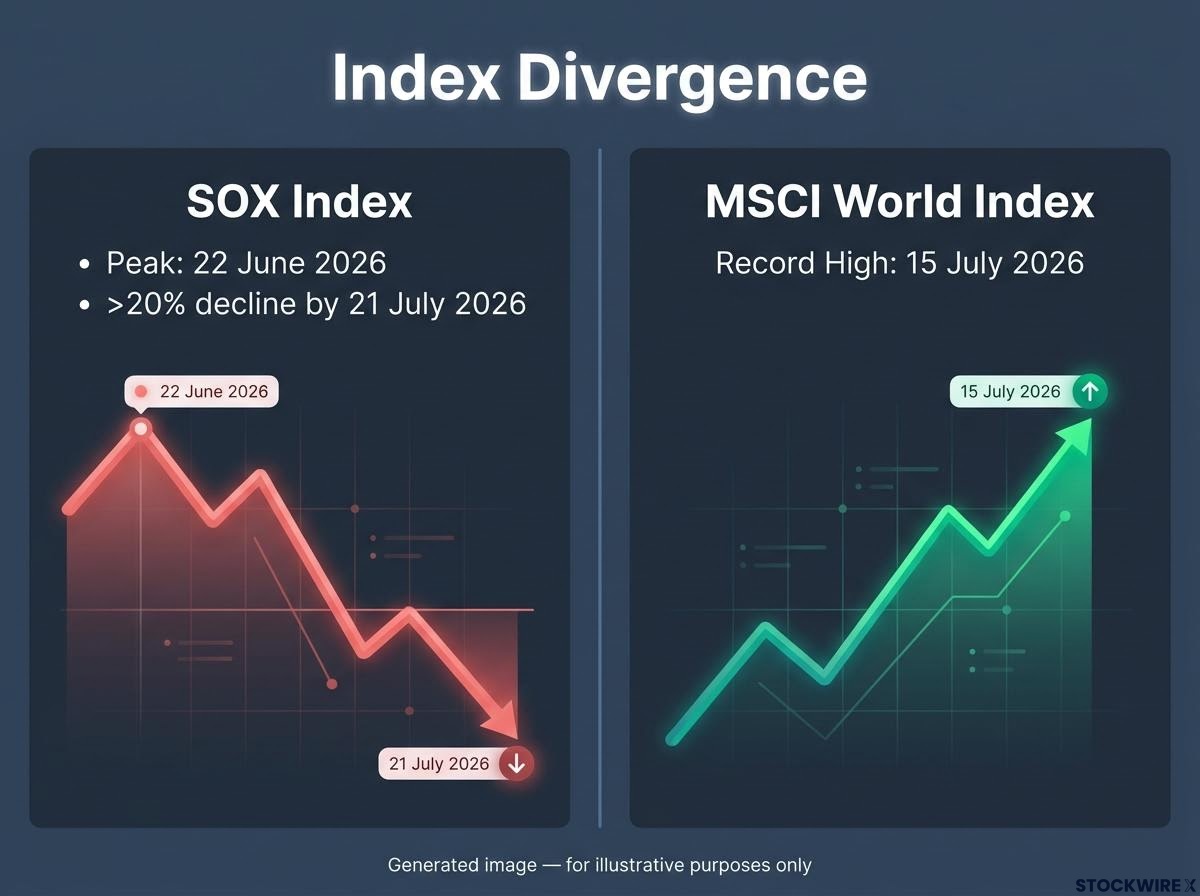
The Philadelphia Semiconductor Index (SOX) breached the 20% drawdown threshold from its 22 June 2026 peak during the same two-week window that the MSCI World Index printed a fresh all-time high on 15 July 2026. One benchmark is flashing bear market. The other is telling you the bull market is alive.
That contradiction is landing in headlines right now, and it is creating a genuine problem for investors who have spent the past two years treating semiconductor and AI performance as the pulse of the entire equity market. If chips are in a bear market, the logic goes, everything else must follow. The MSCI World’s record high says otherwise, and the gap between narrative and data is worth examining closely.
Here is the framework for reading sector corrections separately from market-wide risk, grounded in current data and three historical precedents. After this, you will know whether the SOX decline changes anything material about holding a diversified equity portfolio, and what specifically you would need to see for that answer to change.
A 44% rally in weeks set the stage for the reversal
The SOX did not stumble from a standing start. It sprinted into a wall it built for itself.
The rally that preceded the decline was extreme by any measure:
- 18-day winning streak from late March 2026, accumulating approximately 44% in gains
- A further 30% surge compressed into just 13 days
- SOX peak: 22 June 2026
- Subsequent decline of more than 20% from that peak as of 21 July 2026, per FactSet
That kind of compressed, momentum-driven advance creates overbought conditions that make a reversal a matter of when, not whether. Positioning in AI and semiconductor names had become heavily crowded. Expectations had outrun near-term fundamentals so far that even strong earnings reports failed to sustain prices once results landed.
Broadcom’s AI outlook in early June 2026 was the specific catalyst that broke the expectations story: revenue of approximately $10.8 billion in AI chips, growing 143% year-over-year, still disappointed a market that had priced in something far more aggressive, triggering the sector’s steepest single-session decline since March 2020.
Strategists have characterised the pullback as a “healthy reset” in a still-favourable macro environment, a valuation and positioning adjustment rather than the beginning of a fundamental downturn.
The distinction matters. Chip makers continue to report solid order books and a demand picture in which AI applications are absorbing supply faster than capacity can be added, keeping the earnings trajectory positive across the near and medium term. What broke was the expectations story. When you see a 20%-plus decline after a 44% rally in a matter of weeks, that is a positioning and valuation correction, not a fundamentals collapse, and the two carry very different signals for what comes next.
When big ASX news breaks, our subscribers know first
What the MSCI World’s record high tells you that the SOX cannot
The MSCI World Index reached an all-time high on 15 July 2026, per FactSet data as of 21 July 2026. That is not a stale data point from a different cycle. It happened during the same period the SOX was sliding toward bear market territory.
The arithmetic reinforces the message. According to FactSet, semiconductors accounted for around 14% of MSCI World market capitalisation as of 20 July 2026, meaning weakness in that slice alone lacks the mechanical weight to pull down a broadly diversified global index. For a single-sector decline to set the direction of the entire benchmark, deterioration would need to spread simultaneously across the remaining 86% of global equity earnings, and that is not what the data shows.
| Index | Direction (June-July 2026) | Key Date | Key Figure |
|---|---|---|---|
| SOX | Declining (bear market territory) | 22 June 2026 (peak) | >20% drawdown from peak |
| MSCI World | Rising (new all-time high) | 15 July 2026 (record) | All-time high |
What makes this divergence especially instructive is the nature of the capital movement. Money has rotated within technology, from high-beta AI hardware names toward cash-rich, mature tech platforms, rather than fleeing equities entirely. That is a fundamentally different signal from broad risk-off behaviour. Capital is being repriced and redirected, not withdrawn.
For a diversified equity investor, the MSCI World at record highs during a SOX bear market is the single most important data point in this story. The broader market is not confirming the semiconductor sector’s distress signal.
What “bear market” actually means when applied to a single sector
The phrase “bear market” carries psychological weight that outstrips its technical definition. When it appears in a headline attached to a sector index, it can trigger a response calibrated for something far worse than what is actually happening.
Two definitions sit behind the same label, and conflating them is a category error with real portfolio consequences:
- Technical bear market: Price has declined 20% or more from a recent peak. This is a mathematical threshold. It says nothing about whether the underlying business conditions, earnings, or demand have deteriorated.
- Fundamental bear market: Earnings, order books, and demand have materially deteriorated. The business cycle has turned. Revenue and margins are compressing, not just share prices.
The SOX’s current decline meets the first definition. It does not meet the second. Chip sector order books and demand remain healthy, with AI-related consumption of semiconductors continuing to outpace production capacity and the earnings trajectory across a three-to-thirty-month horizon still pointing upward.
The distinction between technical and fundamental bear market conditions is not purely semantic: the SOX remained more than 60% ahead of its January 2026 starting point even after breaching the 20% drawdown threshold, a coexistence that earnings guidance from Intel, Texas Instruments, and Alphabet will do more to resolve than any single price point.
The distinction is not academic. A technical bear market driven by positioning and valuation excess tends to resolve differently, often faster and with less permanent capital destruction, than one driven by collapsing fundamentals. When you next see “bear market” applied to a sector or industry group, the first question worth asking is which kind it is. The answer determines whether the correct response is concern or recalibration.
History shows this has happened before, and the bull market survived
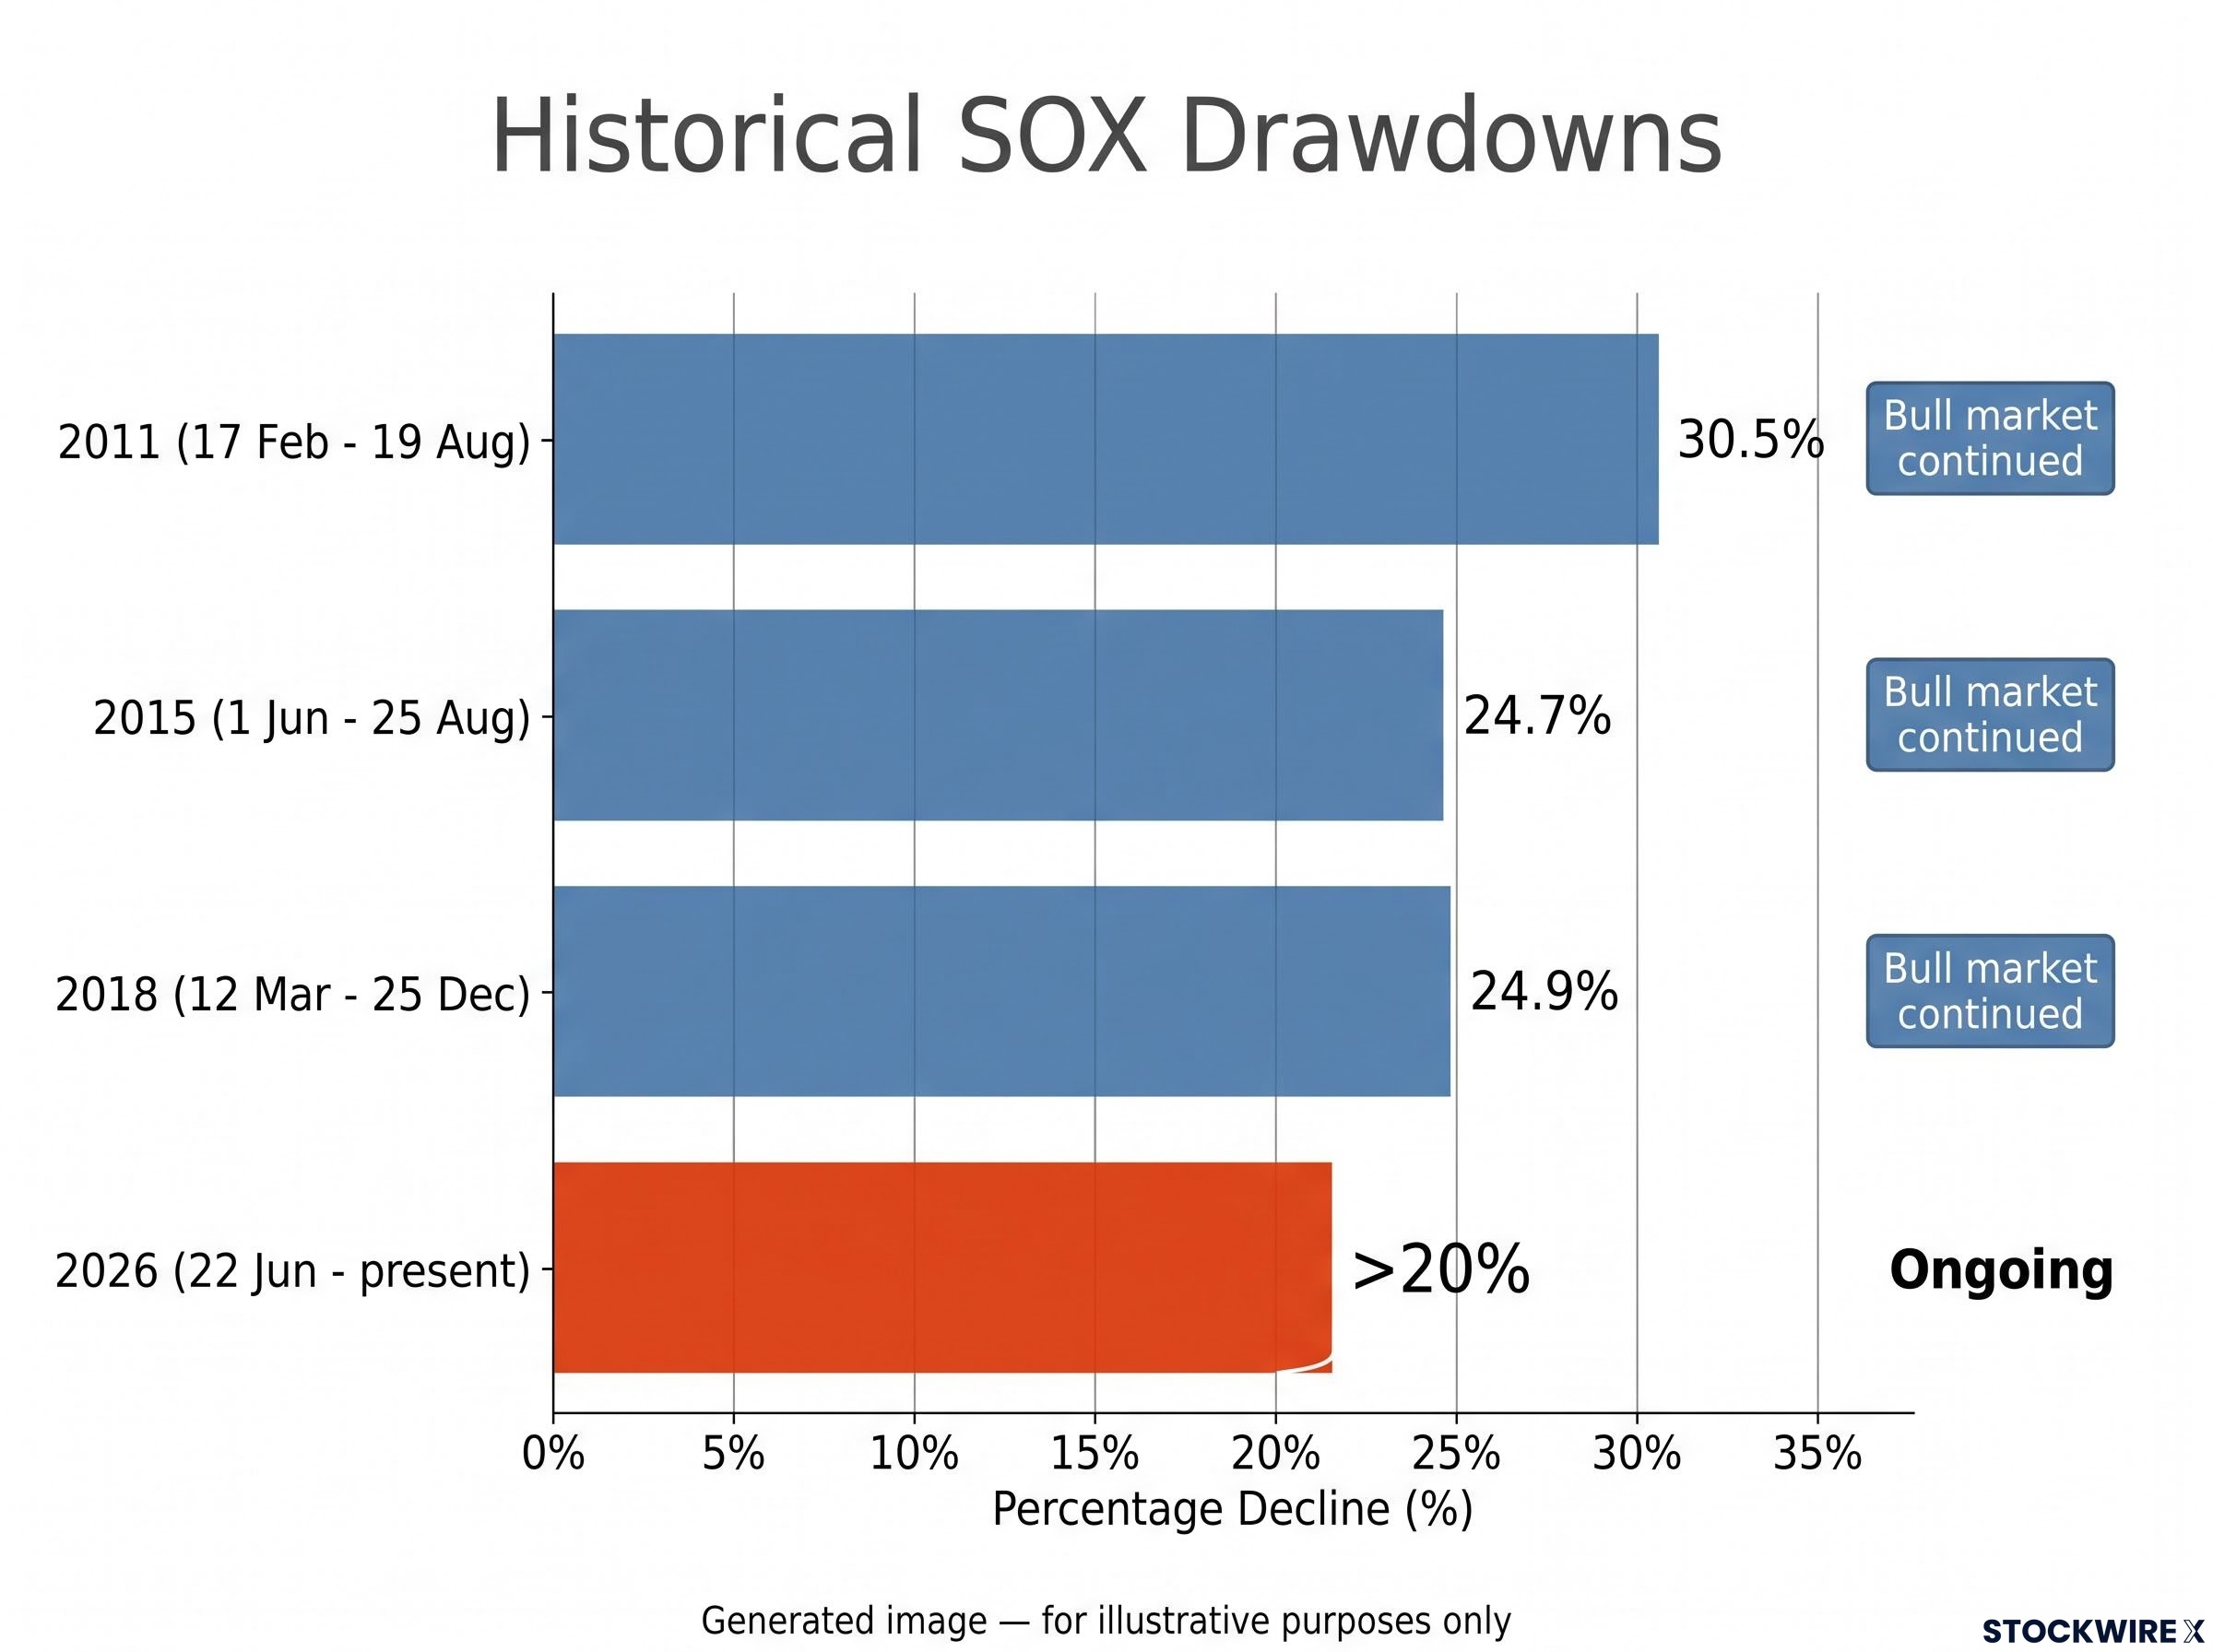
The SOX has done this before. Not once, not ambiguously, but three times during the 2009-2020 bull market, each drawdown exceeding the current one in magnitude, and none of them ended the broader advance.
| Year | SOX Drawdown (%) | Drawdown Period | Bull Market Outcome |
|---|---|---|---|
| 2011 | 30.5% | 17 February to 19 August | Bull market continued |
| 2015 | 24.7% | 1 June to 25 August | Bull market continued |
| 2018 | 24.9% | 12 March to 25 December | Bull market continued |
| 2026 | >20% | 22 June to present | Ongoing |
All three historical drawdowns were larger than the current decline, per FactSet data as of 21 July 2026. The 2011 episode saw the SOX fall 30.5% over six months. In 2015, the drop was 24.7% across fewer than three months. The 2018 correction ran 24.9% over nine months. Each one felt alarming at the time. None terminated the broader equity advance.
Each of the three prior drawdowns in this dataset was deeper than the current SOX decline, and each unfolded within the longest equity bull market of the modern era without bringing it to an end.
The semiconductor sector is not alone in experiencing these kinds of periodic steep declines. The S&P 500 Energy Equipment and Services industry dropped as much as 21.9% from its April 2026 high through approximately 2 July 2026, per FactSet, yet this received little sustained media attention. It illustrates that sharp sector-level pullbacks are a routine feature of healthy equity markets, not a signal unique to semiconductors or the current moment.
Three channels that would make this matter more, and why none are active
Acknowledging risk honestly is a better foundation for confidence than dismissing it. There are three specific channels through which semiconductor weakness could transmit to broader markets, and each is worth naming precisely:
- A genuine collapse in AI and technology capex. Not a valuation reset, but a fundamental pullback in hyperscaler spending, the kind that would signal the AI buildout is decelerating at the enterprise level.
- Tightening credit conditions coinciding with rising defaults. If semiconductor weakness coincided with stress in credit markets, the risk-off dynamic could spread beyond a single sector.
- Sustained risk-off behaviour spreading across other cyclical sectors. If the capital rotation turned from an internal technology repricing into a broad retreat from equities, the correction would no longer be contained.
What current evidence shows
None of these channels are active. The MSCI World’s record high on 15 July 2026 is direct evidence that broader risk appetite has not broken down. Credit conditions have not tightened in response to the semiconductor decline. Capital has rotated within technology, not out of equities, with mid-2026 strategist views remaining constructive on the wider equity market even as semiconductor leadership fades.
The current evidence points to internal repricing within technology, not systemic stress. That assessment could change if any of these three channels activates, which is why they are worth knowing. What you should watch is capex guidance from the largest cloud and AI infrastructure spenders, credit spreads, and the breadth of the selloff across non-technology cyclical sectors. Until those indicators deteriorate, the SOX decline remains a sector story.
What a diversified investor should actually do with this information
The correct response to the SOX bear market depends entirely on which kind of investor you are, and the two profiles lead to meaningfully different conclusions.
If you hold a diversified global equity portfolio, the MSCI World at record highs is your anchor. At approximately 14% of MSCI World market capitalisation, semiconductors are a significant sector, but your portfolio’s risk profile is fundamentally different from someone with concentrated semiconductor or AI hardware exposure. Sector pain does not equal portfolio doom when the other 86% of global equities is doing the opposite of what the headlines imply.
If you hold concentrated semiconductor or AI exposure, the positioning and valuation reset framing still applies. This is not a fundamental breakdown, but the duration and severity of the correction matter more to you, and the distinction between technical and fundamental bear markets has sharper personal stakes.
Correctly separating sentiment-driven versus fundamental declines is the same analytical problem that determines whether buying a sector correction creates value or compounds a loss, and the failure to make that distinction is one of the most documented sources of permanent capital destruction in retail equity portfolios.
The practical guidance is the same for both profiles:
- Favour rebalancing over outright exits; sector rotations within a healthy market are opportunities for discipline, not panic
- Avoid extrapolating sector-specific volatility to the entire market; aggregate global earnings trends and macro conditions are more reliable signals of overall direction
- Apply the mental model check every time the label appears in headlines
When financial media applies the “bear market” label to a sector, ask one question before acting: is this a technical threshold, or a fundamental breakdown? Your answer determines whether the correct move is recalibration or concern.
This article is for informational purposes only and should not be considered financial advice. Investors should conduct their own research and consult with financial professionals before making investment decisions.
What the divergence tells you about how markets actually work
The SOX bear market and the MSCI World record high are not in contradiction. They are both correct simultaneously, and that coexistence is evidence of how diversified markets function under normal conditions.
No single sector sets the direction of the overall equity market. Global economic conditions and aggregate earnings trends carry that weight. The principle holds in both directions: strong semiconductor performance does not by itself lift the global index, and a semiconductor bear market does not drag it down. With semiconductors representing around 14% of MSCI World market capitalisation, their price action simply lacks the reach to override the other 86% of global earnings.
The MSCI World’s all-time high on 15 July 2026 is the empirical bookend for this analysis. The three channels identified earlier, capex collapse, credit tightening, and broad risk-off contagion, remain the variables worth monitoring. The SOX’s daily price action is not.
Grasping that broad market direction reflects the totality of global economic and earnings conditions, rather than the fortunes of any individual sector, gives an investor a framework that will remain useful through every sector correction that follows this one.
For investors wanting the mathematical foundation behind why sector pain does not equal portfolio pain, our full explainer on portfolio diversification principles walks through how combining uncorrelated return streams can reduce volatility by approximately 80% without sacrificing expected returns.
Past performance does not guarantee future results. Financial projections are subject to market conditions and various risk factors.