Gold, long regarded as the ultimate crisis shield, shed 12.2% in a single month as the Strait of Hormuz closed and oil surged past $125 a barrel. Bonds fell alongside equities. The Japanese yen weakened when it should have strengthened. The safe haven assets that four decades of portfolio theory said would protect capital in a crisis have, one by one, failed to do so.
The Iran War, escalating since late February 2026, has produced what the International Energy Agency (IEA) called the largest oil supply disruption in the history of the global oil market. The closure of the Strait of Hormuz, through which roughly 20% of global seaborne crude and liquefied natural gas (LNG) ordinarily flows, has created a crisis that operates by fundamentally different rules than the demand-driven downturns investors have prepared for across the past four decades. What follows explains precisely why the conventional safe haven playbook has broken down, which assets have actually held up, and what Australian investors should consider doing about their portfolios right now.
The IEA Oil Market Report for April 2026 recorded global oil supply falling by 10.1 mb/d in March, corroborating the characterisation of the Hormuz closure as the largest disruption in the history of the global oil market and establishing the scale against which every other supply shock benchmark must now be measured.
Why this crisis is structurally different from every downturn investors have prepared for
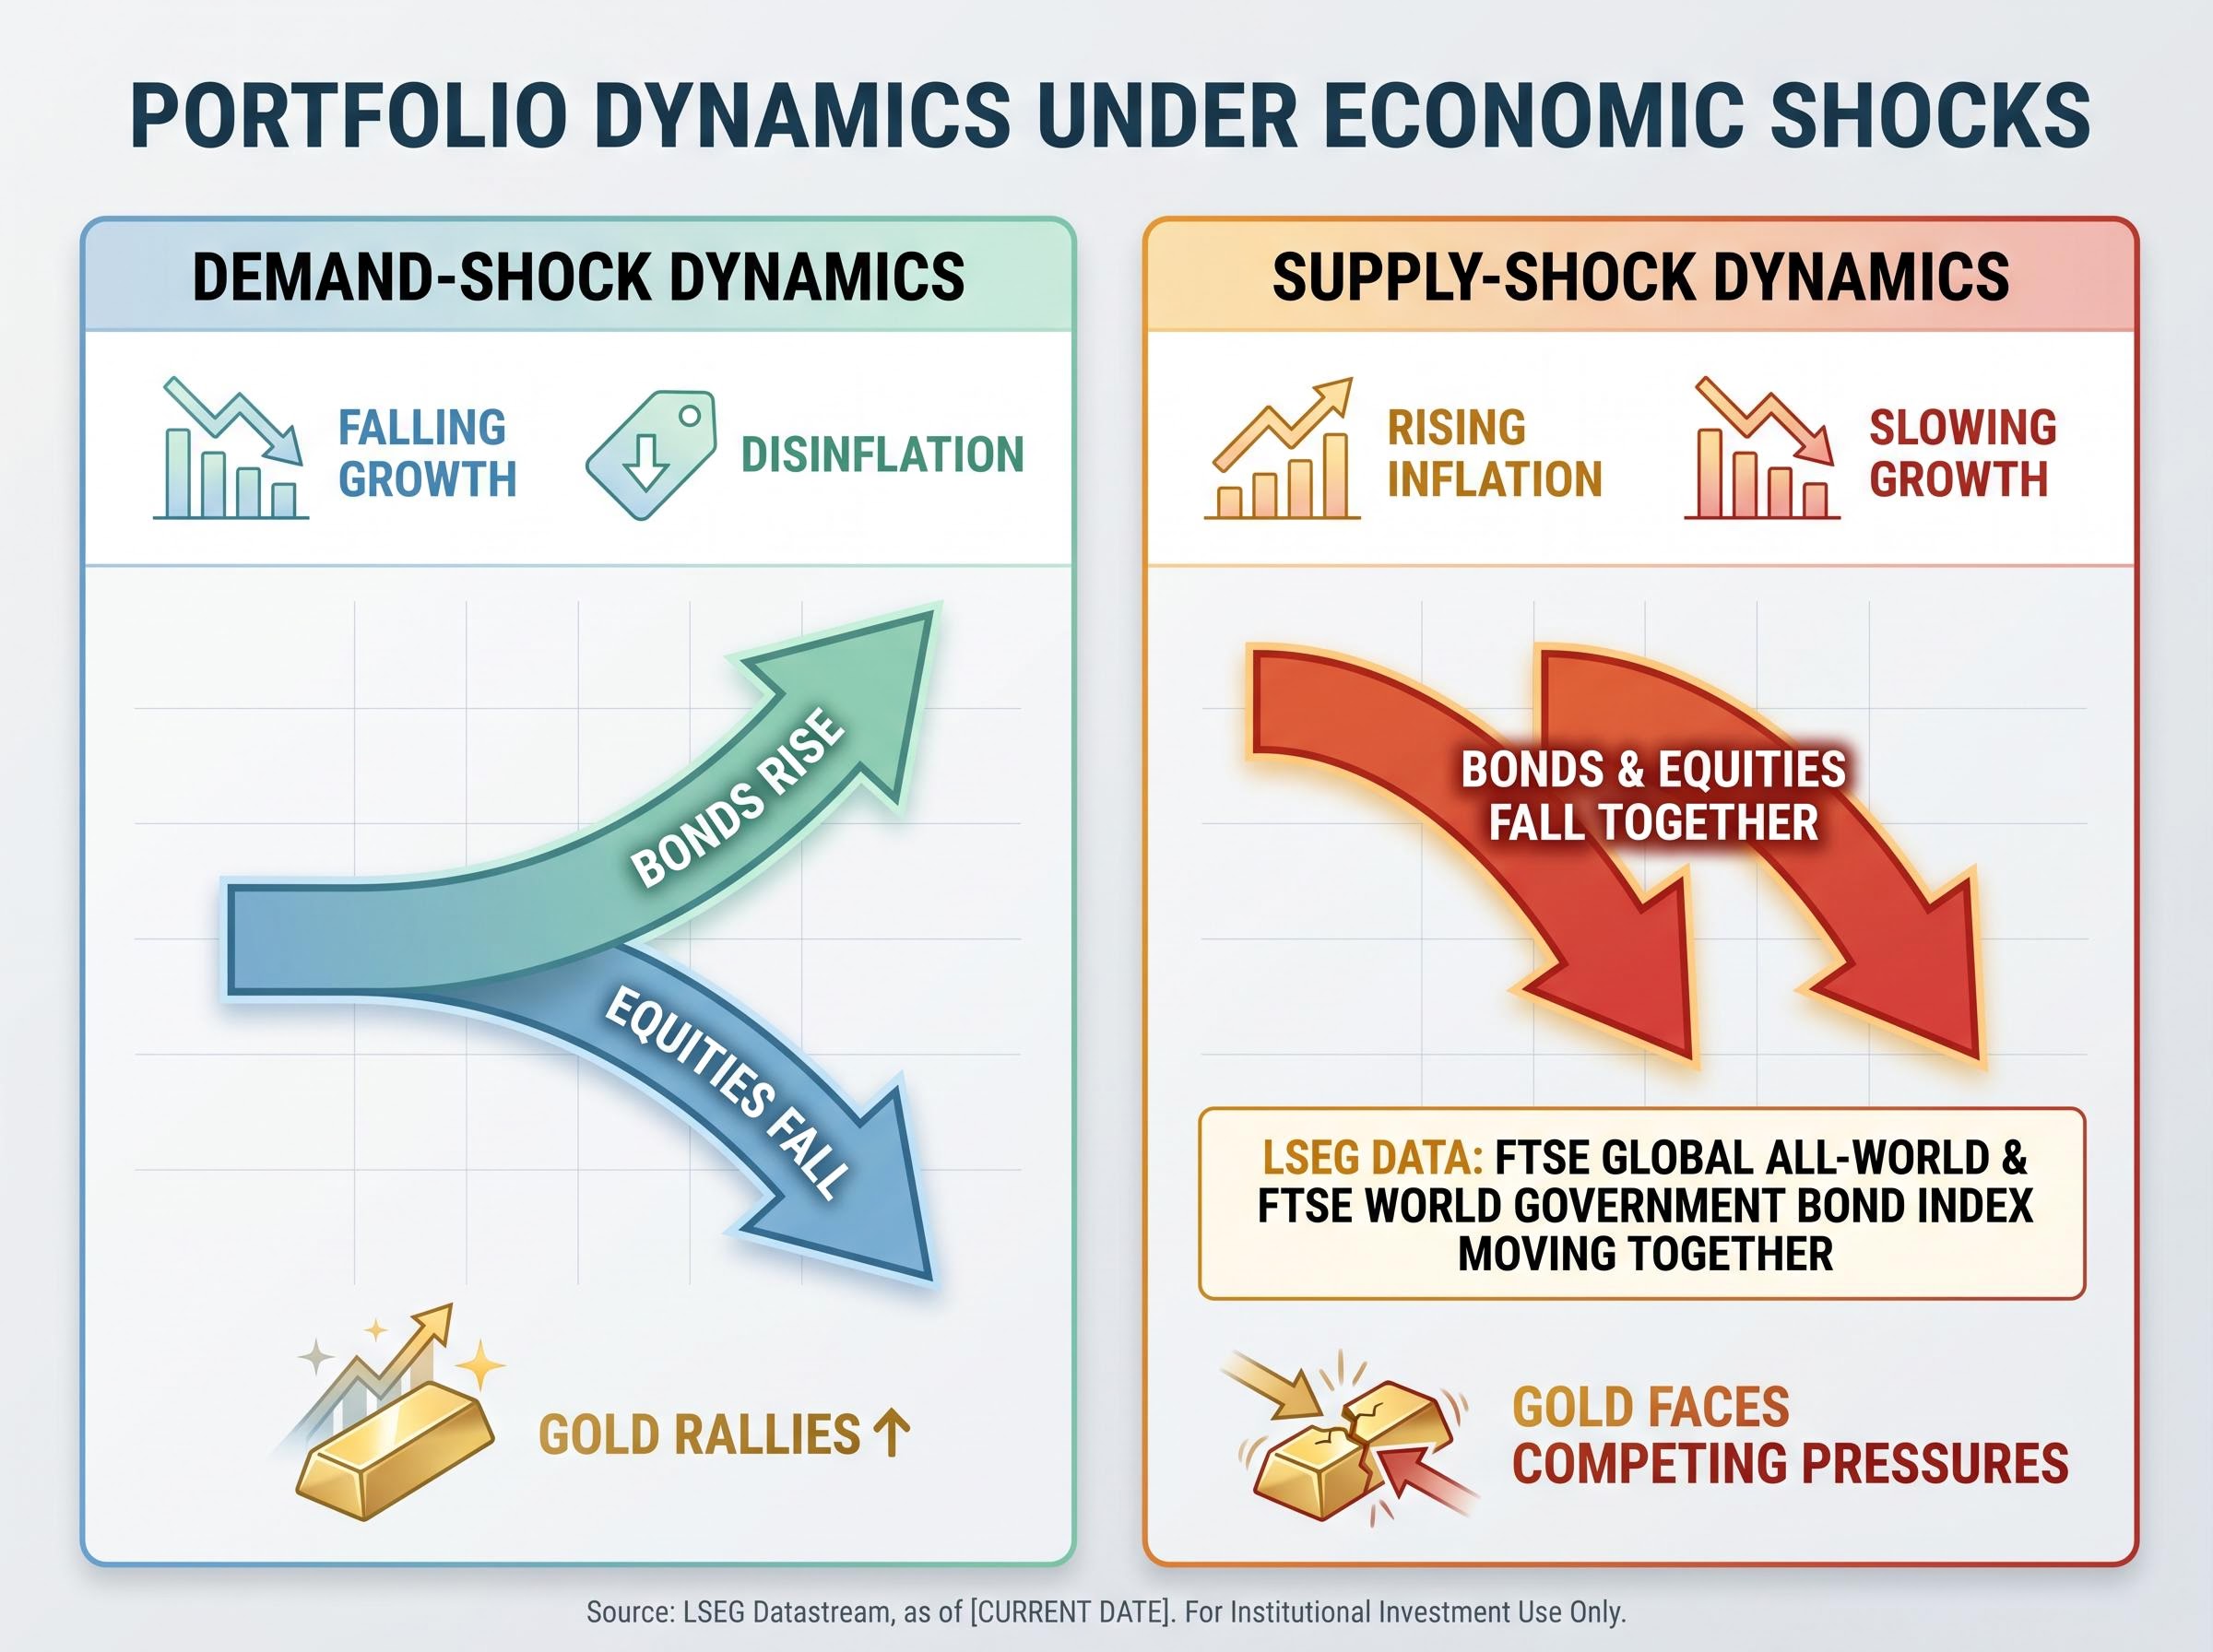
The safe haven consensus of the past forty years was built on demand-shock crises. In those episodes, falling economic growth caused disinflationary or deflationary pressure, pushing investors into bonds and gold simultaneously. Equities fell; bonds rose. The two legs of a diversified portfolio moved in opposite directions, and the model worked.
A supply-shock crisis reverses the mechanism. Energy costs force inflation higher while simultaneously crushing growth, a condition where equities and bonds move in the same direction rather than offsetting each other. LSEG correlation data has shown the FTSE Global All-World Index and FTSE World Government Bond Index moving together during supply-shock periods, destroying the diversification benefit investors assumed was structural.
The distinction between demand-shock and supply-shock crisis mechanics is the most important concept for Australian investors to internalise before repositioning: supply shock crisis mechanics force central banks to raise rates rather than cut them, eliminating the interest rate transmission channel that makes government bonds rise when equities fall.
The difference between the two crisis types is not subtle:
- Demand-shock dynamics: Falling growth, disinflationary pressure, bonds rise as equities fall, gold rallies on uncertainty, portfolio diversification works as designed.
- Supply-shock dynamics: Rising inflation, slowing growth, bonds and equities fall together, gold faces competing pressures from rates and dollar strength, diversification collapses.
The 2022 precedent investors largely ignored
This pattern appeared clearly during the 2022 Ukraine war energy shock, when bonds and equities declined simultaneously. That episode served as the warning sign. Most investors absorbed it intellectually but did not restructure their portfolios around it.
The current crisis is narrower in scope: it is energy-focused rather than compounded by supply chain breakdown and post-pandemic reopening pressures. But energy alone has proved sufficient to destroy the diversification model. Brent crude exceeded $125/bbl by 30 April 2026, up more than 40% from the March average of $103.1/bbl. The IEA’s characterisation of this as the largest supply disruption on record is not rhetorical. It is the operating environment.
When big ASX news breaks, our subscribers know first
How gold’s structural vulnerabilities turned a crisis asset into a liability
Gold opened March 2026 at approximately $5,321.10/oz and closed the month at $4,669.66/oz.
Steepest monthly gold decline in recent history: a 12.2% loss in a single month, reversing a significant portion of the gains accumulated across the preceding two years.
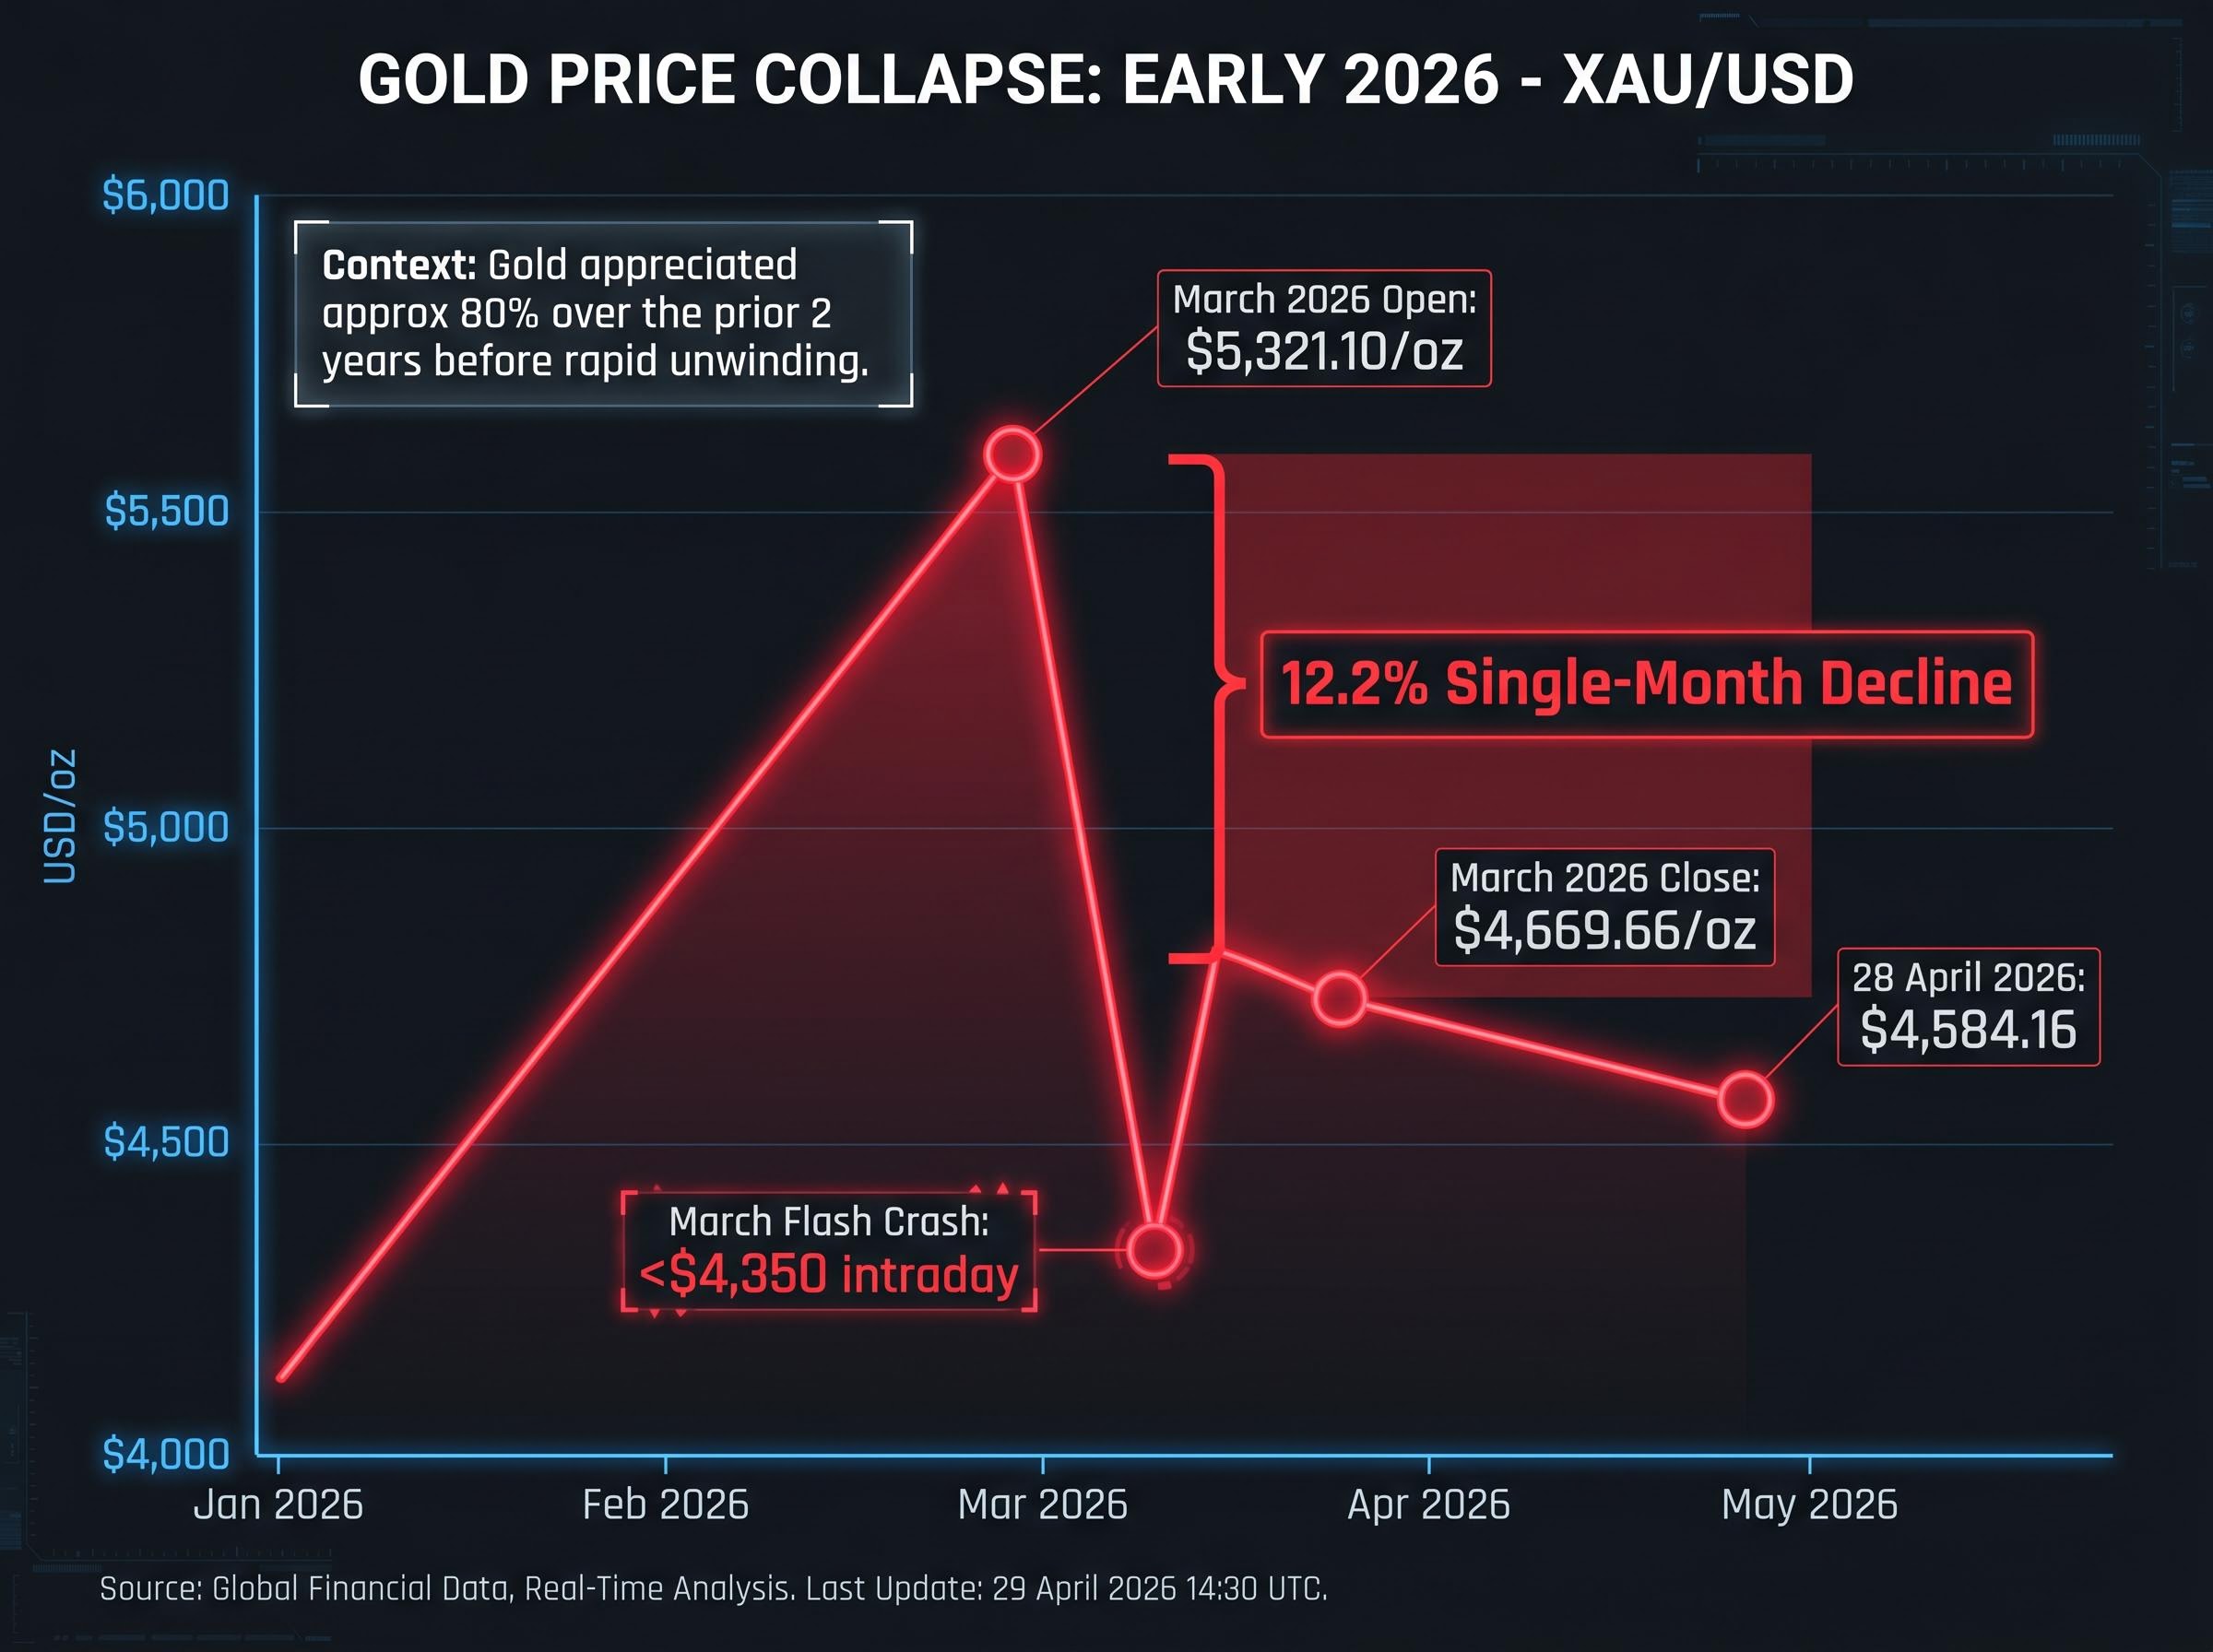
By 28 April 2026, spot gold sat at $4,584.16, down approximately 3% on that day alone. A flash crash during March took prices below $4,350 intraday. The decline that looked shocking in real time appears almost inevitable when examined through three structural vulnerabilities:
- Elevated interest rates made yield-free gold comparatively unattractive. With the US 10-year Treasury yielding above 4%, the opportunity cost of holding gold increased precisely when investors needed their crisis hedge most.
- A surging US dollar raised effective costs for international buyers, reducing demand at the moment it should have been surging.
- Forced selling by leveraged investors meeting margin calls in a broad liquidity crunch turned gold from a safe haven into a source of emergency cash. When multiple asset classes decline simultaneously, liquid positions are sold first.
The third vulnerability was amplified by a crowded-trade problem. Gold had appreciated approximately 80% over the two years preceding the conflict, concentrating it as a heavily held position across institutional and retail portfolios. That concentration made it uniquely vulnerable to rapid unwinding. For Australian investors holding gold exchange-traded funds (ETFs) as crisis insurance, the protection they expected was the first thing institutional traders sold to cover losses elsewhere.
Crowded-trade dynamics compounded the mechanical vulnerabilities: gold’s approximately 80% appreciation in the two years preceding the conflict concentrated the metal as a heavily held position across institutional and retail portfolios globally, and that concentration transformed the expected defensive asset into the most readily available source of emergency liquidity during the margin call cascade.
Why the Japanese yen failed and what energy dependency actually means for currency safety
Japan is a significant net oil importer. That single fact overrode every historical advantage the yen possessed: large trade surpluses, substantial overseas investment holdings, and the capital repatriation flows that typically channel money back to the currency during crises.
JPY weakened versus CHF by -2.56% year-to-date through 2026, with JPY/CHF hitting a low of approximately 0.00491061 on 23 April 2026. The yen’s failure was not an anomaly to be explained away. It was evidence of a new organising principle: a nation’s oil import or export status is now the primary determinant of its currency’s crisis resilience, displacing older metrics of political stability and current account position.
The displacement of traditional safe-haven and rate-differential frameworks by energy self-sufficiency in forex valuation is the most significant structural shift in currency markets since the Bretton Woods collapse, with USD/JPY reaching 160.395 on 29 April 2026 as Japan’s near-total import dependence and Bank of Japan policy paralysis left the yen absorbing the full cost of the supply shock.
Morningstar and Macrobond data from 17 March 2026 confirmed this reading: the Australian dollar (AUD) and Canadian dollar (CAD), both energy exporter currencies, outperformed net oil-importing peers during the crisis. The US dollar functioned as the one traditional safe haven currency that held, supported by American energy self-sufficiency and sustained high interest rate expectations.
| Currency | Energy Trade Status | Crisis Performance Direction |
|---|---|---|
| USD | Net energy exporter / self-sufficient | Strengthened (functioning safe haven) |
| JPY | Net oil importer | Weakened (safe haven status failed) |
| AUD | Net energy exporter | Recovered after initial dip |
| CHF | Net energy importer (European dependency) | Underperformed relative to expectations |
What this means for Australian investors hedging international positions
The AUD fell to a low of approximately US$0.6898 on 7 April before recovering approximately 4% to around US$0.718 by late April 2026, with year-end forecasts of US$0.71-0.72 reflecting energy exporter resilience. The Reserve Bank of Australia (RBA) added rate support with a 25 basis point hike to 4.10% on 17 March 2026, diverging from global central banks that have paused.
Australian investors holding unhedged international equities are partially insulated by default. The AUD’s relative strength during the crisis means currency hedging on international equity positions may be less urgent than it would be for investors in net oil-importing countries, potentially reducing unnecessary hedging costs.
Understanding stagflation risk: the macroeconomic environment that makes every safe haven harder to find
When oil trades above $125/bbl, it raises input costs across almost every sector, from transport to manufacturing to food production. Inflation pushes higher. Central banks cannot cut rates because consumer prices are already elevated. Growth slows under the weight of those higher costs. The economy lands in a condition of simultaneously low growth, high inflation, and elevated borrowing costs, the definition of stagflation and the worst environment for both the equities and fixed income legs of a standard portfolio.
Australia’s CPI reached 4.6%, driven by energy and imported goods price surges. The RBA raised its cash rate to 4.10% in March, with a further 25 basis point hike anticipated in May.
The RBA’s March 2026 monetary policy decision explicitly attributed the pickup in inflation to sharply higher fuel prices driven by Middle East conflict, placing Australia’s rate tightening cycle in direct causal relationship with the energy supply shock rather than domestic demand pressures.
The Australian Financial Review described the RBA as “going it alone on rates” relative to peers on 28 April 2026, highlighting the divergence from a US Federal Reserve expected to hold, with rate cuts pushed to late 2026 and markets pricing two cuts targeting 3.0-3.25%.
The 1970s parallel is inevitable, but the current version differs in ways that matter:
- Breadth of disruption: The 1970s saw economy-wide structural inflation across energy, wages, and supply chains simultaneously. The current crisis is concentrated in energy, with Dutch TTF gas at EUR 44.71/MWh on 29 April (down 18.72% over the preceding month), signalling that energy markets are not uniformly tightening.
- Starting rate level: Interest rates are already at levels where further hikes risk inducing recession before inflation is resolved, limiting central bank options in both directions.
- Policy response: Strategic reserve releases, pipeline bypass capacity, and targeted fiscal responses offer tools that were unavailable or untested in the 1970s.
Markets may be overpricing stagflation risk. As Investment Magazine noted in March 2026 (“Why Markets Won’t Go Back to Normal After Iran”), the disruption is likely prolonged but potentially narrower and more resolvable than the 1970s precedent suggests. Getting this assessment wrong, however, is the most expensive mistake an Australian investor can make right now.
What is actually protecting portfolios: the alternatives Australian investors are moving toward
The failure of traditional safe havens has forced institutional investors toward four distinct alternative categories:
- Infrastructure assets: Both BlackRock and JPMorgan are directing clients toward infrastructure as a resilient asset class in prolonged supply disruptions. Australian pension funds are actively building broader hedge ratios across asset classes rather than relying on single safe haven positions, according to reporting from 23 April 2026.
- Short-duration fixed income: While bonds broadly remain under pressure, the coupon component provides stability that pure price analysis misses. Short-dated instruments, including cash ETFs and floating rate bond ETFs, are outperforming. Betashares AAA (Australian High Interest Cash ETF), iShares BILL (Core Cash ETF), and Betashares QPON (Australian Bank Senior Floating Rate Bond ETF) offer Australian investors exposure to this segment.
- Energy sector exposure: Direct exposure to ASX-listed energy companies and energy ETFs functions as both a hedge and a return opportunity, given sustained prices above $125/bbl. JPMorgan recommends selective energy positioning within volatility-aware strategies.
- REITs: Investor Daily highlighted real estate investment trusts as portfolio stabilisers amid Iran conflict volatility, though interest rate sensitivity remains a risk factor given the RBA’s tightening stance.
| Alternative Asset | Rationale | Key Risk |
|---|---|---|
| Infrastructure | Resilient cash flows; institutional backing from BlackRock and JPMorgan | Illiquidity; long capital commitment periods |
| Short-duration fixed income | Coupon stability; reduced interest rate sensitivity | Returns lag inflation in prolonged stagflation |
| Energy sector exposure | Direct hedge against elevated oil and LNG prices | Sharp reversal if conflict resolves quickly |
| REITs | Portfolio stabilisation; income generation | Interest rate sensitivity during RBA tightening cycle |
Broad developed market equity exposure through instruments such as Vanguard VBND (Global Aggregate Bond Index Hedged ETF) and Vanguard VGS (for international equities) provides diversification building blocks for investors restructuring around the new environment.
The portfolio restructuring question investors need to answer before the conflict resolves
The question is not whether traditional safe havens have failed. They have. The question is whether that failure is permanent or situational, and the answer determines whether portfolio restructuring should be deep and lasting or tactical and reversible.
The recovery scenario deserves honest consideration. Historically, rate-sensitive assets have experienced rapid recoveries once a pathway toward conflict resolution becomes visible. Gold’s 80% rally over the two years prior to the crisis demonstrated how quickly the metal can reprice in either direction. Morgan Stanley has flagged prolonged Iran conflict risks to oil prices, inflation, and broader markets, but markets have also shown a tendency to front-run resolution before it arrives.
Four calibrated moves for Australian investors right now
Rather than wholesale repositioning, a calibrated response manages the genuine uncertainty:
- Maintain an adequate cash buffer using instruments such as Betashares AAA or iShares BILL, preserving optionality for redeployment once clarity improves.
- Consider short-duration fixed income through floating rate or cash-equivalent ETFs (such as Betashares QPON) that offer yield with minimal interest rate risk.
- Evaluate selective energy sector exposure for portfolios that currently have none, given the structural tailwind from sustained high oil and LNG prices.
- Review quality equity allocations using factor-based options such as Betashares AQLT or Betashares QLTY, which target earnings stability during periods of volatility. Dollar-cost averaging into these positions rather than lump-sum repositioning reduces timing risk during unresolved geopolitical uncertainty.
An investor whose current allocation was designed for a demand-shock world has a structural mismatch that this crisis has exposed. That mismatch does not disappear when the Hormuz closure eventually ends.
For investors wanting to move from the calibrated response framework outlined above to a full implementation plan, our full explainer on systematic investing strategies for 2026 covers dollar-cost averaging mechanics, ETF platform selection, and the capital rotation patterns that Australian investors are actually executing right now, including $6.9 billion of inflows into global equity ETFs in Q1 2026.
This article is for informational purposes only and should not be considered financial advice. Investors should conduct their own research and consult with financial professionals before making investment decisions. Past performance does not guarantee future results. Financial projections are subject to market conditions and various risk factors.