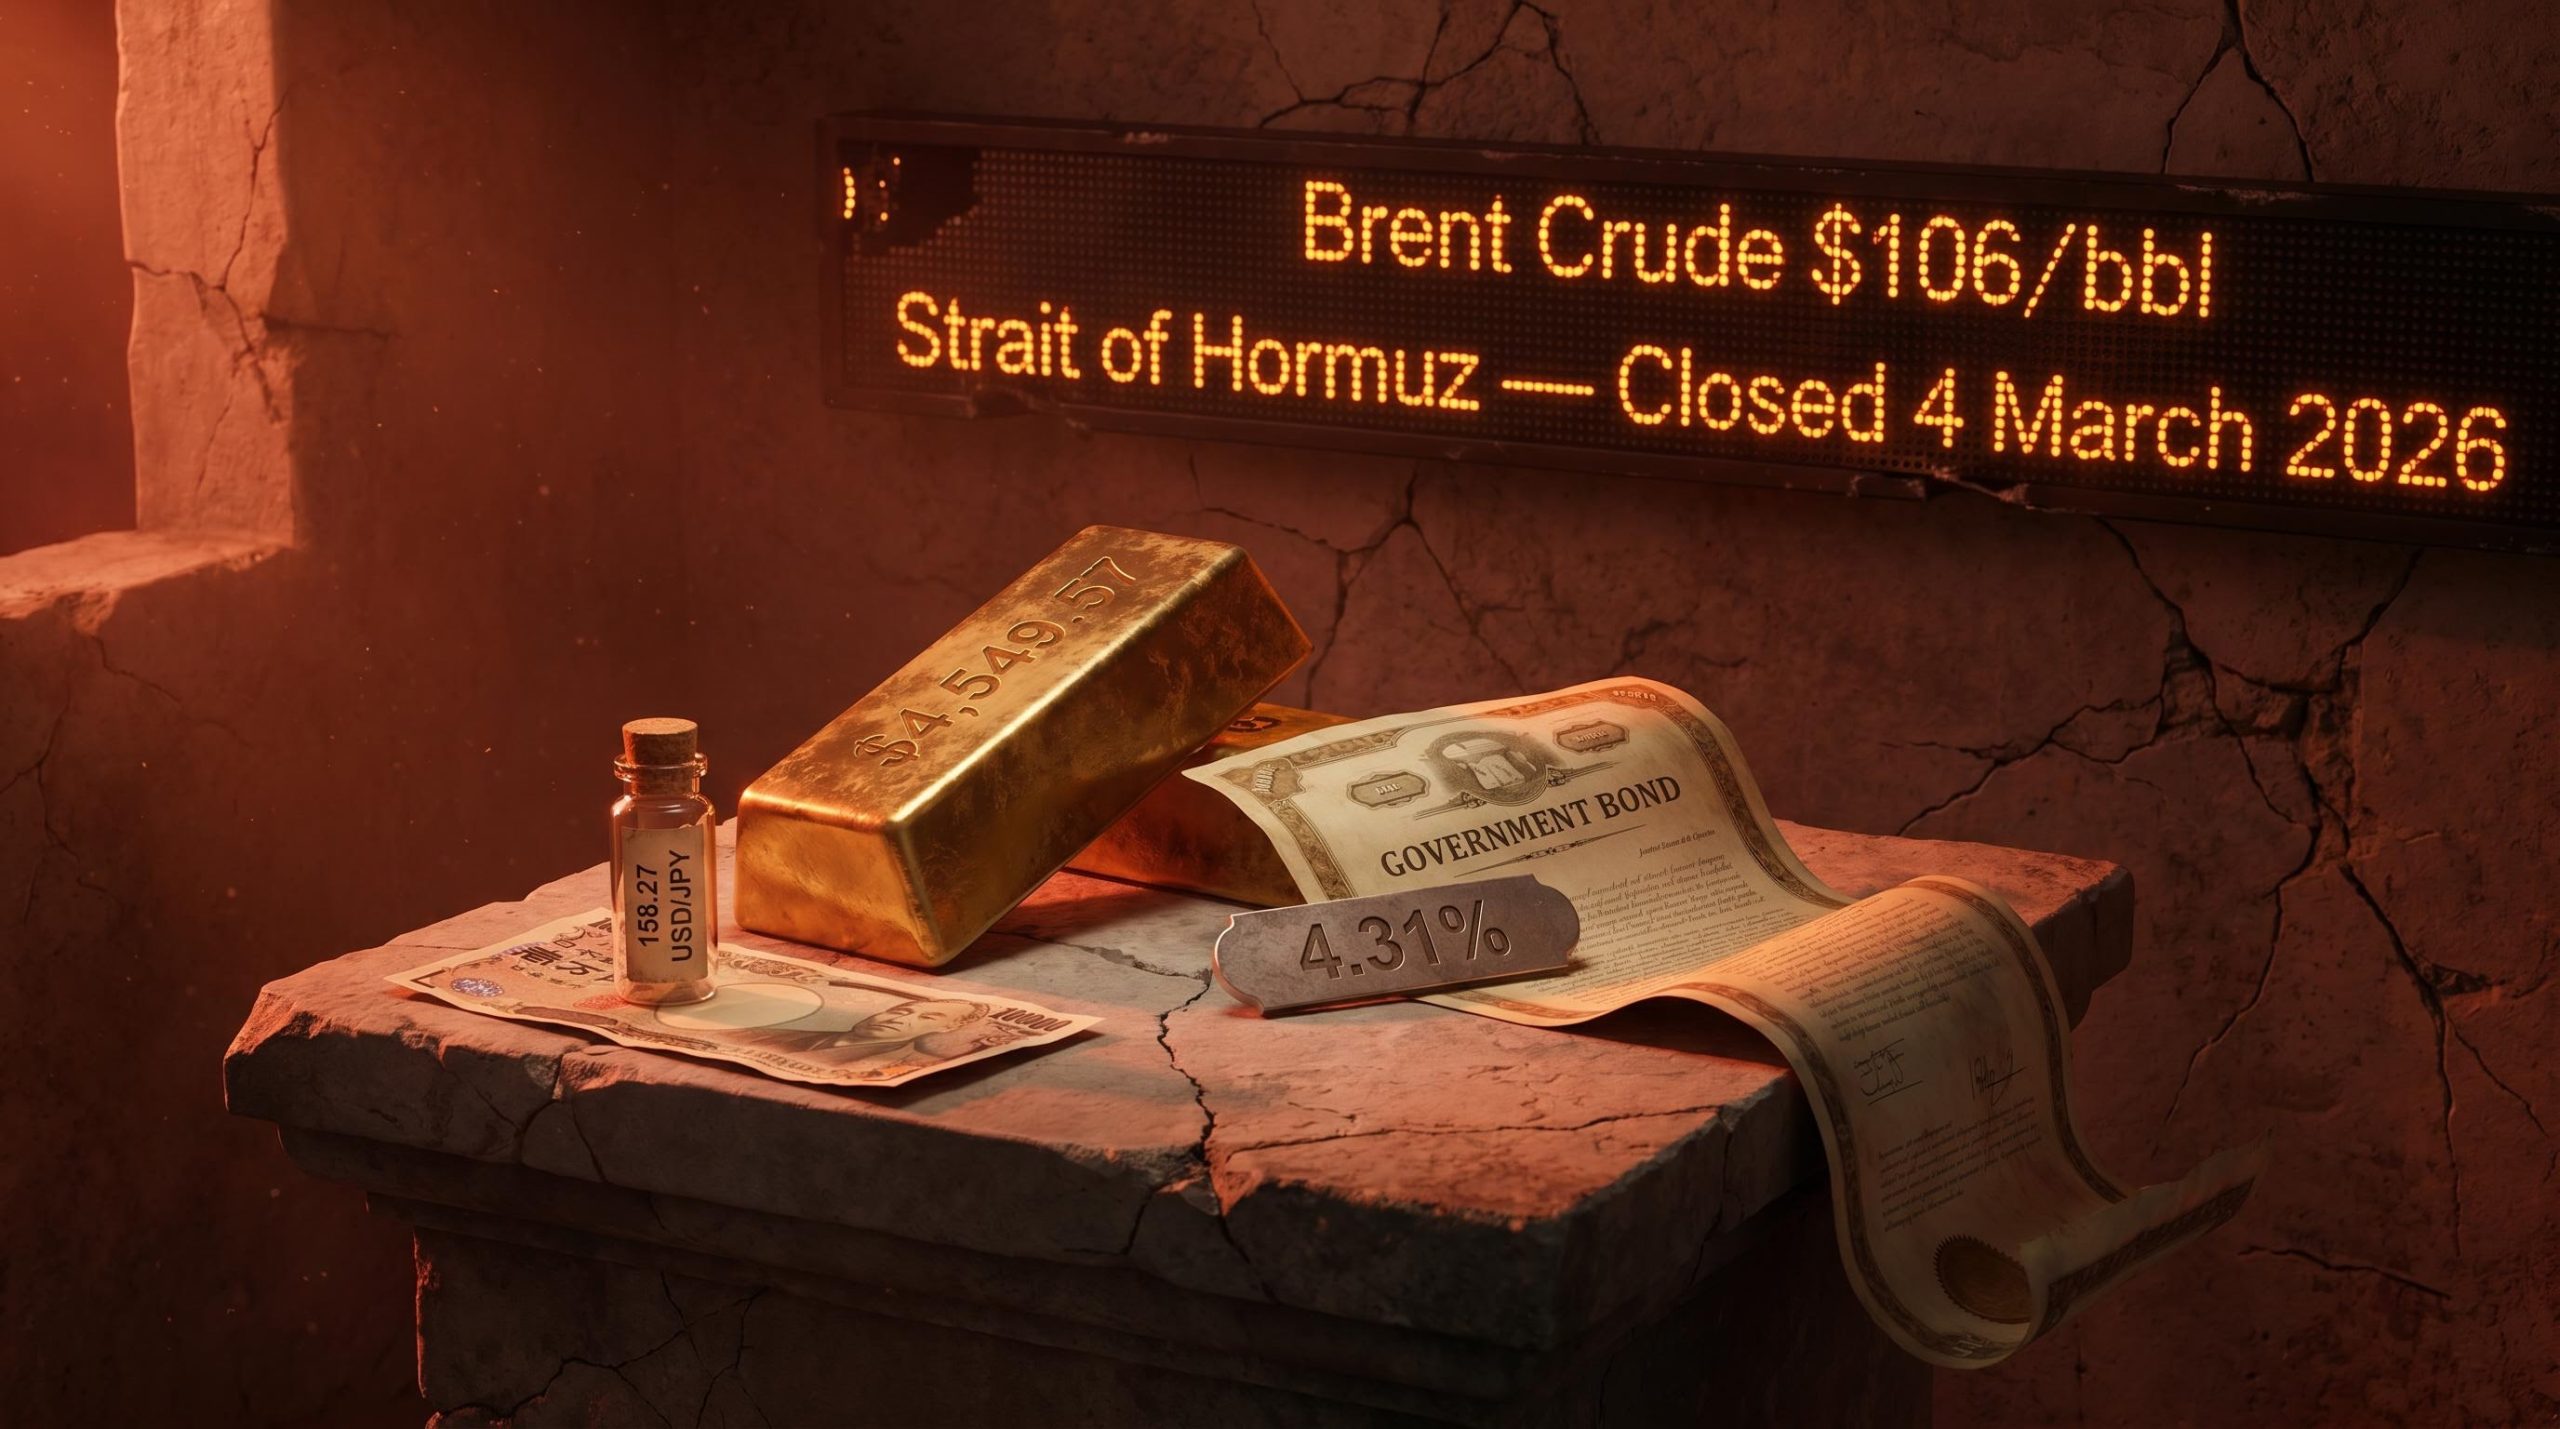
The assets Australian investors were told would protect them during a crisis are failing at the same time as everything else. Gold has fallen more than 12% since the start of March. Government bond prices are dropping. The Japanese yen, long considered the currency of last resort, is weakening against the US dollar. The cause is the same event driving the broader market sell-off: the Iran War and the closure of the Strait of Hormuz, which the International Energy Agency (IEA) has called the largest oil supply disruption in recorded history. With Brent crude trading above $106 a barrel and the strait closed since 4 March 2026, the three pillars of conventional crisis defence are declining simultaneously. This piece explains why those assets are failing, what structural feature of this crisis breaks their usual protective logic, and what has actually worked instead. Readers will leave with a clear mental model for evaluating safe haven assets under supply-shock conditions, not just demand-collapse crises.
What a safe haven asset is actually supposed to do
A safe haven asset is defined by what it does when everything else is falling. In functional terms, it is an asset that retains or increases in value during periods of broad market stress. Three characteristics typically distinguish these assets:
- High liquidity: they can be bought and sold in large volumes without significantly moving the price
- Value retention during downturns: they hold their price or appreciate when equities and other risk assets decline
- Ties to politically stable economies or stores of value: they are anchored to institutions, currencies, or commodities that investors trust in periods of uncertainty
The implicit assumption most investors carry is straightforward: if a crisis is severe enough, these assets should perform. The Iran War represents the largest oil supply disruption ever recorded, with the Strait of Hormuz, which normally facilitates roughly 20% of global oil and liquefied natural gas (LNG) supply, closed for nearly two months. By that logic, safe havens should be surging. They are not.
The IEA key facts on the Strait of Hormuz confirm that approximately 25% of global oil supply and 19% of global LNG transits the waterway, figures that underscore why the closure constitutes a supply disruption with no historical precedent in scale or market impact.
When the playbook worked: GFC, COVID-19, and Ukraine
The playbook has worked before. US Treasuries appreciated sharply at the onset of both the Global Financial Crisis (GFC) in 2008 and the COVID-19 pandemic in 2020, as investors fled risk assets and central banks slashed interest rates to support collapsing demand. Gold rallied approximately 47% from March 2025 to March 2026 in a multi-year climb partly triggered by the uncertainty around the Russia-Ukraine conflict, and the Swiss franc strengthened against the euro when that war began.
Each of those crises shared a common feature: they were demand collapses. Economic activity contracted, inflation fell or stayed contained, and central banks had room to ease policy. That distinction matters more than most investors realise.
When big ASX news breaks, our subscribers know first
Why supply shocks break the rules that demand collapses follow
The Iran War is not a demand collapse. It is a supply shock, and the difference between the two determines whether conventional safe havens work or fail.
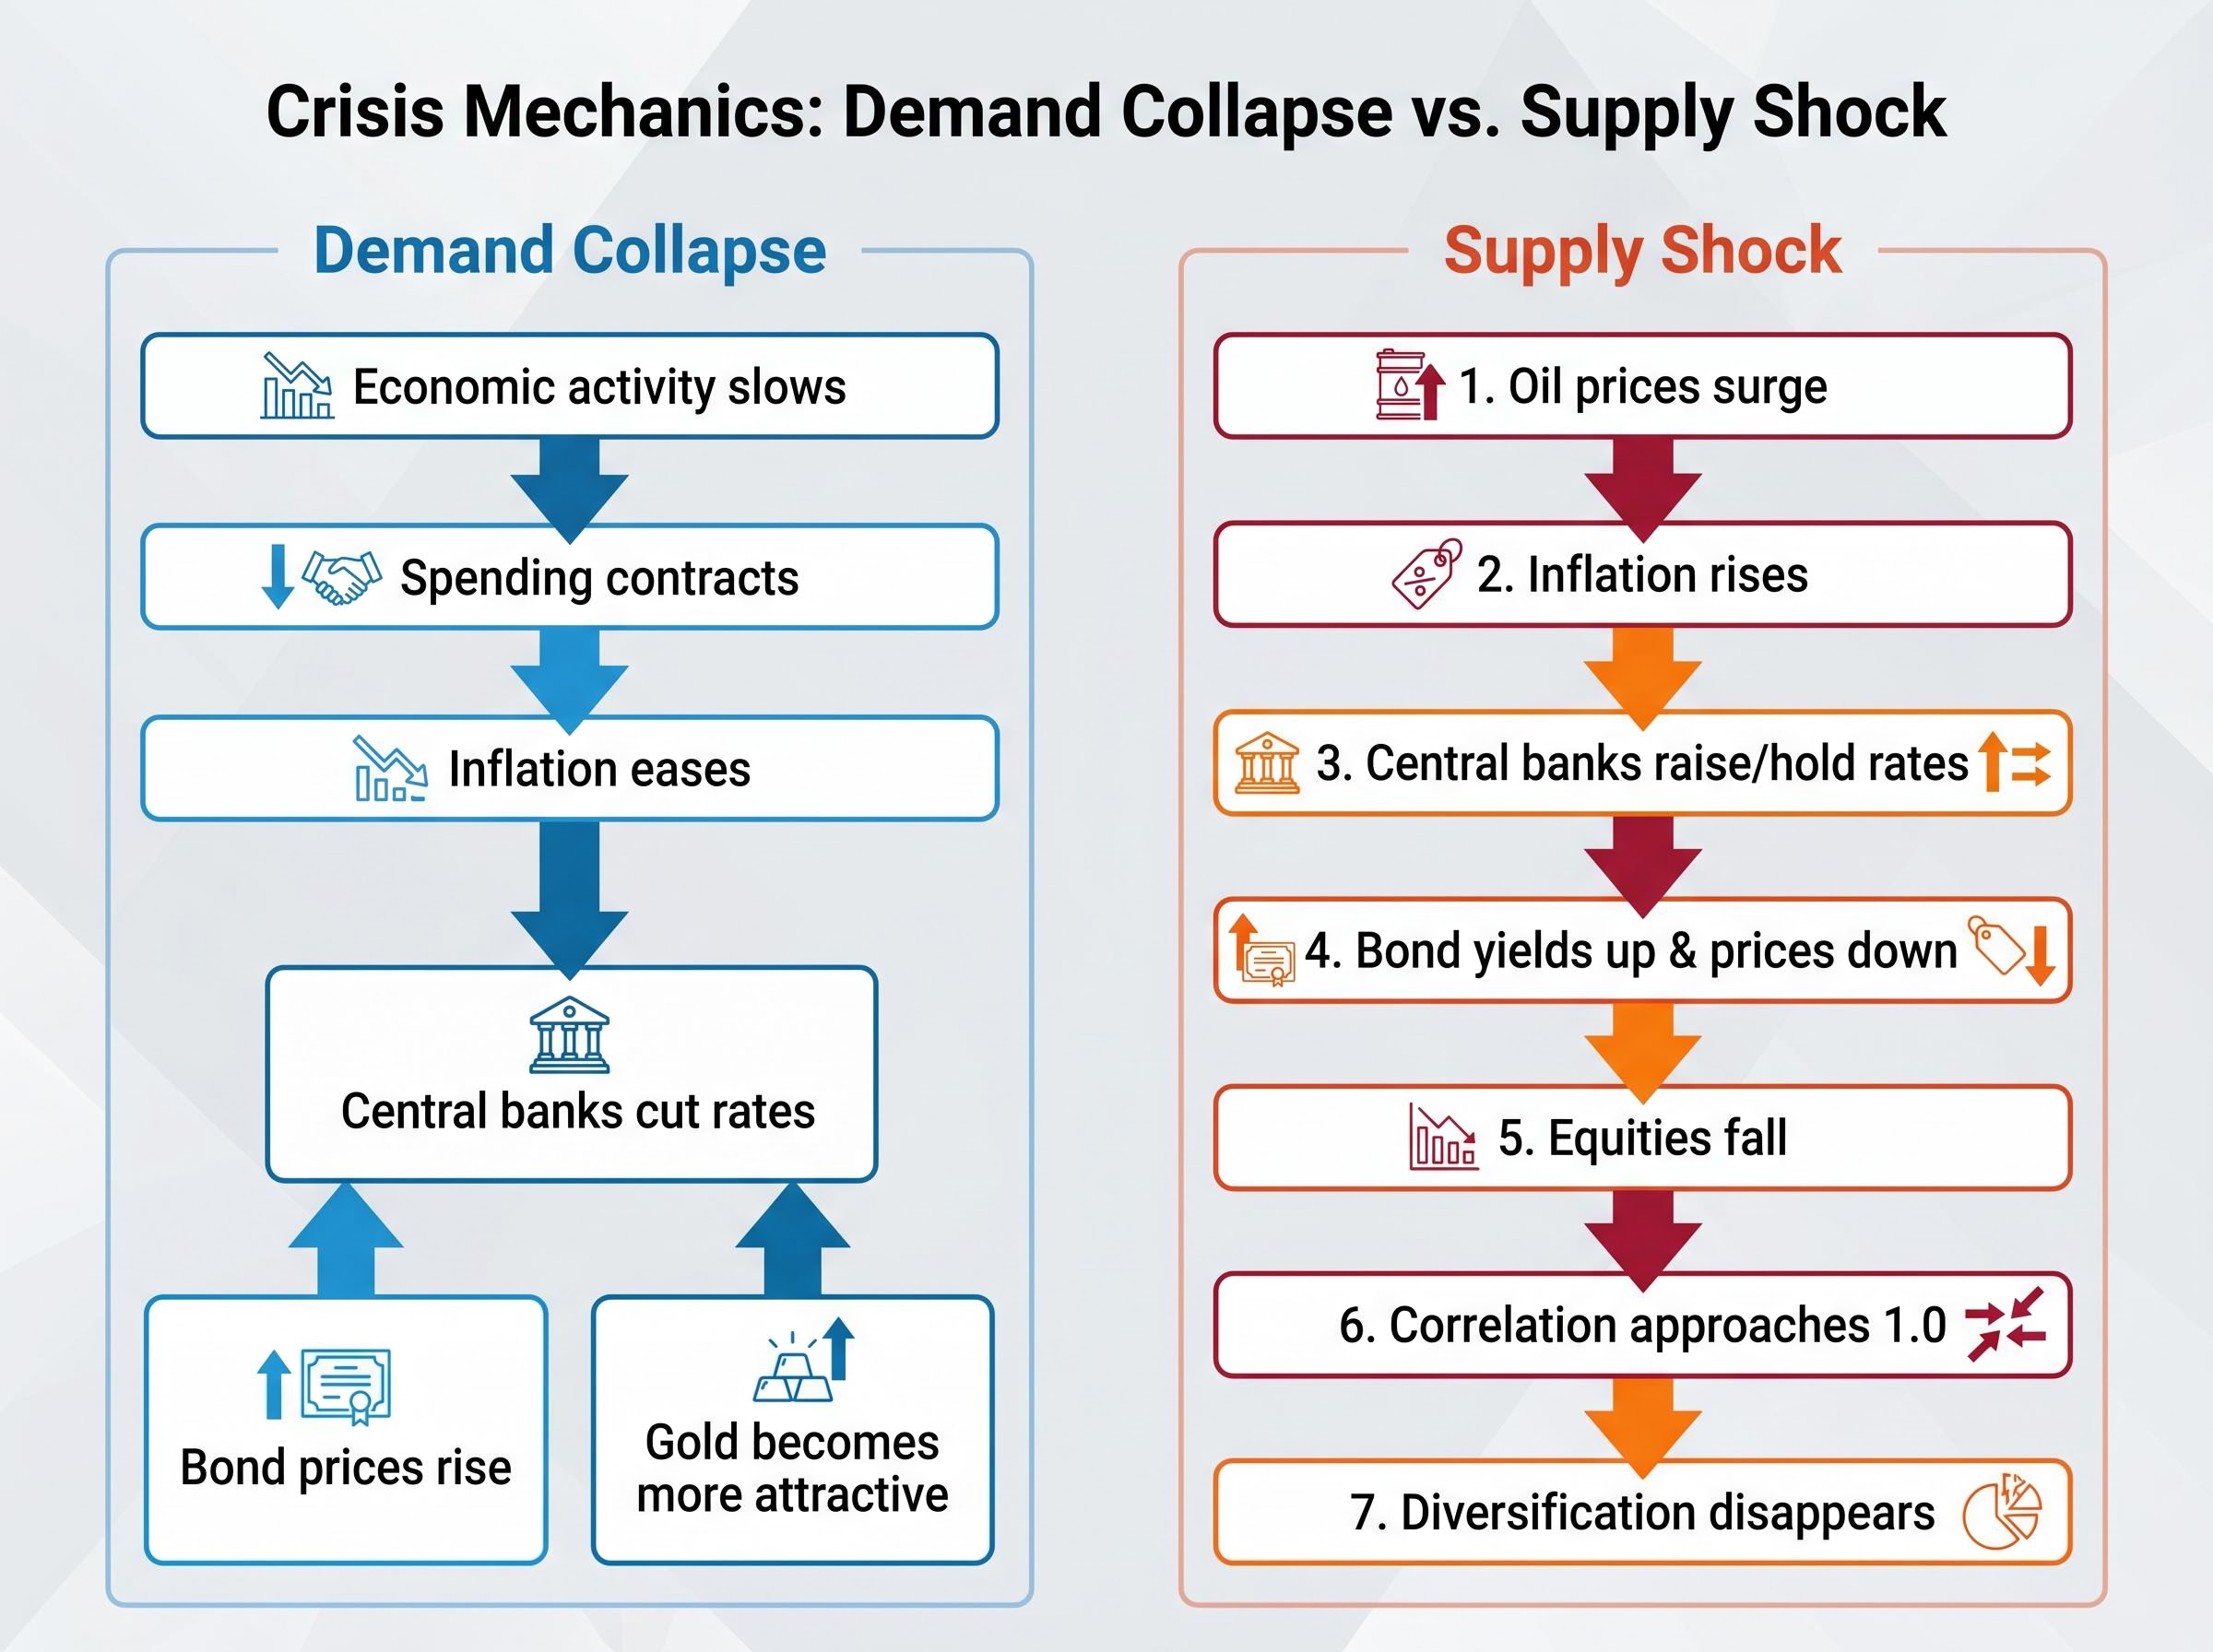
In a demand-collapse crisis, economic activity slows, spending contracts, and inflationary pressure eases. Central banks respond by cutting interest rates, which pushes bond prices up and makes low-yielding assets like gold more attractive relative to cash. Bonds rally. Gold rallies. The safe haven framework holds.
A supply shock reverses that entire sequence. The transmission chain runs as follows:
- Oil prices surge due to physical supply disruption
- Inflation rises as energy costs feed through to goods and services
- Central banks are forced to raise or hold rates to contain inflation, even as growth weakens
- Higher rates push bond yields up and bond prices down
- Equities also fall as higher energy costs compress corporate margins
- Both bonds and equities decline simultaneously, and the correlation between the two approaches 1.0
- The diversification benefit that bonds are supposed to provide disappears entirely
BIS research on equity-bond correlation documents how the relationship between the two asset classes shifts from negative to positive during periods of elevated and persistent inflation, a regime change that directly undermines the diversification logic most multi-asset portfolios are built around.
The IEA has characterised the Strait of Hormuz closure as the largest oil supply disruption in recorded history.
This is the mechanism playing out in real time. The Reserve Bank of Australia (RBA) has lifted the cash rate to 4.1%, with Westpac forecasting further hikes to 4.35% or higher. The 10-year US Treasury yield stood at 4.31% as of 24 April 2026. According to LSEG data, the return correlation between global equities and government bonds has converged during the stress period, meaning both asset classes are moving in the same direction. The Bloomberg Multiverse global government bond index is reportedly down approximately 14% over five years since the Russia-Ukraine invasion in 2022, reflecting sustained bond weakness in an era of persistent inflation.
The 1970s comparison: useful analogy, important limits
Analysts have drawn parallels to the 1970s oil crises, and the comparison is instructive to a point. Both eras feature supply-driven inflation, a central bank policy dilemma between fighting inflation and supporting growth, and simultaneous weakness across traditional safe haven asset classes.
The difference is structural. US shale production partially insulates the American economy from the current shock in a way that was not available in the 1970s. That asymmetry shapes everything from currency movements to relative equity performance, and it explains why the US dollar is behaving differently from every other supposed safe haven.
Gold, bonds, and the yen: what each one is doing and why
The failure of conventional safe havens is not confined to one asset class. Gold, government bonds, and the Japanese yen are all underperforming, and each for a distinct but related reason. Taken together, they illustrate how thoroughly the supply-shock environment has dismantled the standard crisis playbook.
The correlation breakdown across asset classes during energy shocks follows a consistent pattern: gold retreats as institutional investors liquidate to cover margin calls, government bonds reprice on inflation expectations rather than flight-to-safety demand, and the conventional diversification benefit that portfolios rely on disappears precisely when it is most needed.
Gold opened March 2026 at approximately $5,321.10 and closed the month at approximately $4,669.66, a decline of roughly 12.2%. As of 29 April 2026, the spot price sits at approximately $4,549.57, with no meaningful recovery established. Three headwinds are working simultaneously:
- A stronger US dollar raises the effective cost of gold for non-US buyers, suppressing demand
- Rising yields increase the opportunity cost of holding a non-income-producing asset; with the 10-year US Treasury yielding 4.31%, cash and bonds offer a return gold cannot match
- Margin-call forced selling has compounded the decline, as gold was a heavily crowded trade before the conflict, and leveraged investors were forced to liquidate positions to cover losses elsewhere
Government bonds are caught in the inverse relationship between yields and prices. When inflation expectations rise, yields climb to compensate investors for the erosion of future purchasing power. Higher yields mean lower prices for existing bonds. In the current environment, markets also anticipate heavy government borrowing if the conflict proves prolonged, adding a supply-side headwind to longer-dated bonds.
The strategic choice between gold versus sovereign bonds as a capital preservation instrument during supply shocks is not symmetrical: gold carries zero yield and faces dollar headwinds, while high-coupon sovereign bonds provide income that partially offsets capital mark-to-market losses, a distinction that shapes which instrument is less damaging to hold even when both are declining.
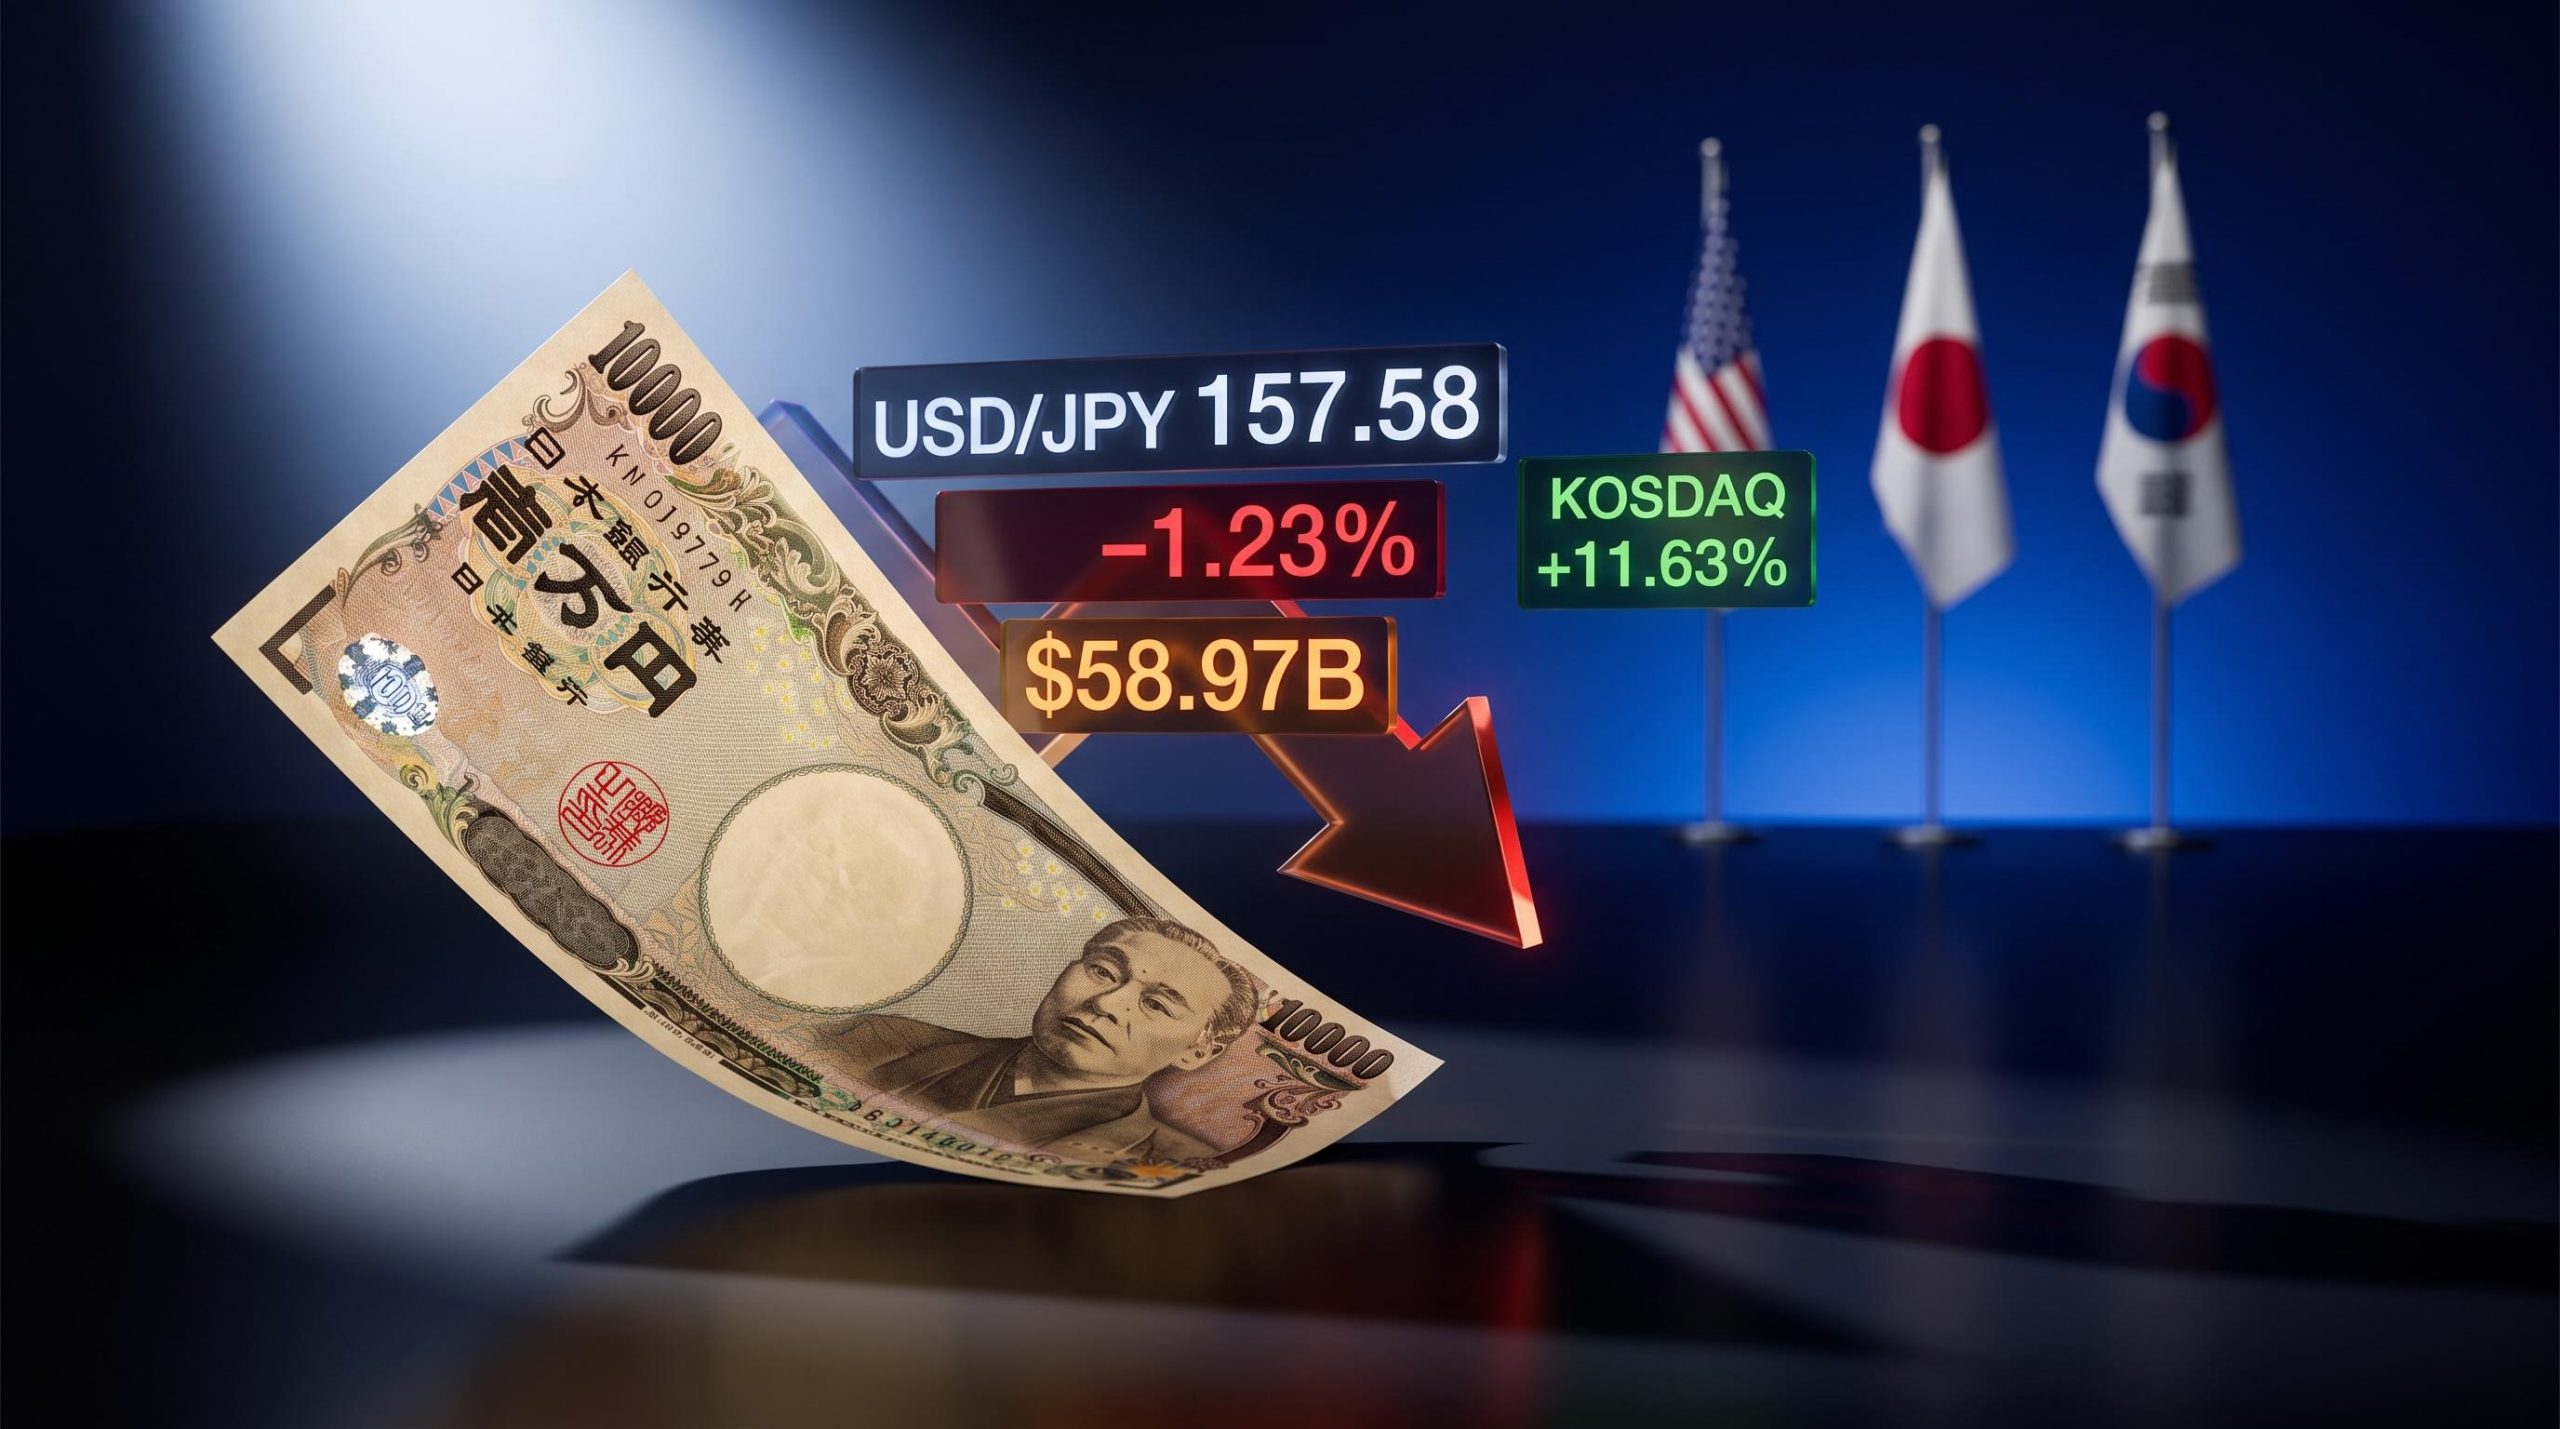
The Japanese yen has weakened to approximately 158.27 against the US dollar in late April, with analyst forecasts pointing toward 160 or beyond by year-end. Japan imports nearly all of its oil. In a supply-shock crisis, that dependency transforms the yen from a haven into a liability: the trade deficit widens, capital flows out, and delayed Bank of Japan rate hikes offer no counterweight.
| Asset | Expected behaviour in crisis | Actual behaviour (April 2026) | Primary reason for failure |
|---|---|---|---|
| Gold | Appreciates as investors seek store of value | Down ~12.2% in March; continued weakness to ~$4,549.57 | Dollar strength, yield opportunity cost, forced selling |
| Government bonds | Prices rise as yields fall during rate cuts | Prices falling; 10-year US Treasury yield at 4.31% | Inflation-driven rate hikes push yields up and prices down |
| Japanese yen | Strengthens as capital flows to perceived safety | Weakened to ~158.27 USD/JPY | Oil import dependency widens trade deficit; BoJ policy lag |
The US dollar and the logic of energy independence
If conventional safe havens have failed, the US dollar has not. Its resilience stems from a single structural advantage: US shale production means the American economy is partially insulated from the oil supply disruption that is hammering oil-importing nations.
This asymmetry is the central driver. While Japan, South Korea, and much of Europe face surging energy import bills and widening trade deficits, the US produces enough oil domestically to cushion the blow. Markets have repriced toward a prolonged period of elevated US interest rates, which draws capital flows into dollar-denominated assets and further supports the currency. The USD/JPY rate at approximately 158.27 illustrates the scale of the divergence between the dollar and a traditional haven currency.
Currency movements during this crisis are being interpreted through a single lens: energy dependency. Oil importers weaken; oil exporters or energy-independent economies hold up. This framework, visible in Morningstar and Macrobond currency data from 17 March 2026, is the primary driver of foreign exchange positioning.
Foreign exchange markets have effectively repriced currencies according to energy export capacity, with the split between oil-exporting and oil-importing nations becoming the dominant factor in bilateral currency movements, superseding interest rate differentials and traditional current account frameworks that previously governed most institutional FX positioning.
The pattern divides currencies into two camps:
- Energy-independent or exporting economies: the US dollar, Australian dollar, and Canadian dollar have held up or strengthened
- Energy-importing economies: the Japanese yen and currencies of oil-dependent nations have weakened
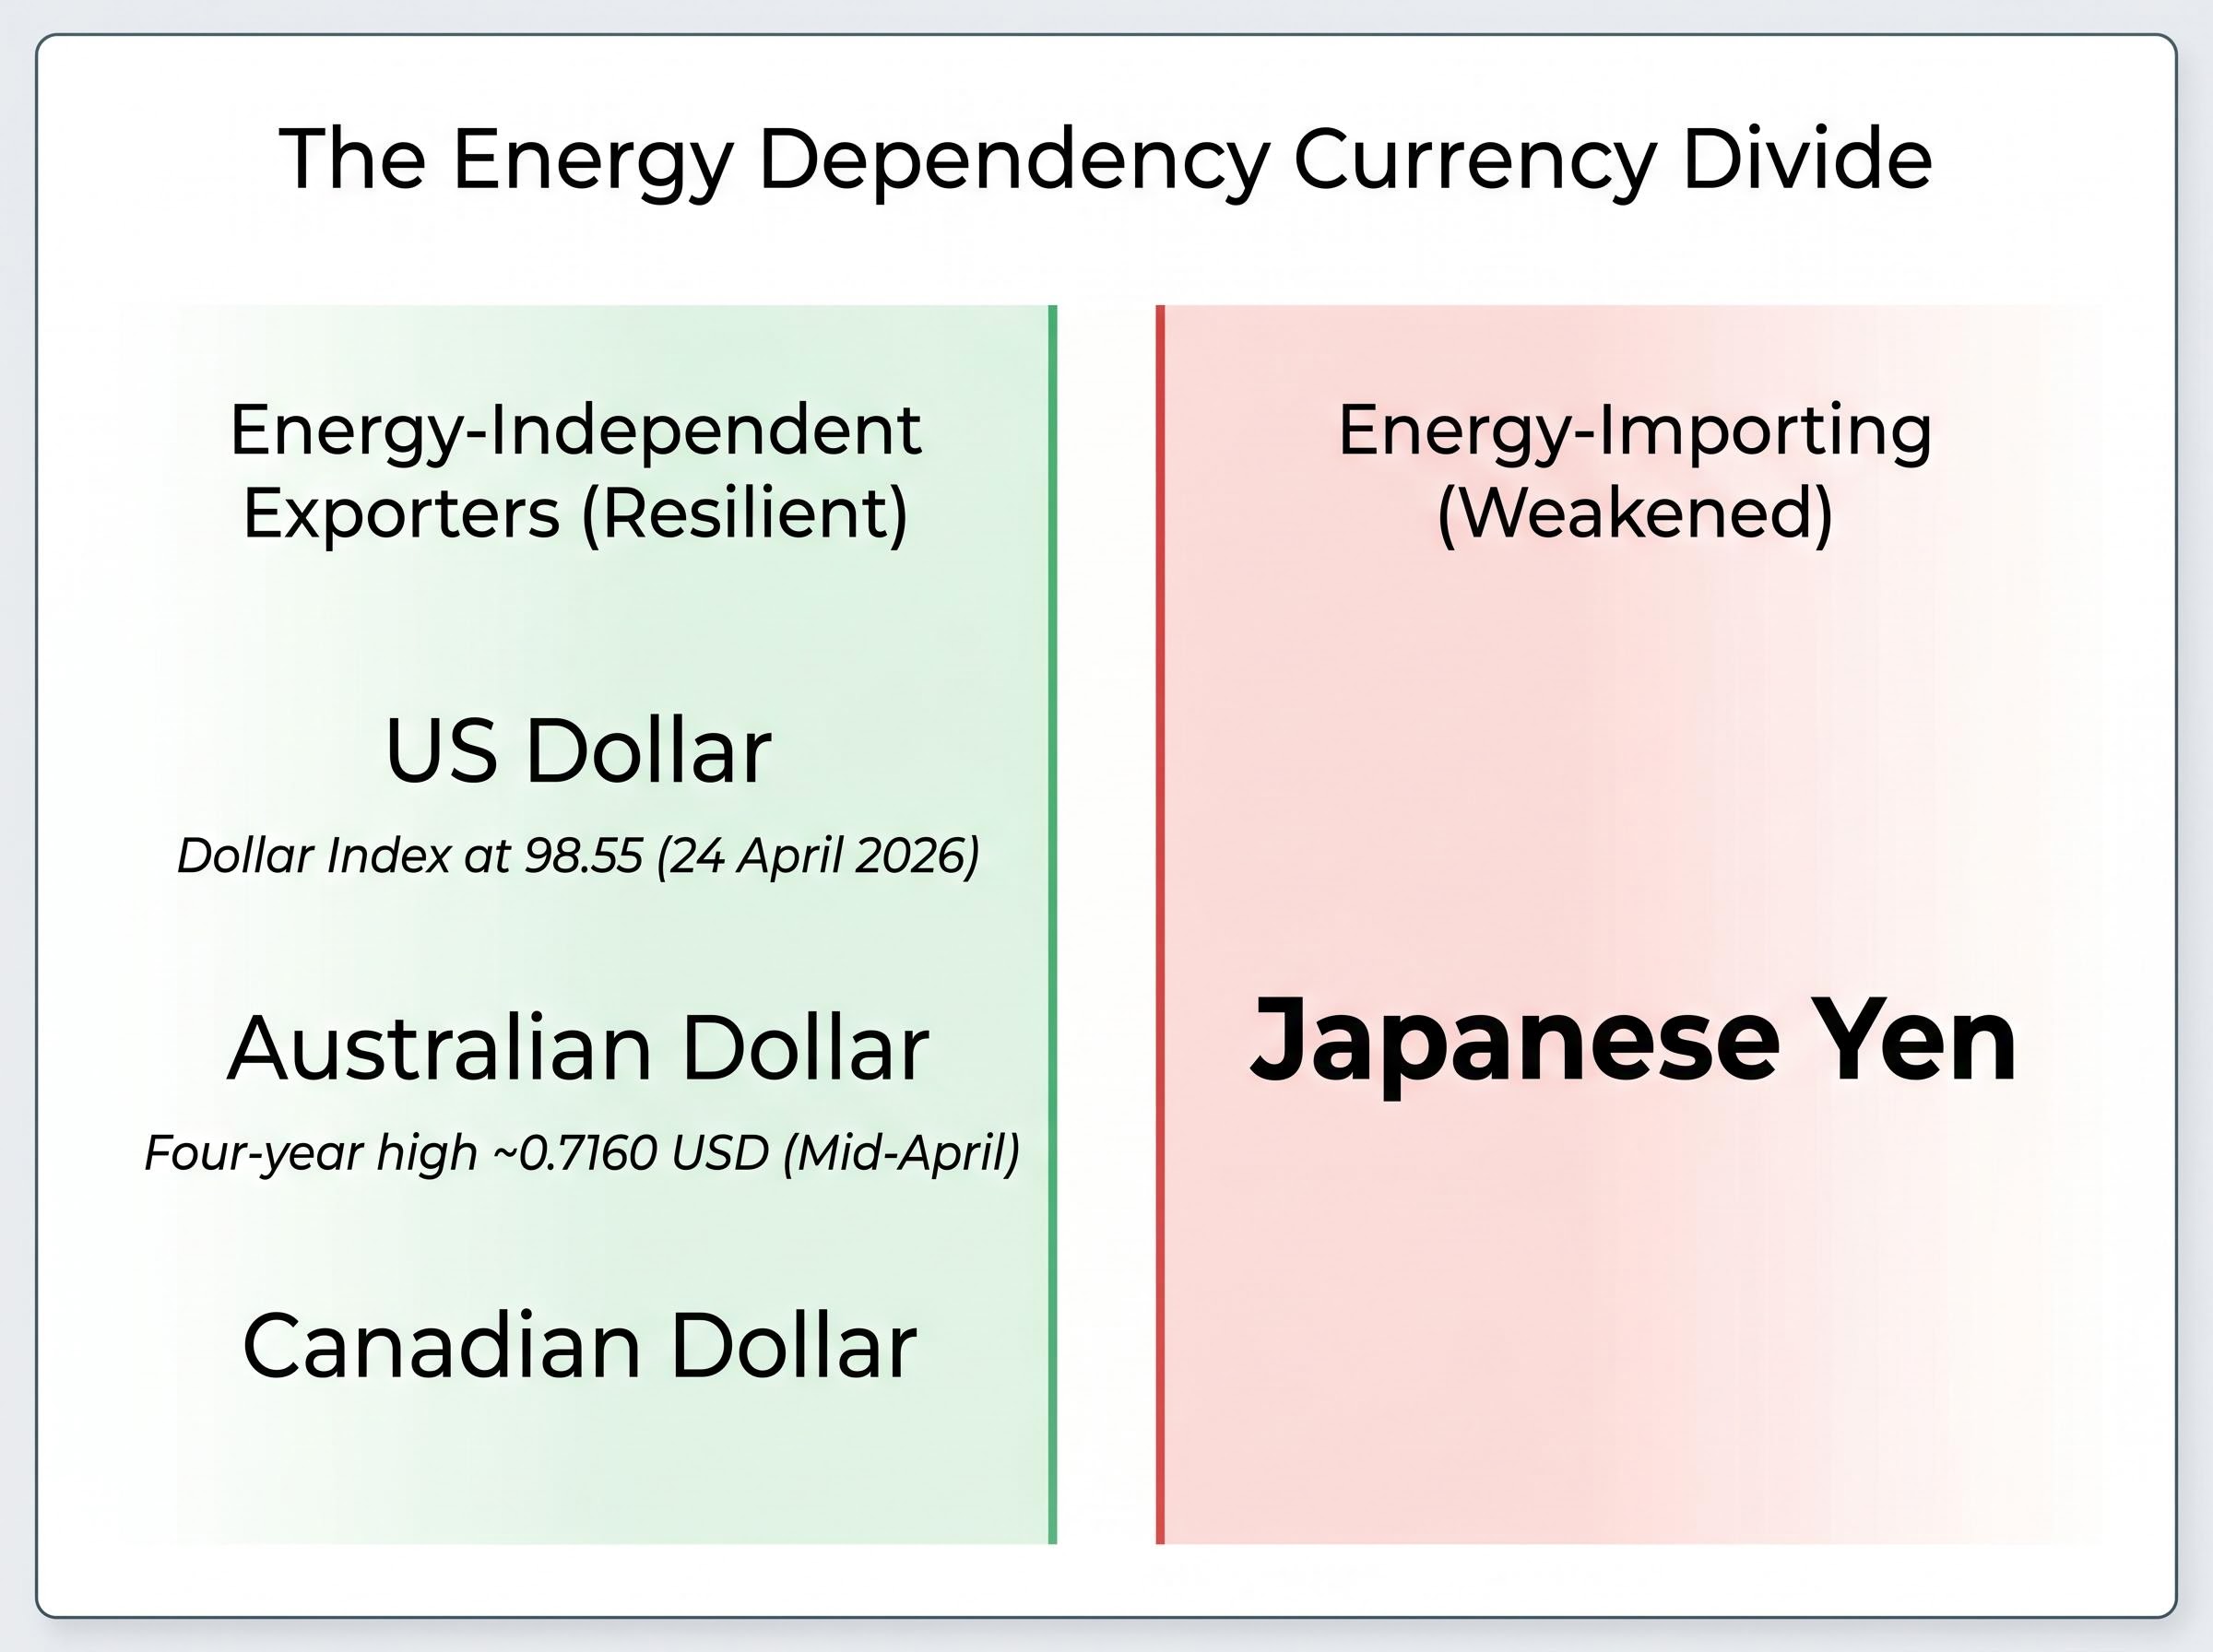
The dollar’s performance is real but not frictionless. The Dollar Index slipped 0.28% to 98.55 on 24 April 2026, showing intraday softness even within the broader resilient trend. Energy independence provides a buffer, not an immunity.
The Australian angle: why the AUD and the RBA complicate the picture for local investors
The global analysis matters, but the Australian context is where it becomes personal. The Australian dollar has surged to a four-year high around 0.7160 USD in mid-to-late April, placing it firmly in the resilient camp. Three factors are driving that strength:
- Commodity export benefit: Australia’s terms of trade improve when energy and resource prices rise, providing a partial offset to the economic disruption
- RBA hawkish signals: rate hike expectations have attracted capital flows into AUD-denominated assets
- De-escalation hope: periods of optimism around Iran peace talks have periodically lifted the currency further
The AUD’s resilience carries a less obvious consequence for local investors. Australian holders of USD-denominated assets, including gold (which is priced in US dollars), face a currency headwind on top of the underlying asset’s price decline. A falling gold price combined with a strengthening AUD compounds losses when translated back to Australian dollar terms.
What the RBA’s dilemma means for Australian bond and cash investors
The RBA’s position mirrors the global central bank dilemma in miniature. The cash rate stands at 4.1%, and Westpac forecasts further hikes to 4.35% or higher. The Australian Financial Review (AFR) reported on 30 March 2026 that economists are warning of recession risks if rate rises continue at this pace in response to the oil-driven inflation surge.
The RBA cannot cut rates to support growth without worsening inflation. If it continues hiking, recession risk escalates. This policy bind has direct implications for fixed income positions.
Short-duration instruments and floating rate bonds benefit from higher cash rates, as their yields reset upward with each hike. Long-duration bond fund holders face the opposite: rising yields push the market price of their existing holdings down, even though coupon income continues to flow. That income stream provides a stabilising component that total return figures may understate, but the capital losses are real and visible in portfolio valuations. The Betashares Crude Oil ETF fell approximately 8.6% in the relevant period, illustrating the broader complexity facing ASX-listed instruments tied to energy and rate-sensitive dynamics.
What history says about how these situations resolve, and what could shift quickly
A cease-fire has been announced, and Tehran has signalled openness to an interim agreement to reopen the Strait of Hormuz in exchange for US port blockade relief. Negotiations remain ongoing as of late April 2026, though blockade conditions persist and at least 26 Iranian shadow fleet vessels have bypassed the US blockade.
The resolution pathway is uncertain, but the asset class implications of different outcomes are logically predictable:
- Full diplomatic resolution: energy prices fall sharply, bond yields stabilise or decline, rate-sensitive equities recover, and gold potentially regains ground as the dollar weakens
- Partial resolution (strait reopens, tensions persist): yields stabilise at elevated levels, uncertainty discounts remain, and volatility persists across asset classes
- Prolonged conflict: stagflation risk deepens, cash and short-duration instruments remain favoured, and long-duration assets continue to underperform
Markets historically front-run geopolitical resolutions before full settlements are reached. The same assets that are underperforming now, bonds and rate-sensitive equities, could recover quickly once de-escalation becomes credible.
There is also a mispricing risk on the optimistic side. Markets may be overestimating how far rates need to rise. The current crisis is more narrowly energy-focused than 2022, when supply chain disruption, pandemic aftershocks, and the energy shock compounded simultaneously. The ASX ETF market, which holds approximately $329 billion in assets, has seen recent inflows favouring fixed income and emerging market strategies, suggesting some investors are already positioning for a stabilisation that has not yet arrived.
Dollar-cost averaging and portfolio reassessment represent the practical response: not a prediction call, but a disciplined approach to a situation where both upside and downside scenarios remain plausible.
Investors exploring the timing question in more depth will find our dedicated guide to the RBA policy pivot, which applies the Taylor Rule to current inflation data, analyses oil futures backwardation as a signal of the shock’s expected duration, and draws on Oxford Economics modelling showing potential back-to-back GDP contractions in the June and September 2026 quarters as evidence that rate cuts may arrive sooner than current market pricing reflects.
This article is for informational purposes only and should not be considered financial advice. Investors should conduct their own research and consult with financial professionals before making investment decisions.
These forward-looking statements are speculative and subject to change based on market developments, diplomatic outcomes, and central bank policy decisions. Past performance does not guarantee future results.
Supply shocks rewrite the rulebook, and the next crisis may too
The type of shock determines which protections work. Demand collapses favour bonds and gold. Supply shocks break both. That distinction is the most transferable insight from the current crisis, and it is rarely explained in mainstream coverage until after the damage is done.
For Australian investors specifically, the picture carries additional layers. The AUD’s commodity linkage has provided partial insulation, but the RBA’s constrained position is a live risk that could tip either way. Short-duration domestic instruments have held up better than conventional safe havens, a pattern consistent with the supply-shock framework rather than a coincidence.
The Strait of Hormuz remains closed. Negotiations are incomplete. The situation is evolving daily, with shadow fleet transits, cease-fire conditions, and central bank meetings all capable of shifting the trajectory. Investors who understand the mechanics of why their safe havens failed are better positioned to interpret what comes next than those still waiting for the old rulebook to reassert itself.