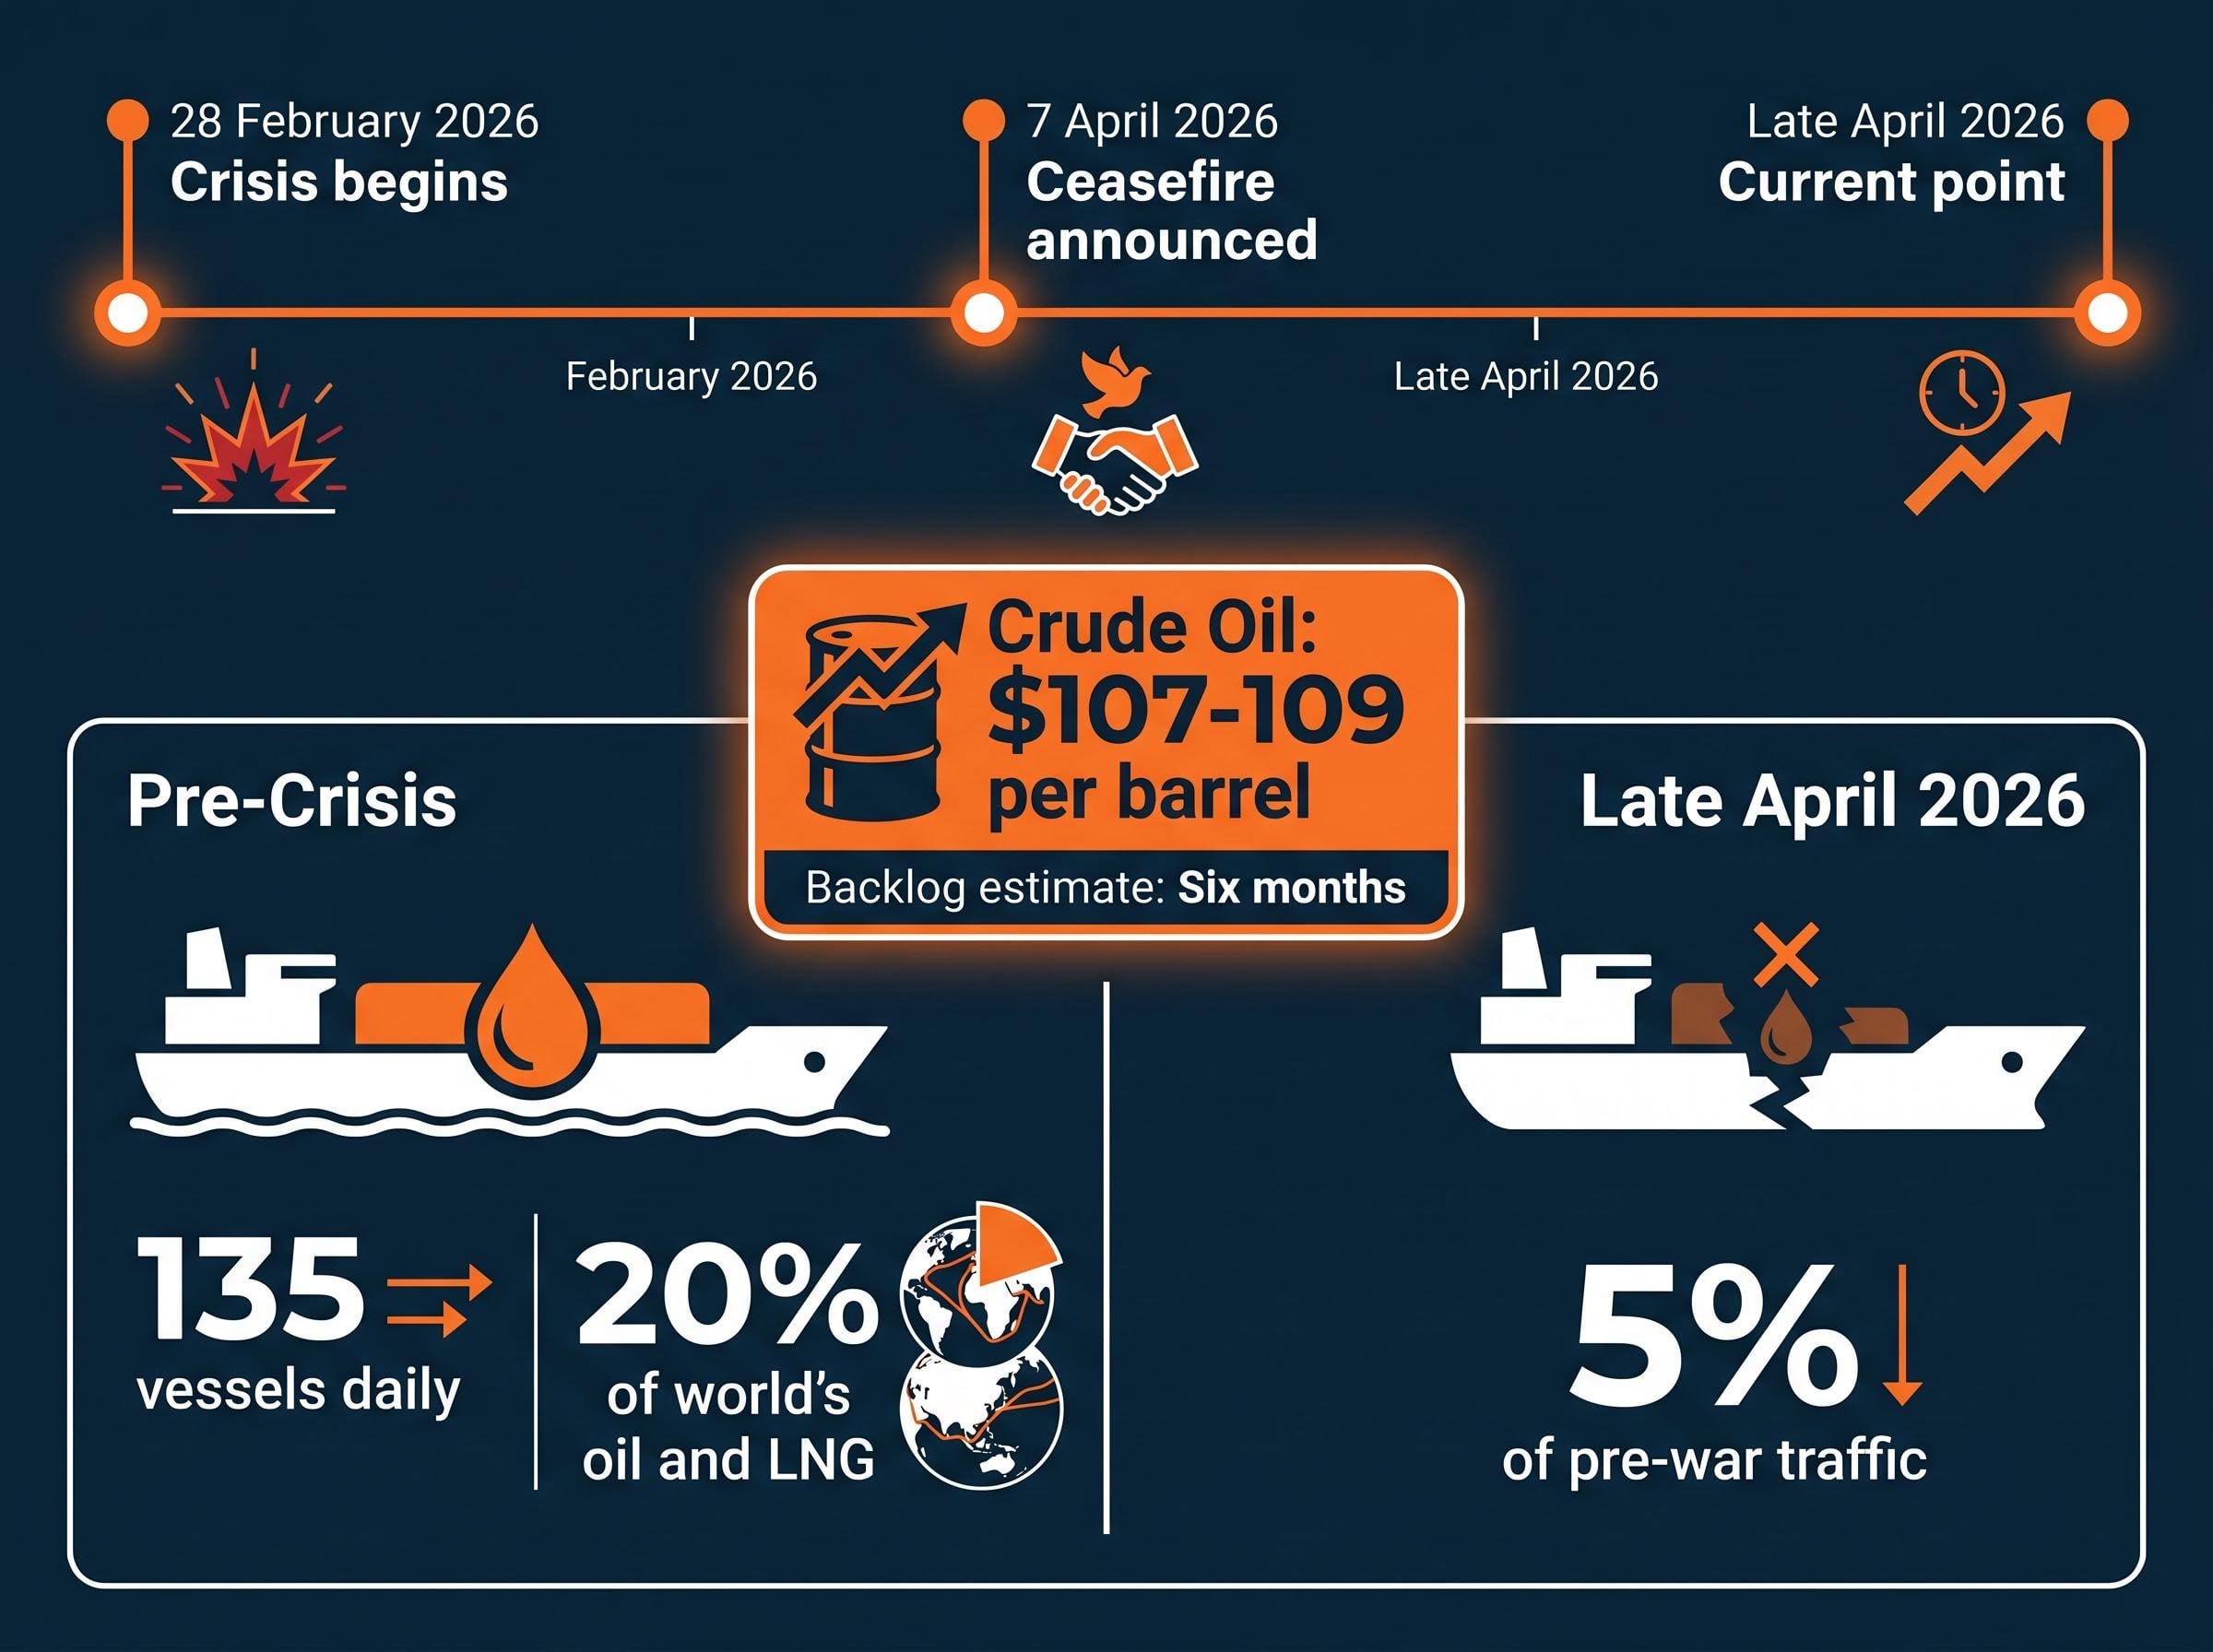
One strait carrying 20% of the world’s oil is now moving a trickle of its normal traffic, and the foreign exchange market has rewired itself around that single chokepoint. The Strait of Hormuz crisis, which began on 28 February 2026, has done something unusual to currency markets: it has made energy dependence the dominant variable in forex valuation, displacing the traditional hierarchies of safe-haven status and rate differentials. With crude oil trading at $107-109 per barrel and global shipping backlogs estimated to persist for six months, this is not a transient repricing event.
What follows maps the new forex terrain for Australian investors: which currencies are winning and losing under the energy-dependence framework, why some historical assumptions no longer apply, and what the Australian dollar’s specific position means for portfolios holding offshore assets.
Why this energy crisis is rewriting the forex rulebook
Most investors carry a set of assumptions into a geopolitical crisis. The yen strengthens. The US dollar attracts safe-haven flows. Rate differentials reassert themselves once the initial shock passes. Those assumptions were built for demand-side contractions, recessions and financial crises where capital flees risk assets and seeks the most liquid, most stable store of value.
The Hormuz disruption is a supply-side shock. It has not destroyed demand; it has severed a supply artery. Before the crisis, the strait handled roughly 135 vessels daily, carrying approximately 20% of the world’s oil and liquefied natural gas (LNG). As of late April 2026, traffic sits at roughly 5% of pre-war averages, despite a ceasefire announced on 7 April 2026.
That distinction changes which assets benefit. In a demand shock, the safest balance sheet wins. In a supply shock, the most self-sufficient energy position wins. A nation’s net energy balance now functions as a de facto credit rating in the forex market, and currencies are repricing accordingly.
The scale of the underlying disruption extends beyond the strait itself: Goldman Sachs has modelled a global supply deficit of 9.6 million barrels per day, a figure that, combined with Iran’s critically low storage capacity and an estimated 12-22 day window before forced well shut-ins risk permanent field damage, structurally constrains any rapid recovery in shipping volumes.
The old rules versus the new:
- Traditional safe-haven logic: capital flows to the most liquid, most stable sovereign assets during a demand contraction
- Energy-position logic: capital flows to the most energy-self-sufficient sovereigns during a supply disruption, because those nations face the least inflationary pressure and the smallest terms-of-trade deterioration
Shipping analysts estimate the backlog could take up to six months to fully clear, even under optimistic recovery assumptions. The disruption’s duration, not just its severity, is shaping currency positioning.
Investors still applying pre-crisis logic to their currency risk assessments are working from an outdated map.
When big ASX news breaks, our subscribers know first
What energy dependence actually means for a currency: the yen as the clearest case study
Japan’s yen has long been the premier safe-haven currency, the reflexive destination for capital during crises. In 2026, it is visibly weakening. The paradox dissolves the moment the lens shifts from liquidity to energy.
Japan imports nearly all of its energy. That structural vulnerability, largely irrelevant during financial crises, becomes the dominant variable when the crisis is an energy supply disruption. Higher oil and LNG prices flow directly into Japan’s import bill, widening its trade deficit and eroding the yen’s purchasing power.
The Bank of Japan (BoJ) now faces a stagflationary bind:
- Inflation revised upward to 2.5-3% for FY2026, driven substantially by energy costs
- Growth forecast cut to 0.5% for FY2026
- Policy rate held steady, despite inflationary pressure, because hiking into a growth slowdown risks deepening the contraction
- Yen weakness as the compounding result: the currency absorbs the pressure that policy cannot address
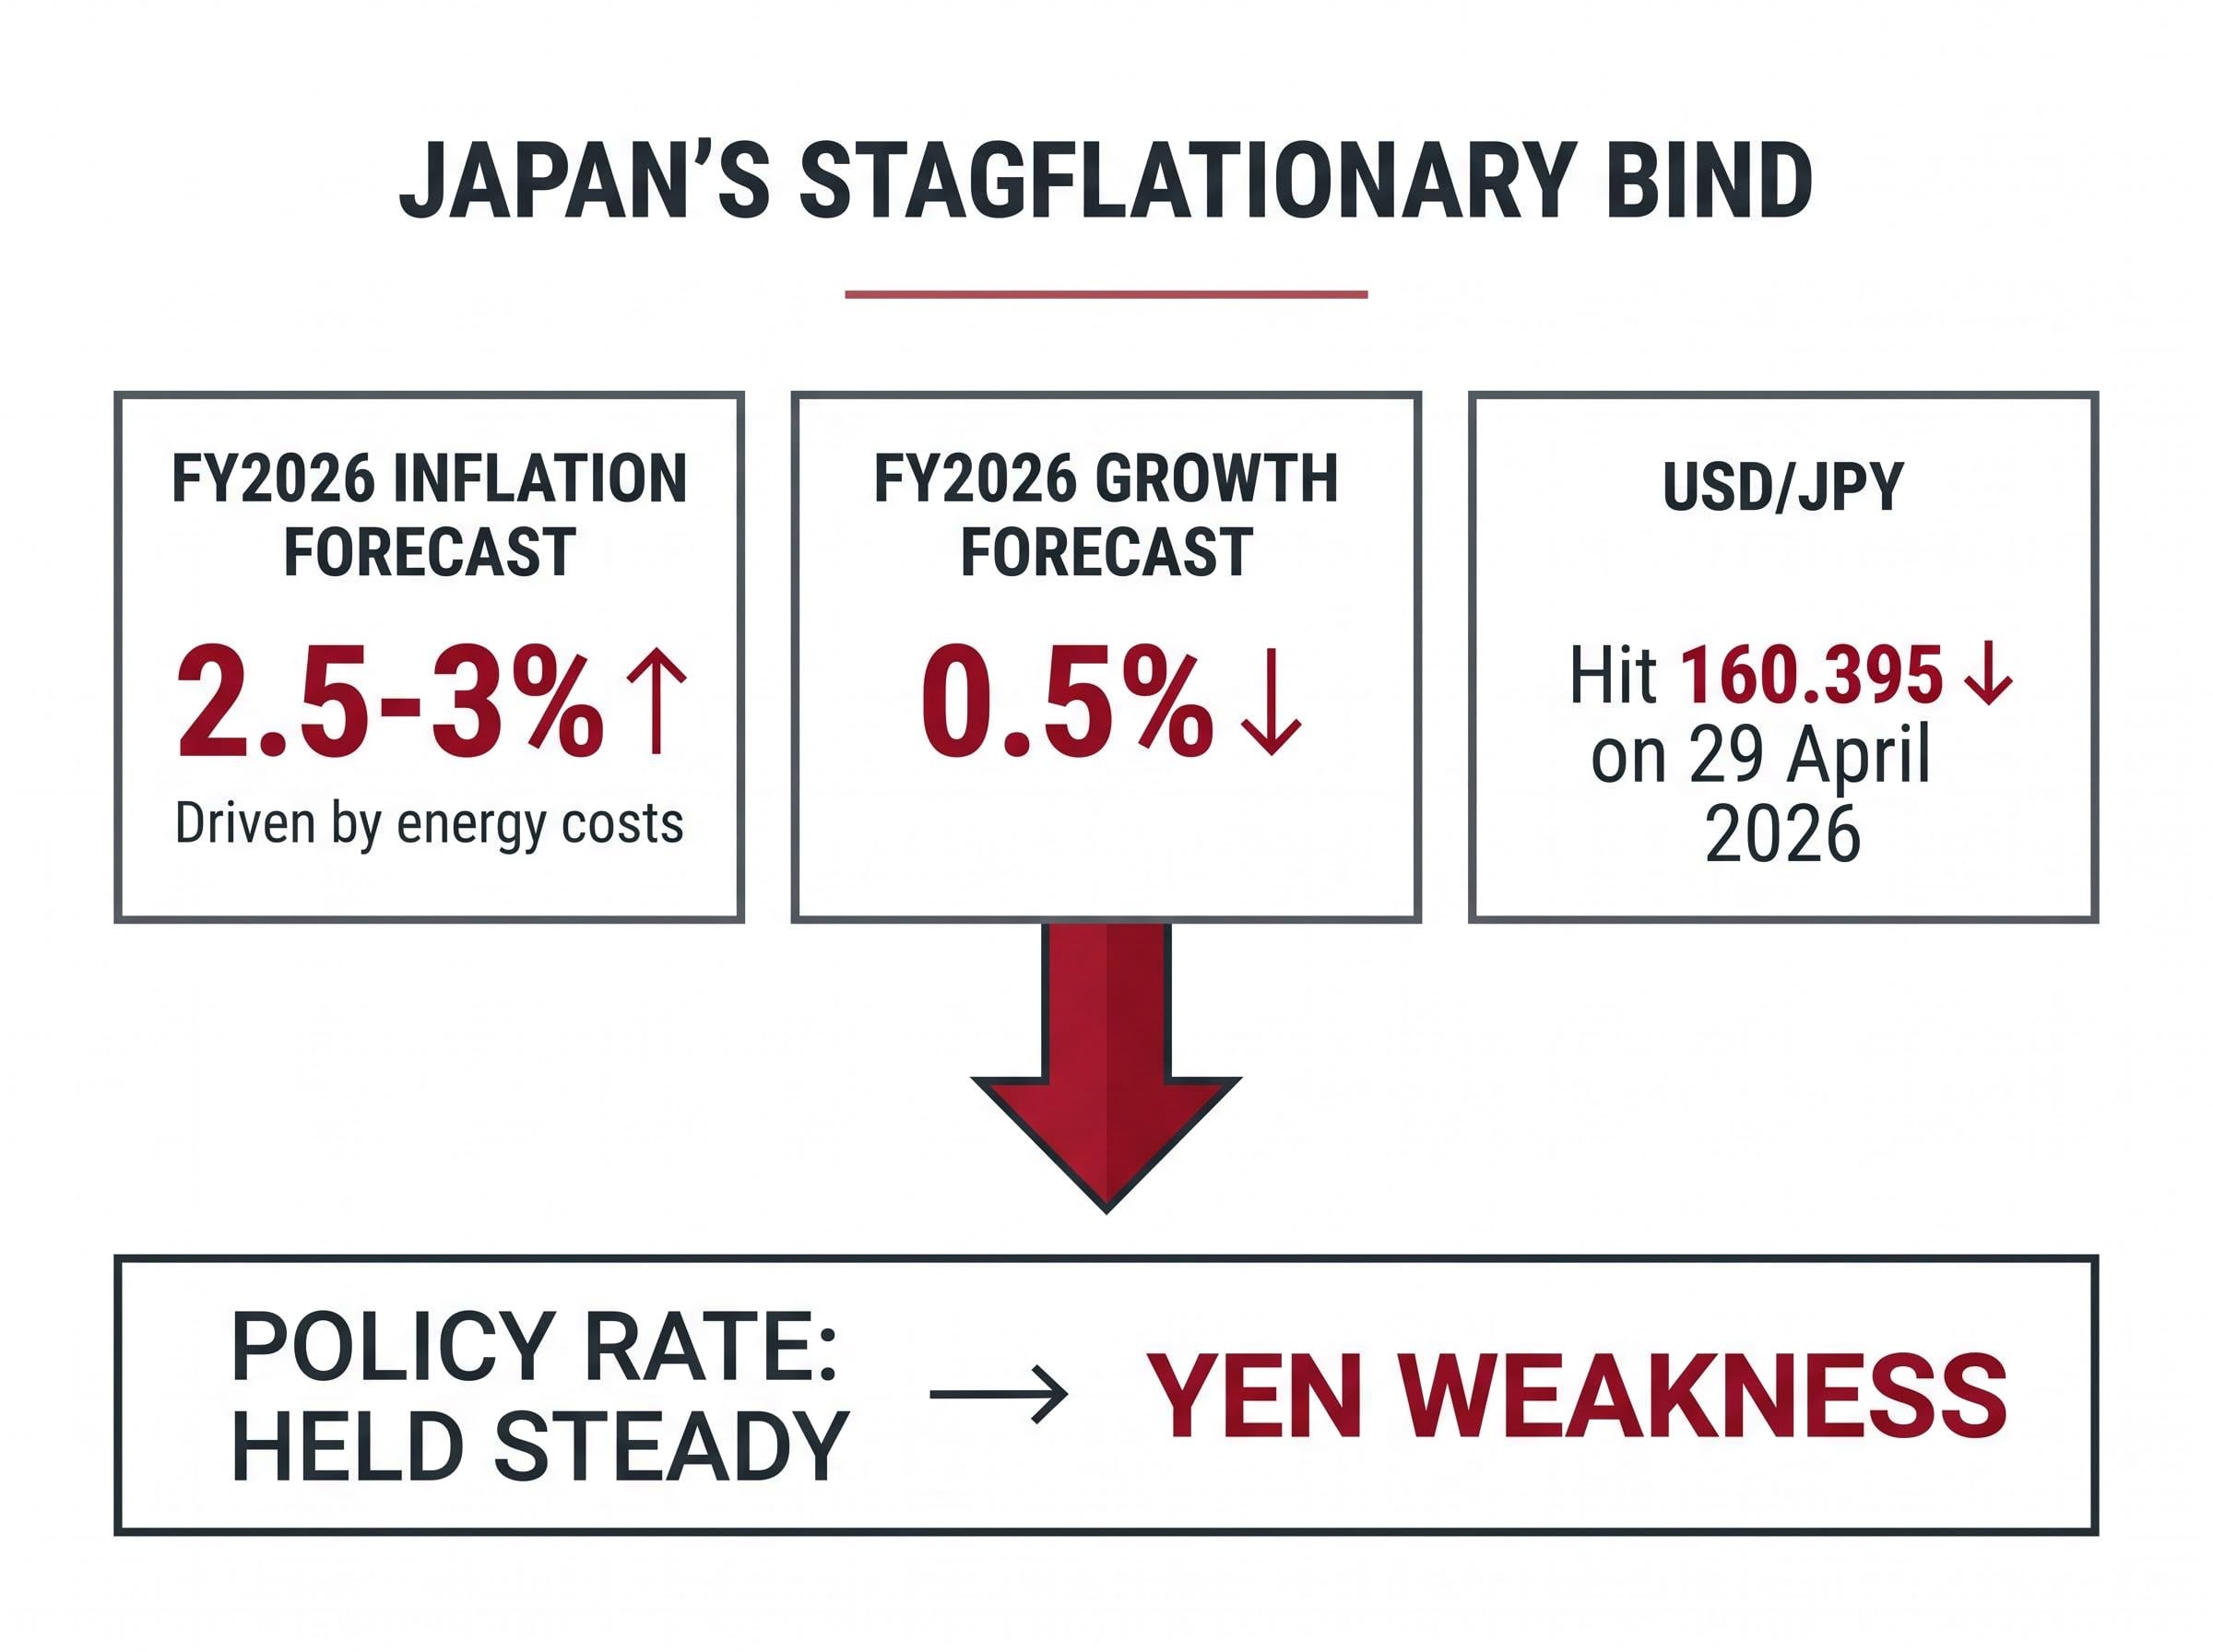
The BoJ’s FY2026 growth forecast of 0.5% signals the severity of the stagflationary configuration. Growth has been sacrificed to absorb the energy shock, and the yen is bearing the cost.
USD/JPY hit 160.395 on 29 April 2026, reflecting continued depreciation. For Australian investors, the practical consequence is direct: the BoJ’s frozen rates set against the Reserve Bank of Australia’s (RBA) expected rate hike create a widening rate differential on the AUD/JPY cross. Australian investors holding Japanese equities or bonds face a compounding risk where yen depreciation erodes the AUD-translated value of those holdings at the same time that the BoJ’s growth-inflation bind suppresses underlying asset performance.
The US dollar: how energy self-sufficiency became a monetary superpower
The dollar’s strength in this crisis is not simply a safe-haven reflex. It is structurally grounded in a way that distinguishes it from previous episodes of flight-to-quality.
US domestic energy production insulates the economy from the import-cost spiral hitting Japan, Europe, and developing Asia. While those regions absorb higher energy costs directly into their inflation readings and trade balances, the US terms of trade remain comparatively stable. That insulation creates a structural advantage that persists beyond the initial risk-off phase.
Petrodollar dynamics reinforce the effect. Energy transactions priced in USD generate structural demand for the currency regardless of Federal Reserve rate decisions. When oil trades at $107-109 per barrel, the volume of USD-denominated transactions increases in absolute terms, creating a demand floor beneath the dollar that is independent of monetary policy.
The UAE’s departure from OPEC in May 2026, targeting 5 million barrels per day independently through ADNOC, adds a further structural variable: OPEC’s pricing power has diminished precisely when coordinated supply management would most benefit importing nations, reinforcing the argument that elevated oil prices are not a temporary shock that OPEC can unwind on command.
What the rate picture adds
US 10-year Treasury yields above 4% reinforce the rate differential supporting USD. The combination of energy self-sufficiency, petrodollar transaction demand, and a yield advantage produces a currency strength that looks durable rather than reactive.
The following table summarises the key pairs as of late April 2026:
| Currency Pair | Rate (approx.) | Direction | Primary Driver |
|---|---|---|---|
| AUD/USD | 0.7183 | AUD weakening | USD safe-haven flows; AUD import-cost pressure |
| USD/JPY | 159-160 | JPY weakening | Japan energy dependence; BoJ policy paralysis |
| USD/CAD | 1.3678 | CAD resilient | Canada energy-export offset vs broad USD strength |
For Australian investors with USD-denominated offshore holdings, USD strength translates directly into higher AUD-translated portfolio values. Understanding the structural basis of that strength helps inform whether to maintain, increase, or hedge that exposure.
Why commodity currencies are holding ground: the Australian and Canadian dollar story
The same supply shock driving losses for energy importers is creating a partial buffer for commodity exporters. The mechanism runs through export revenues: elevated energy and resource prices lift the national income of commodity-producing nations, partially offsetting the import-cost pressures that weaken other currencies.
The transmission works in sequence:
- High oil prices elevate global energy costs
- Elevated LNG prices lift Australian export revenues (Australia is a major LNG exporter)
- Elevated gold prices provide an additional export revenue stream
- Combined export revenues partially support the AUD against broad USD strength
- Australia’s net position remains stronger than pure energy importers like Japan
AUD/USD at approximately 0.7183 reflects this relative resilience. The Australian dollar has pulled back below 0.72, but it has held far firmer than the yen and other Asian currencies facing unhedged energy-import exposure.
Gold’s role as Australia’s partial natural hedge
Gold, trading at approximately $4,578 per ounce as of 30 April 2026, adds a second revenue stream that specifically benefits Australia’s export position. Goldman Sachs forecasts gold reaching $5,000-5,400 by end-2026, a trajectory that, if realised, would further support AUD through elevated mining export revenues.
That forecast carries a caveat. Some analysts warn of a potential 25% correction before the next leg higher, a risk worth factoring into timing assumptions for investors with significant gold exposure.
The choice between gold versus sovereign bonds as a capital preservation tool sharpens when both are under simultaneous pressure from energy-driven inflation: elevated domestic bond yields erode fixed-income prices at the same time that a strong USD creates headwinds for non-yielding gold held in AUD terms, leaving Australian investors in a narrower range of genuinely defensive options than historical frameworks suggest.
How Canada compares
USD/CAD at approximately 1.3678 reflects the Canadian dollar’s resilience against broad USD strength. Canada’s position is more straightforward than Australia’s: it is a net energy exporter without the same liquid fuels import exposure. Australia’s dual role as both LNG exporter and liquid fuels importer makes its net position more complicated. Australian CPI at 4.6% illustrates the import-cost side of that dual exposure, a pressure Canada faces to a lesser degree.
What the forex rulebook actually is: a plain-English guide for investors navigating currency risk
Exchange rates between two currencies reflect the balance of four forces, each of which the current crisis has shifted:
- Interest rate differentials: capital flows toward currencies offering higher returns. US 10-year yields above 4% currently pull capital toward the dollar and away from lower-yielding alternatives like the yen
- Trade balances: countries exporting more than they import see currency support from foreign buyers purchasing the local currency to pay for goods. Australia’s LNG and gold exports provide this support
- Inflation expectations: higher expected inflation erodes a currency’s purchasing power, weakening it. Australian CPI at 4.6% and Japanese inflation at 2.5-3% both reflect energy-driven erosion
- Risk sentiment: during uncertainty, capital tends to concentrate in assets perceived as safest. The USD and, historically, the JPY attract these flows
Safe-haven currencies have traditionally attracted flows during crises because they offered deep liquidity and sovereign stability. The yen and dollar both carried this status. What the Hormuz crisis reveals is that safe-haven logic was designed for demand-side recessions, periods where the shock is financial and the safest balance sheet wins.
A supply-side shock changes the equation. When the disruption is physical, upstream in the energy supply chain, the currency that wins is not the most liquid; it is the most insulated from the supply constraint. That is why the dollar is strengthening and the yen is weakening simultaneously, something the old framework cannot explain.
Understanding this transmission mechanism allows investors to make more deliberate decisions about offshore allocation and hedging, rather than reacting to rate movements after the fact.
What Australian investors should be watching as this crisis enters its next phase
The crisis is not resolving quickly. The six-month shipping backlog estimate means Australian investors have time to act deliberately rather than reactively, but the window for low-volatility repositioning may be narrowing. Three forward indicators deserve priority monitoring:
- RBA rate decision timing: Australian CPI at 4.6% places the RBA under active pressure to hike. Australian financial commentary has framed geopolitical tensions as the RBA’s “last straw” in justifying a move. A rate hike would pressure interest rate-sensitive domestic assets (property, bonds) while providing partial AUD support through widened rate differentials against the yen and other low-rate currencies.
- Hormuz shipping recovery progress: the ceasefire announced on 7 April 2026 has not restored traffic. Until shipping volumes recover meaningfully from the current 5% of pre-war averages, inflationary pressure on energy imports persists into H2 2026, sustaining the supply-side forex framework.
- Gold price direction: Goldman Sachs’ $5,000-5,400 end-2026 forecast, if realised, would provide a meaningful positive catalyst for the AUD through export revenue dynamics. Monitoring gold alongside oil gives a clearer picture of Australia’s net commodity position.
The RBA Monetary Policy Board minutes from March 2026 explicitly link the Middle East conflict to sharply higher fuel prices and increased inflationary pressure, providing the primary-source basis for the CPI trajectory and rate hike expectations shaping the AUD/JPY differential.
Australian financial commentary has described geopolitical energy inflation as the RBA’s “last straw” for rate hikes, framing the next decision as a direct portfolio risk event for domestically focused investors.
The AUD/USD range of 0.7119-0.7193 over the prior week illustrates near-term volatility that could widen as these catalysts approach.
Energy maps are currency maps now: what this shift means beyond 2026
The Hormuz crisis has not merely moved exchange rates. It has revealed a latent structural variable, energy self-sufficiency, that was always present in currency valuations but not dominant until a supply-side shock made it determinative. The dollar’s strength, the yen’s weakness, and the commodity currencies’ relative resilience all follow from the same underlying logic.
If the six-month recovery timeline proves optimistic and the backlog extends, this framework could become entrenched. Institutional investors would accelerate portfolio adjustments around energy-position analysis, and individual investors would need to track those flows to avoid being positioned on the wrong side of a structural rotation.
Currency markets have effectively rewritten their valuation hierarchy around energy export capacity, a framework that extends beyond forex into equity sector rotation and fixed income positioning: the same logic that strengthens the USD and partially supports the AUD is also driving institutional capital toward energy producers and away from rate-sensitive sectors exposed to import-cost inflation.
The International Monetary Fund (IMF) has flagged higher energy prices as tightening financial conditions globally and nudging 2026 growth forecasts lower, lending institutional weight to the view that this disruption carries structural rather than transient consequences.
The IMF World Economic Outlook April 2026 projects energy commodity prices rising 19% in 2026, with oil specifically forecast to increase 21.4% on account of Middle East production and transportation disruptions, lending institutional weight to the view that supply-side inflation will persist well beyond the initial shock.
For Australian investors specifically, the dual position as both LNG exporter and liquid fuels importer makes this moment more nuanced than it appears for either pure exporters or pure importers. Currency diversification and active monitoring of the three forward indicators identified above carry more value than passive hedging assumptions suggest. The conditions that must resolve before the old forex framework reasserts itself, 4.6% CPI, $107-109 oil, gold above $4,500, remain firmly in place.
This article is for informational purposes only and should not be considered financial advice. Investors should conduct their own research and consult with financial professionals before making investment decisions. Past performance does not guarantee future results. Financial projections referenced in this article are subject to market conditions and various risk factors.