What UK Traders Lose When Their CFD Account Goes Offshore
29 mins ago

Every time a share price ticks up or down on a brokerage app, an electronic auction has just concluded in microseconds. Most new investors watch those numbers move without understanding what happened between the tap of a “buy” button and the execution confirmation that follows. Financial markets are often described in outcomes: prices rising, yields falling, volatility spiking. The mechanics underneath those outcomes receive far less attention. For anyone entering markets in 2026, understanding the structural engine that produces those price movements is the difference between interpreting them and guessing at them. This article explains how exchanges match buyers and sellers, how prices form continuously from competing bids and offers, and how new information travels from announcement to price change in real time. By the end, readers will have a structural mental model of how financial markets work, applicable across equities, bonds, forex, and derivatives.
“The market” is not one place. It is a collection of distinct arenas, each with its own instruments, participants, and structural rules. The four main asset classes are:
One common point of confusion: exchange-traded funds (ETFs) trade on exchanges like individual shares but hold diversified baskets of underlying assets. They are pooled instruments, not a separate asset class.
The ETF ownership structure sits one layer removed from the underlying assets: when a buyer acquires an ETF share, they hold a proportional claim over a basket rather than direct legal title to any constituent stock, which has meaningful implications for how corporate actions, dividends, and voting rights flow through to the end investor.
Exchange-traded markets, where equities and listed derivatives trade, use centralised order books. The NYSE, Nasdaq, LSE, Euronext, ASX, and HKEX all operate this way, with public price transparency and standardised rules governing every transaction.
Over-the-counter (OTC) markets work differently. Bonds and forex trade through dealer networks and bilateral negotiation rather than a single visible order book. Price transparency is lower, and execution depends on finding a counterparty willing to trade at an acceptable price. This structural distinction shapes everything that follows.
Every exchange-listed security has a live order book: a continuously updated list of all pending buy orders (bids) and sell orders (asks) at various price levels. The highest bid and the lowest ask form the “best bid and offer,” sometimes called the inside market.
The governing rule is price-time priority. The best price is matched first. Among orders at the same price, the order submitted earliest gets filled first. This system is transparent and rule-based.
A simplified order book might look like this:
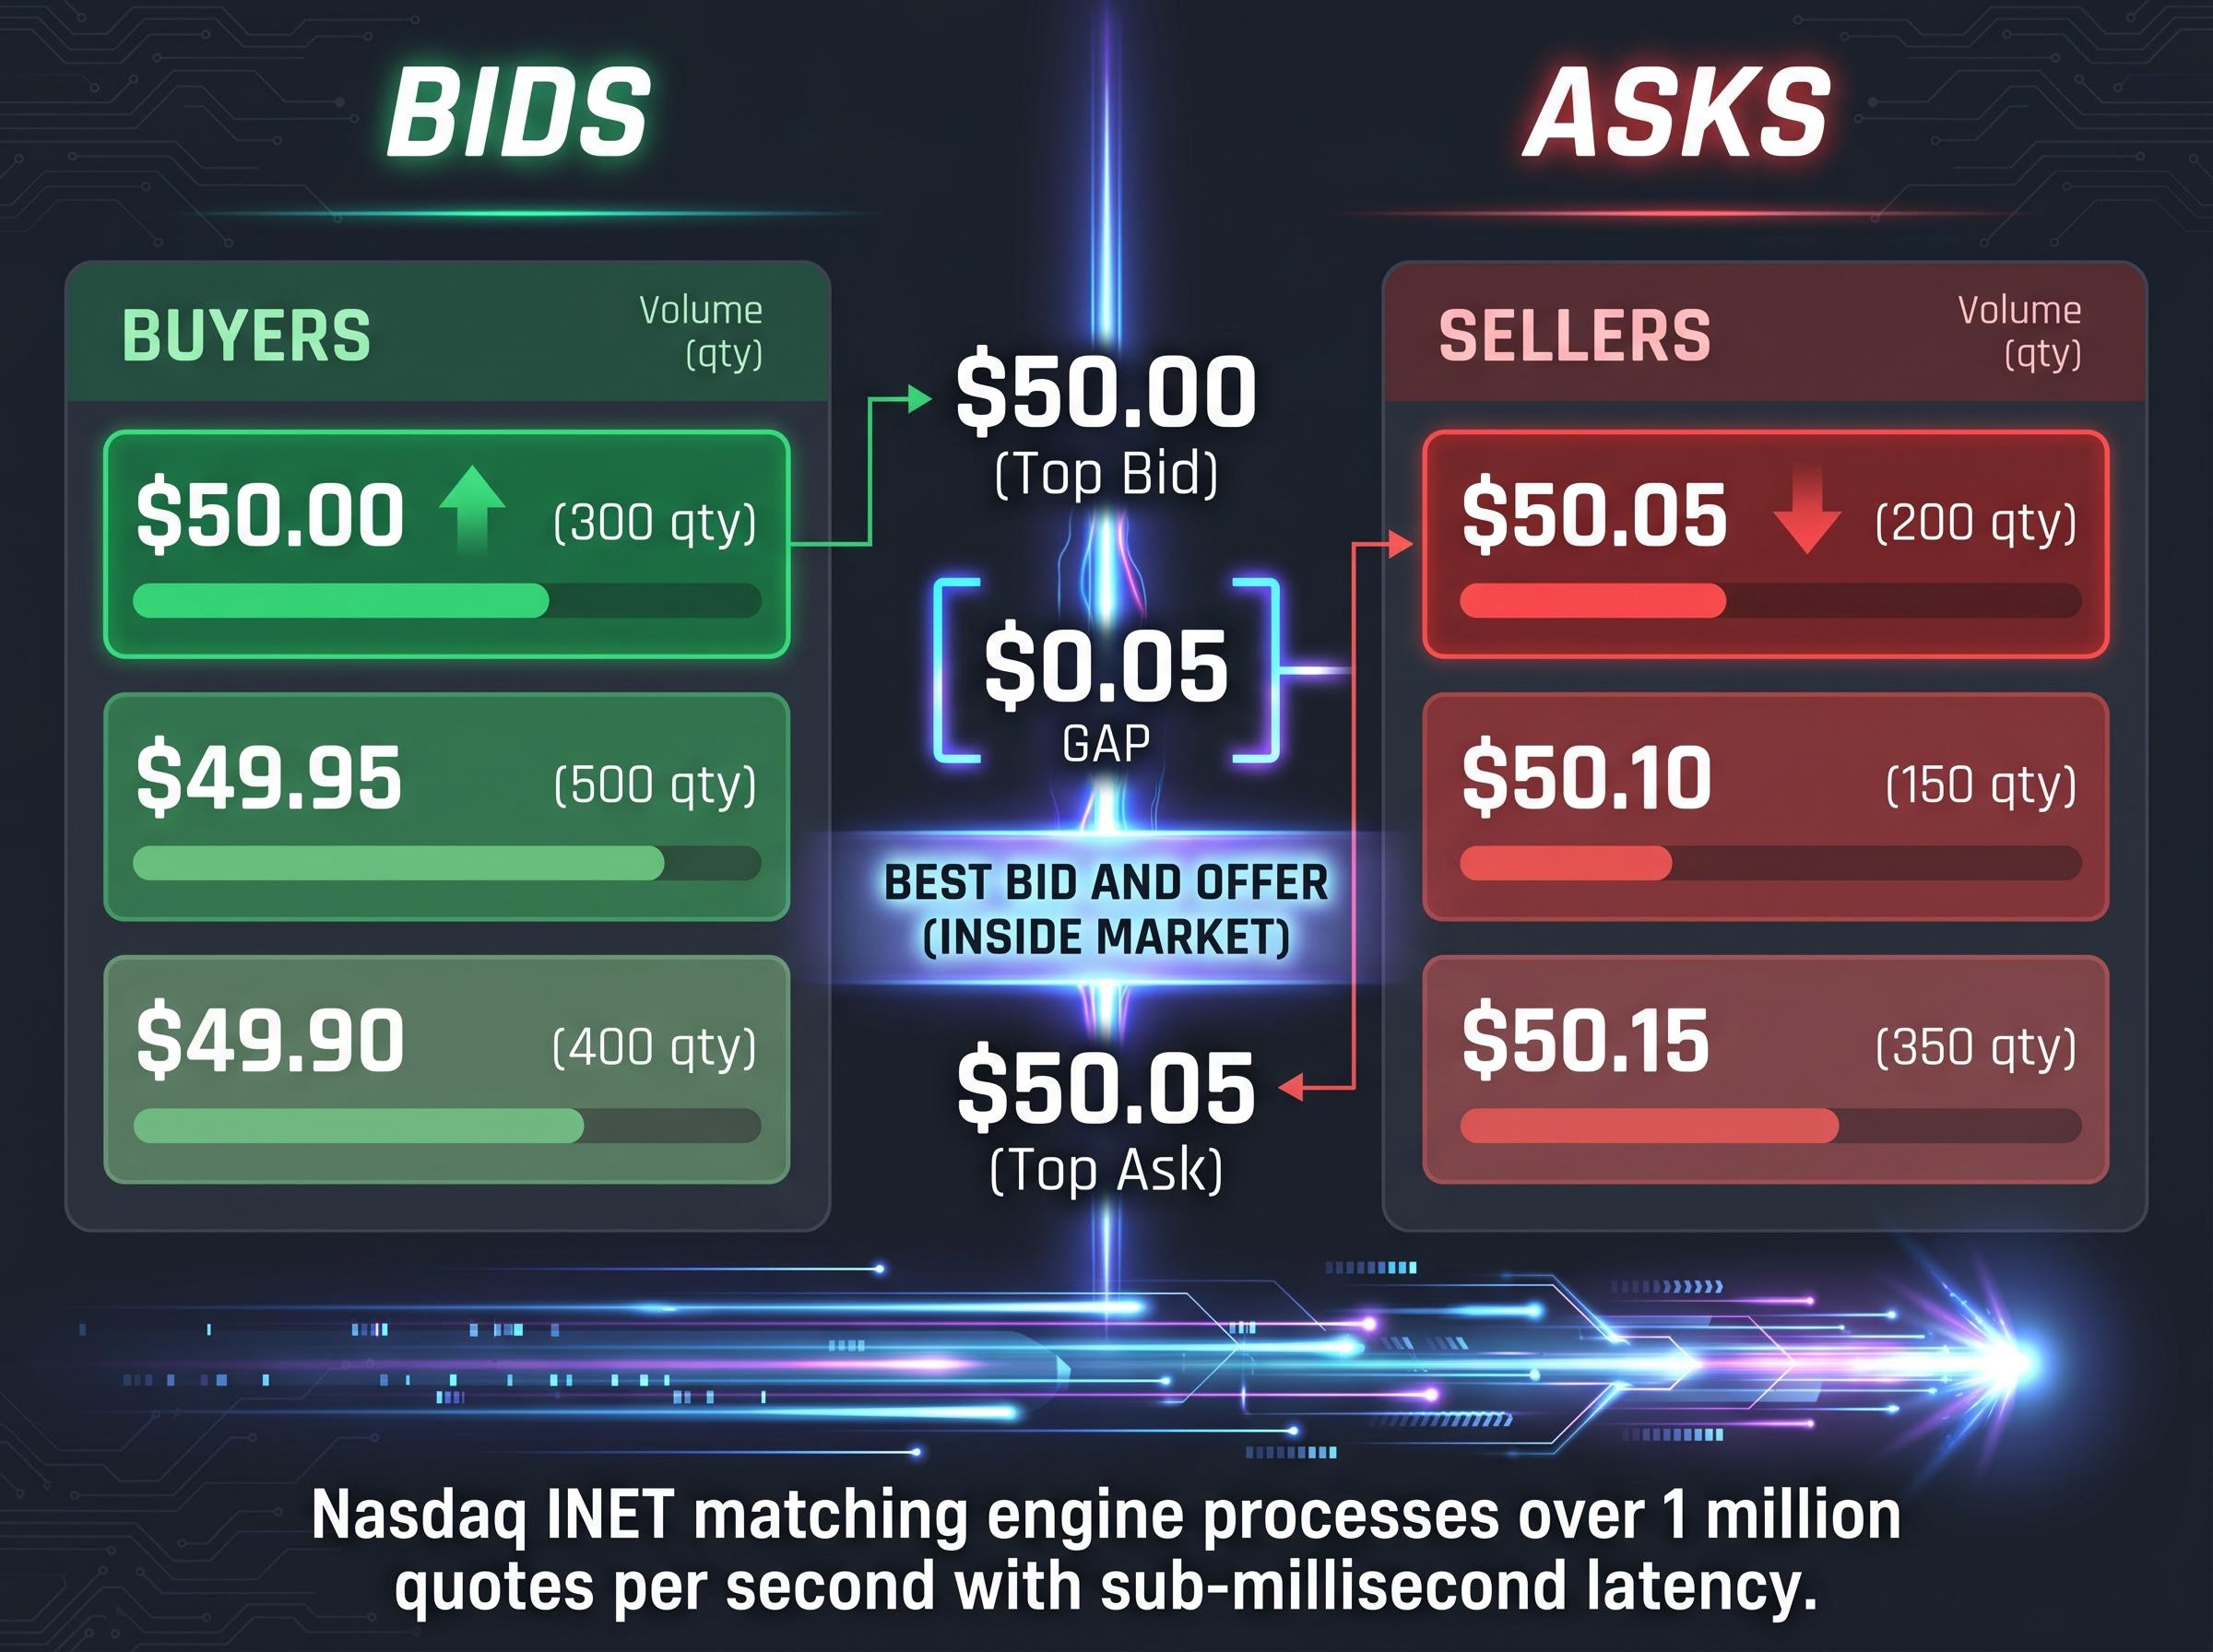
| Bid Price | Bid Quantity | Ask Price | Ask Quantity |
|---|---|---|---|
| $50.00 | 300 | $50.05 | 200 |
| $49.95 | 500 | $50.10 | 150 |
| $49.90 | 400 | $50.15 | 350 |
Two order types matter most for new participants. A market order executes immediately at the best available price, prioritising certainty of execution. A limit order executes only at a specified price or better, prioritising certainty of price.
A limit order does not guarantee execution, only price. A limit buy at $50.00 will remain unfilled if no seller is willing to transact at that level or below.
The infrastructure handling this process operates at extraordinary speed. Nasdaq’s INET matching engine processes over one million quotes per second with sub-millisecond latency. Market makers and Designated Market Makers (DMMs) on the NYSE have quoting obligations that help maintain liquidity, but they cannot unilaterally set prices.
Since May 2024, the US has operated on T+1 settlement, meaning trades settle the next business day, improving capital efficiency for all participants.
The order book is the mechanism. What it produces is price discovery: the continuous process by which competing bids and asks reveal a consensus price, moment to moment. A stock’s price at any given instant reflects the collective opinion of active participants, not an objective calculation of company worth and not a figure set by any single authority.
This is where a common misconception sits. Companies do not set their share prices. Brokers do not set them. Exchanges do not set them. Prices emerge from a decentralised auction in which every matched trade registers the most recent agreement between a buyer and a seller.
Four conditions create the imbalances that move prices:
Market breadth divergence, where headline index gains are driven by a narrow cohort of large-cap stocks while the majority of constituents lag, is one of the more revealing signals produced by the price discovery system described in this article; the gap between cap-weighted and equal-weighted index performance can expose when price movements reflect concentrated positioning rather than broad participant consensus.
Retail investors access the output of this process through the Securities Information Processor (SIP), which consolidates real-time quote and trade data from all US exchanges into the single public feed displayed on brokerage apps and financial websites.
The participant spectrum is wider than most new investors realise. Institutional funds, market makers, and high-frequency trading (HFT) firms, together with institutional algorithmic traders, account for roughly 75-80% of US equity volume. Retail investors represent approximately 20-25%, up from around 10% before 2020.
HFT firms use co-located servers positioned physically adjacent to exchange matching engines, executing strategies in microseconds. Their role is contested: proponents argue they tighten spreads and improve liquidity, while critics argue they can disadvantage slower participants. Retail’s structural rise since 2020 reflects zero-commission trading, fractional shares, and mobile-first platforms.
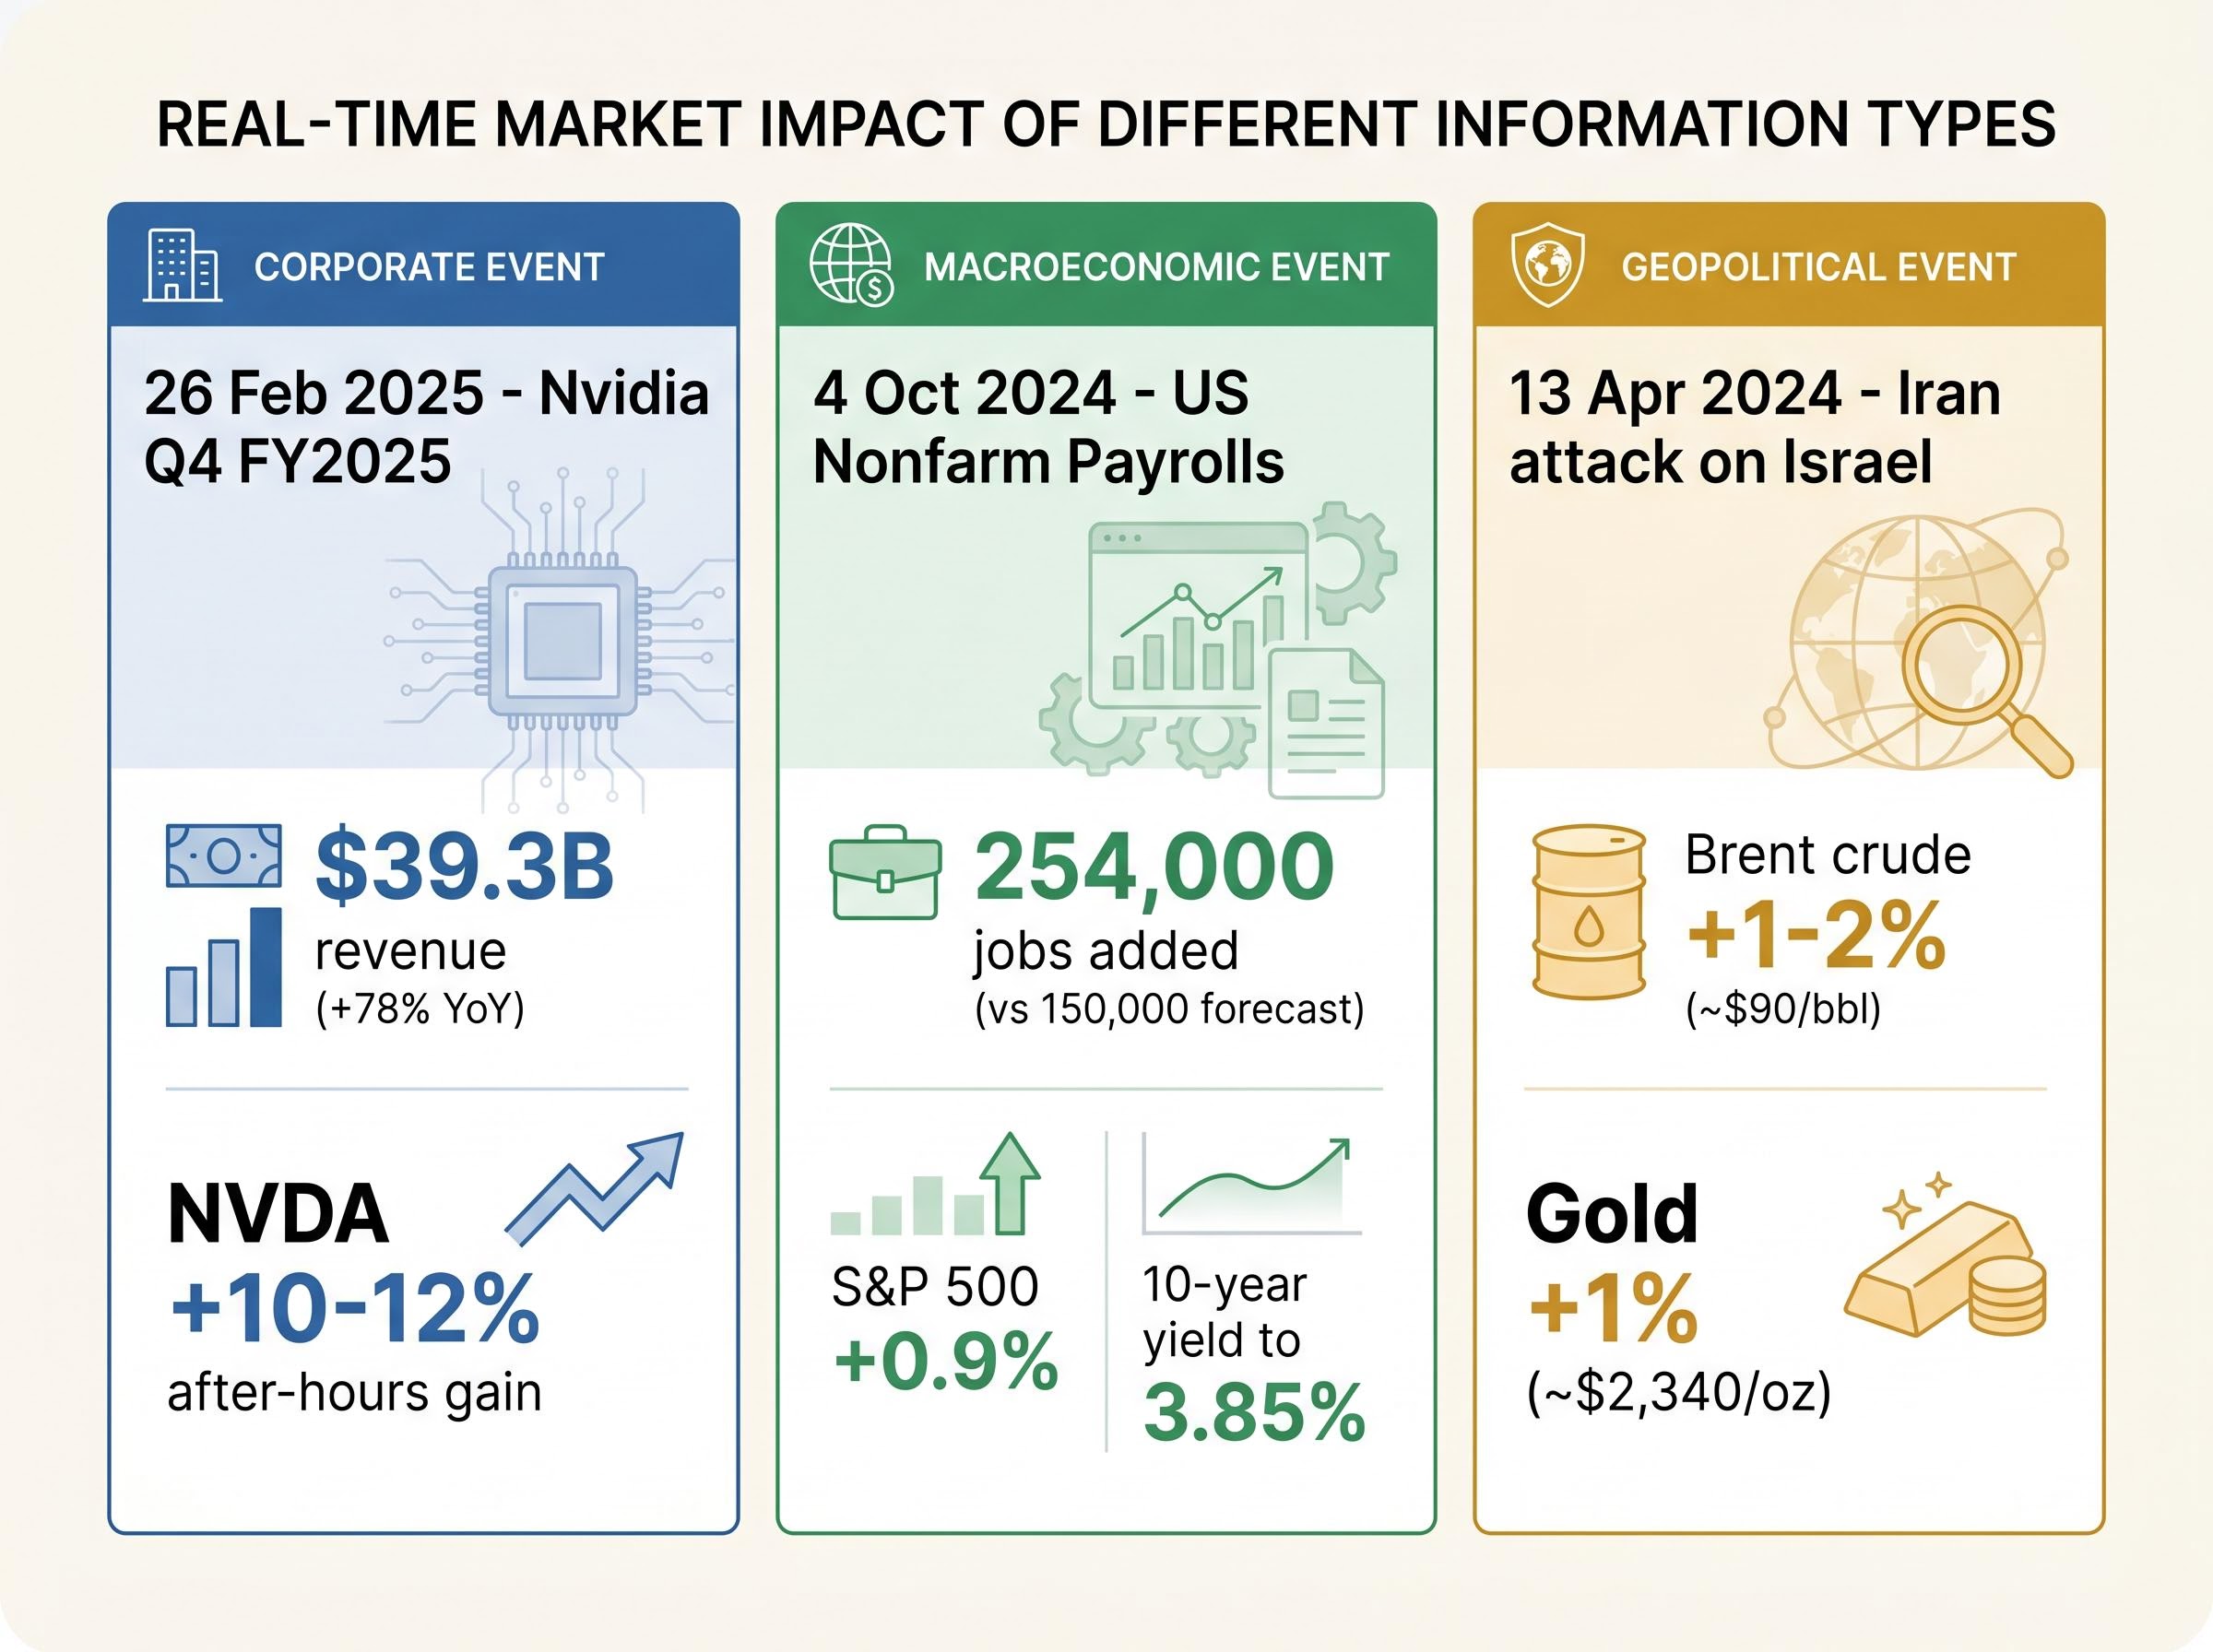
The mechanics described above become visible whenever new information enters the market. Three examples illustrate how different types of events create order flow imbalances and trigger repricing across asset classes.
| Event | Date | Asset Affected | Price Response |
|---|---|---|---|
| Nvidia Q4 FY2025 earnings beat | 26 February 2025 | NVDA (Nasdaq) | Approx. 10-12% after-hours gain |
| US nonfarm payrolls surprise | 4 October 2024 | S&P 500, 10-year Treasuries | S&P 500 up approx. 0.9%; 10-year yield rose to approx. 3.85% |
| Iran drone/missile attack on Israel | 13 April 2024 | Brent crude, gold | Brent up approx. 1-2% to ~$90/bbl; gold up approx. 1% to ~$2,340/oz |
Nvidia reported revenue of $39.3 billion, up 78% year-over-year. Nasdaq order books absorbed a surge of buy-side flow within minutes of the release, and the after-hours price reflected a new consensus valuation.
The September 2024 payrolls report showed 254,000 jobs added against a forecast of approximately 150,000. The stronger data caused markets to reduce expectations for aggressive Federal Reserve rate cuts, and the same release simultaneously repriced equities higher, bond prices lower, and rate expectations across the curve.
The geopolitical shock operated through a different channel: flight-to-safety flows drove buy-side pressure in commodity futures on ICE and Comex, pushing Brent crude and gold higher within minutes.
The relationship between geopolitical shocks and equity pricing is less straightforward than headlines suggest; markets process geopolitical events as probability-adjusted inputs to future earnings rather than proportional headline responses, which is why the same event can move commodity futures sharply while leaving the S&P 500 largely unchanged.
One data release, multiple markets, minutes to reprice. The electronic matching infrastructure described earlier is what makes this speed possible.
The same supply-and-demand logic that drives equity prices operates across the entire financial system. The plumbing differs, but the principle does not.
In fixed-income markets, bond prices and yields move inversely. The mechanics follow a logical sequence:
Bond markets are predominantly OTC, with price discovery occurring through dealer quote networks and electronic platforms such as Bloomberg Terminal and MarketAxess. An inverted yield curve, where short-term rates sit above long-term rates, has historically preceded recessions and remains one of the most closely watched macroeconomic signals. Credit spreads, the yield premium corporate bonds carry over comparable government bonds, widen during periods of market stress as investors demand higher compensation for default risk.
Forex price discovery is continuous and decentralised, with no single exchange or closing price. Currency pairs are priced through bid-ask spreads quoted by dealers and electronic communication networks. The main drivers are:
Derivatives (futures and options) derive their value from underlying assets and serve three primary functions: hedging, speculation, and risk transfer. Brent crude and gold futures prices, as cited in the examples above, move in regulated futures markets on exchanges such as ICE and Comex before influencing spot prices. Large moves in futures markets can propagate rapidly to underlying spot markets and vice versa, a dynamic that is central to understanding how stress transmits across the financial system.
Markets are engineered environments with explicit stability mechanisms. US equity markets use market-wide circuit breakers that halt trading when the S&P 500 declines from the prior day’s close:
The SEC’s Investor.gov circuit breaker reference confirms these three thresholds as the current market-wide framework, with each halt designed to give participants time to reassess order flow and restore orderly conditions before trading resumes.
Individual stocks have Limit Up-Limit Down (LULD) bands that pause trading if a security moves beyond defined price thresholds too quickly. These mechanisms were introduced following the May 2010 Flash Crash and have been refined since.
Markets are engineered systems with explicit stability mechanisms, not unstructured auctions. Circuit breakers, LULD bands, and regulatory oversight are built into the infrastructure by design.
Regulatory scrutiny extends to the exchanges themselves. ASIC fined the ASX $1.05 million in March 2024 for order information transparency failures. Kill switch protocols and circuit breakers have been mandated by regulators including the FCA following flash crash events. Quote stuffing, the practice of flooding order books with rapid-fire quotes, remains a focus of HFT regulation.
On the retail side, payment for order flow (PFOF) is an area of ongoing oversight. Robinhood and Charles Schwab collected $281 million in cash-equity PFOF revenue in Q4 2025 alone, a figure that illustrates the scale of the practice and why regulators continue to scrutinise how retail orders are routed.
The structural picture covered in this article compresses into three orientation points for new market participants:
Retail participation in global equity markets has grown structurally, from roughly 10% of US equity volume pre-2020 to approximately 20-25% by 2025. T+1 settlement (effective May 2024) has improved capital efficiency. Platform features such as fractional shares and Level 2 order book data (available through platforms like Webull) give new entrants access to information that was previously reserved for institutional participants. The barriers to entry have lowered; the need for foundational understanding has not.
Index concentration risk has become an increasingly material consideration for passive investors as a small number of mega-cap technology firms now account for more than 30% of S&P 500 weighting, meaning a broad index ETF provides far less diversification across its 500 constituents than the headline number implies.
Financial markets are not opaque or arbitrary. They are rule-based systems with discoverable mechanics: centralised order books matching bids and offers through price-time priority, prices discovered through continuous auction rather than set by any authority, and information flowing from announcement to price change in seconds.
Understanding how markets work is not the end of financial education. It is the foundation on which every subsequent concept builds, from evaluating what to invest in to interpreting economic data releases and constructing a portfolio. The structural knowledge covered here gives readers a framework for processing the price movements they see every day, not as random fluctuations, but as the output of a system operating exactly as designed.
This article is for informational purposes only and should not be considered financial advice. Investors should conduct their own research and consult with financial professionals before making investment decisions.
Price discovery is the continuous process by which competing buy and sell orders in an order book reveal a consensus price moment to moment. No single authority sets prices; they emerge from a decentralised auction where every matched trade registers the most recent agreement between a buyer and a seller.
A market order executes immediately at the best available price, prioritising certainty of execution, while a limit order executes only at a specified price or better, prioritising certainty of price. A limit order does not guarantee execution if no counterparty is willing to trade at that level.
US equity market circuit breakers halt trading when the S&P 500 declines 7% (15-minute halt), 13% (15-minute halt), or 20% (halt for the remainder of the day) from the prior day's close. These thresholds are designed to give participants time to reassess order flow and restore orderly conditions before trading resumes.
When demand for a bond increases and its market price rises above face value, the fixed coupon payments become a smaller percentage of that higher price, which means the effective yield falls. The inverse relationship is a mathematical consequence of how bond returns are calculated.
Retail investors represent approximately 20-25% of US equity volume as of 2025, up from around 10% before 2020. This structural rise reflects the growth of zero-commission trading, fractional shares, and mobile-first brokerage platforms.