How Comcast’s Split Ends a Decade of Conglomerate Discount
37 mins ago
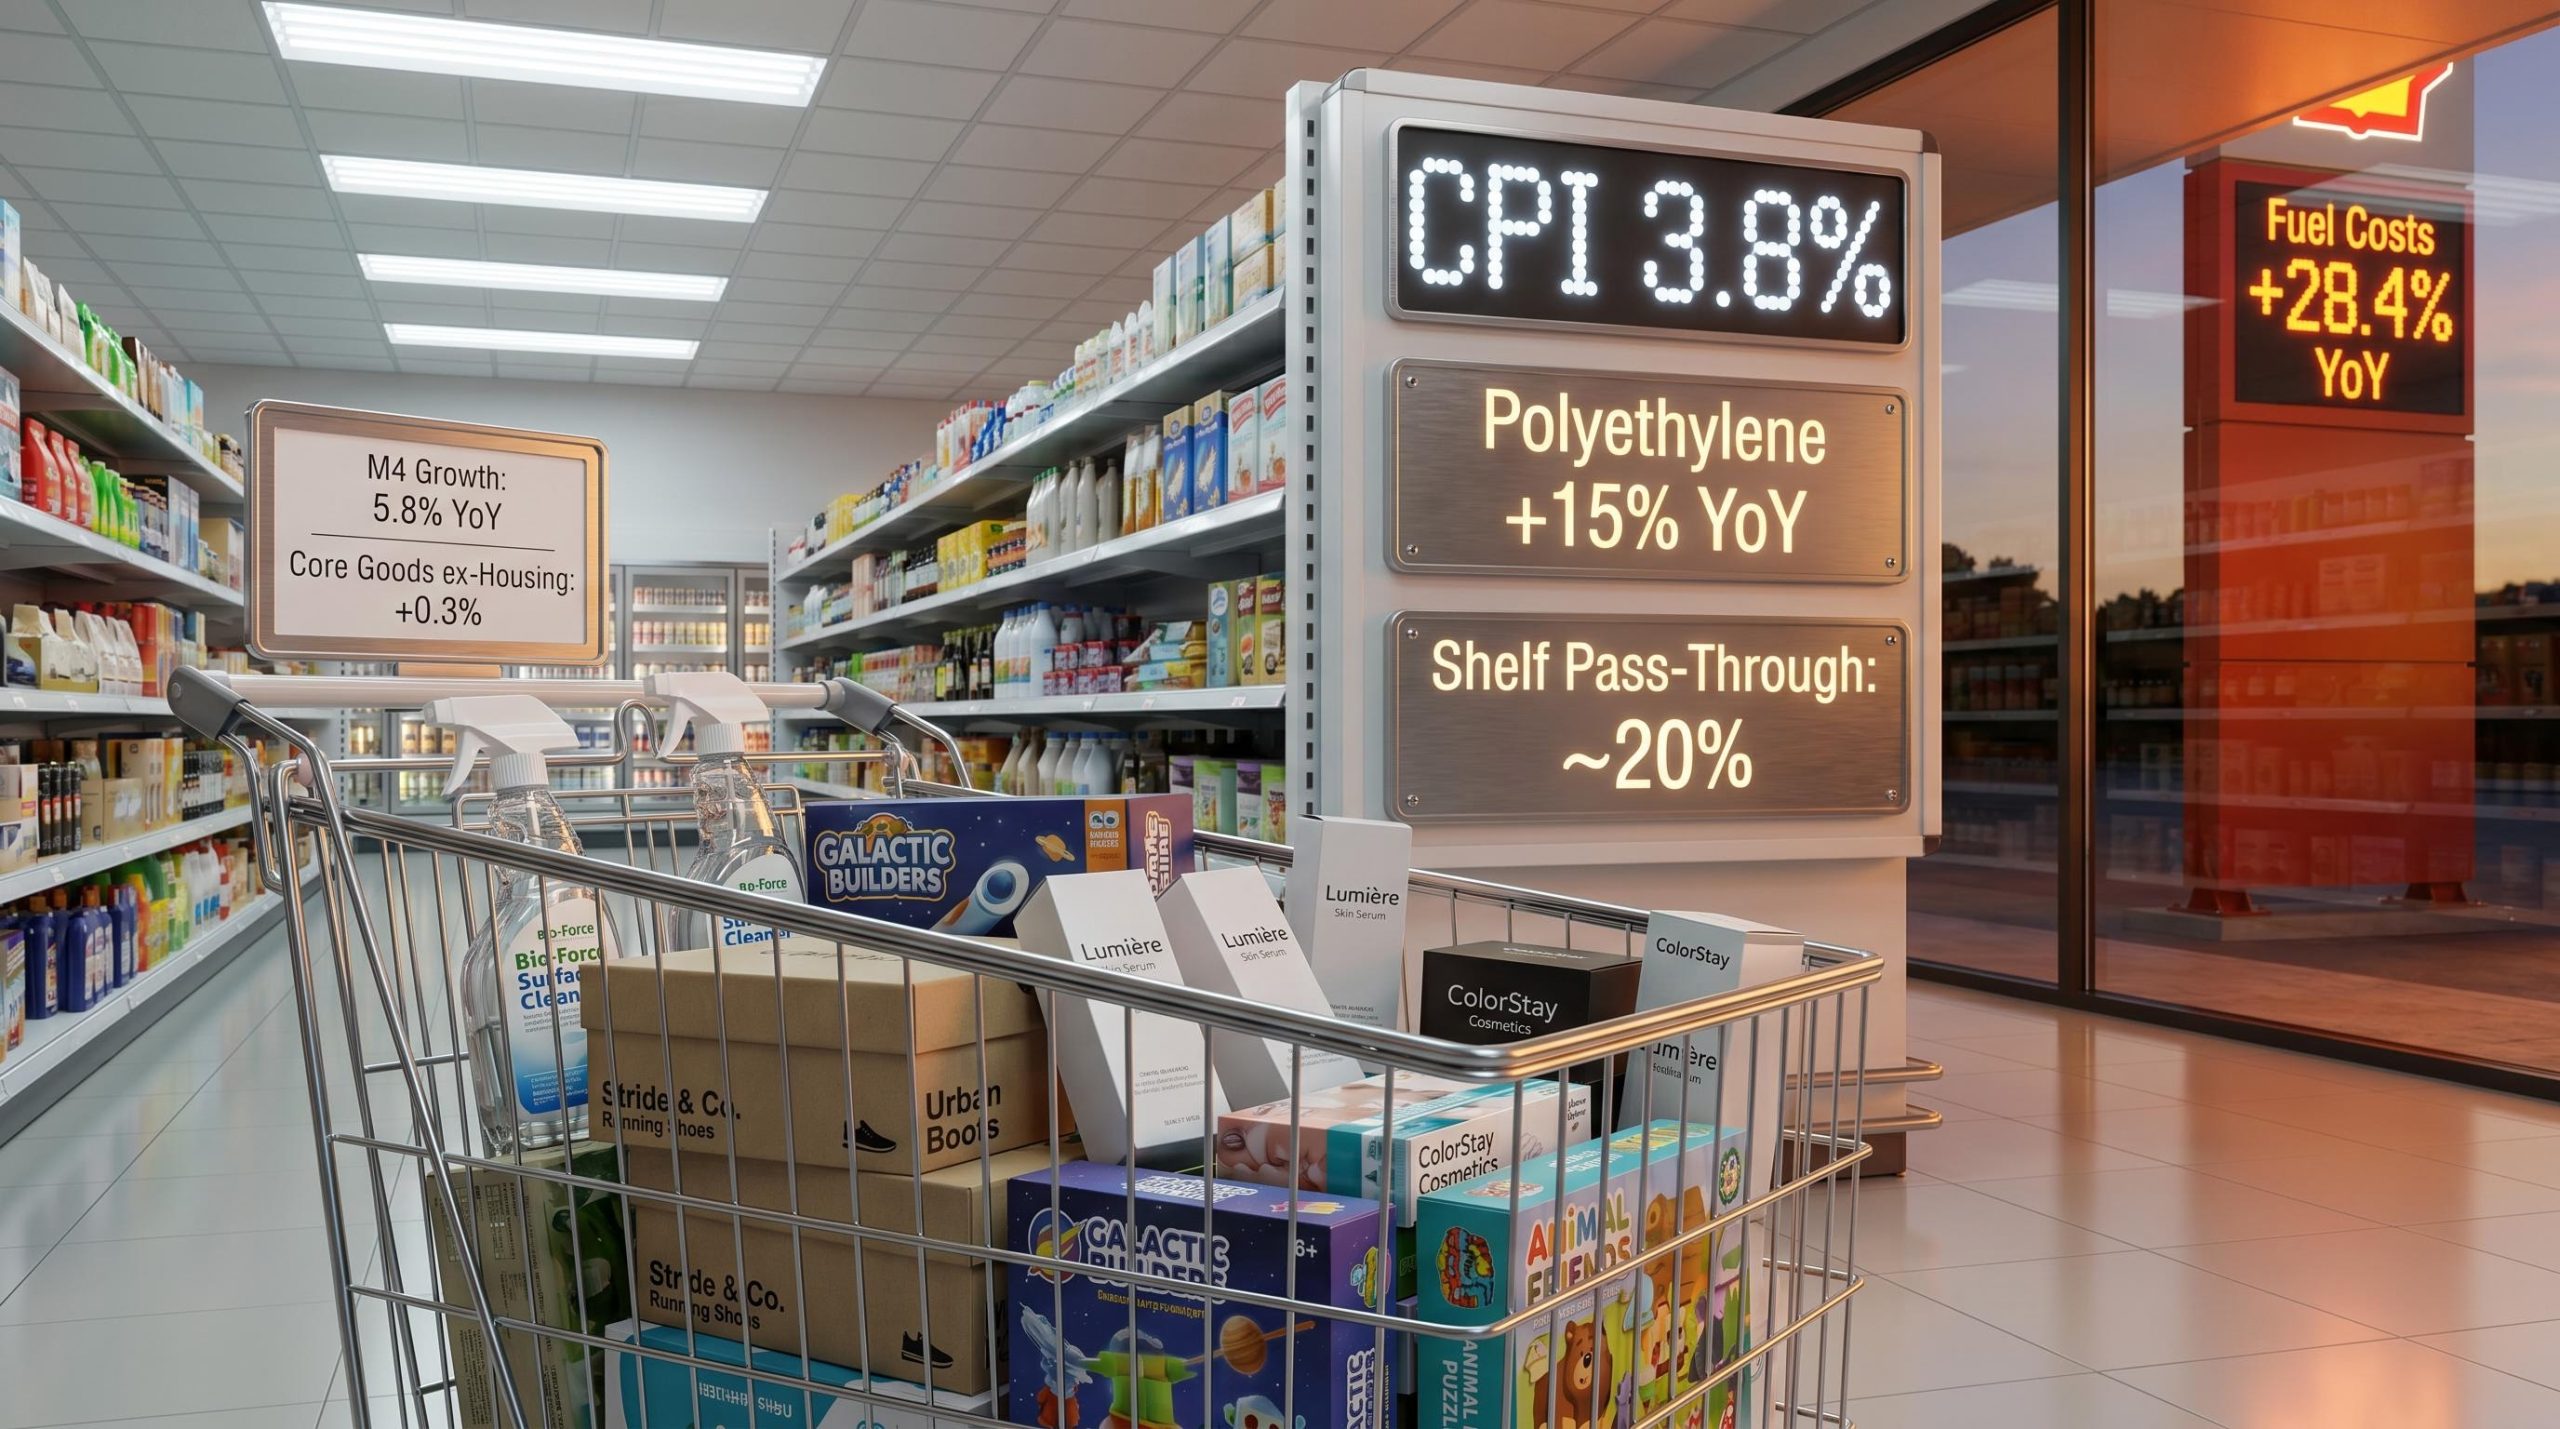
Fuel costs surged 28.4% year-over-year in April 2026, pushing headline CPI to 3.8%, the highest reading in three years. The question shaping the inflation outlook now is whether oil-driven price pressure stays contained in energy or spreads into the consumer goods that fill shopping carts and store shelves.
April’s Bureau of Labor Statistics (BLS) data offered the first comprehensive look at whether upstream petrochemical cost pressures, building since Q1 2026, have begun flowing through to retail prices. The answer so far is mostly no, but that answer has a time limit attached to it, and the conditions sustaining it are worth understanding in detail. What follows is a category-level walkthrough of where second-order effects have and have not appeared, an explanation of why money supply dynamics make this episode structurally different from 2021-2022, and an identification of the specific thresholds and timelines investors should track to assess whether the current containment holds.
The producer price data tells a straightforward story of rising input costs. BLS figures for April 2026 show plastics up 4.2% year-over-year, synthetic rubber up 6.1%, and mineral oils up 9.8%, driven directly by elevated crude prices. Polyethylene, a feedstock running through packaging, toys, and footwear components, climbed approximately 15% year-over-year. Plastics feedstock costs broadly have risen roughly 12% since the start of Q1 2026.
These are material increases. They flow into cleaning product formulations, shoe soles, cosmetics packaging, and plastic toy components.
The retail side of the ledger tells a different story. Household cleaning products actually fell 0.7% month-over-month in April. Footwear rose 1.4% month-over-month; cosmetics edged up 1.3%. Toys climbed 0.9%, a notable slowdown from the 2.0% month-over-month increase recorded in March.
On a year-over-year basis, the gap is striking. Cosmetics CPI sits at 1.8% year-over-year. Footwear and toys are running at 0.5-1% year-over-year, despite the 15% surge in polyethylene feeding their supply chains.
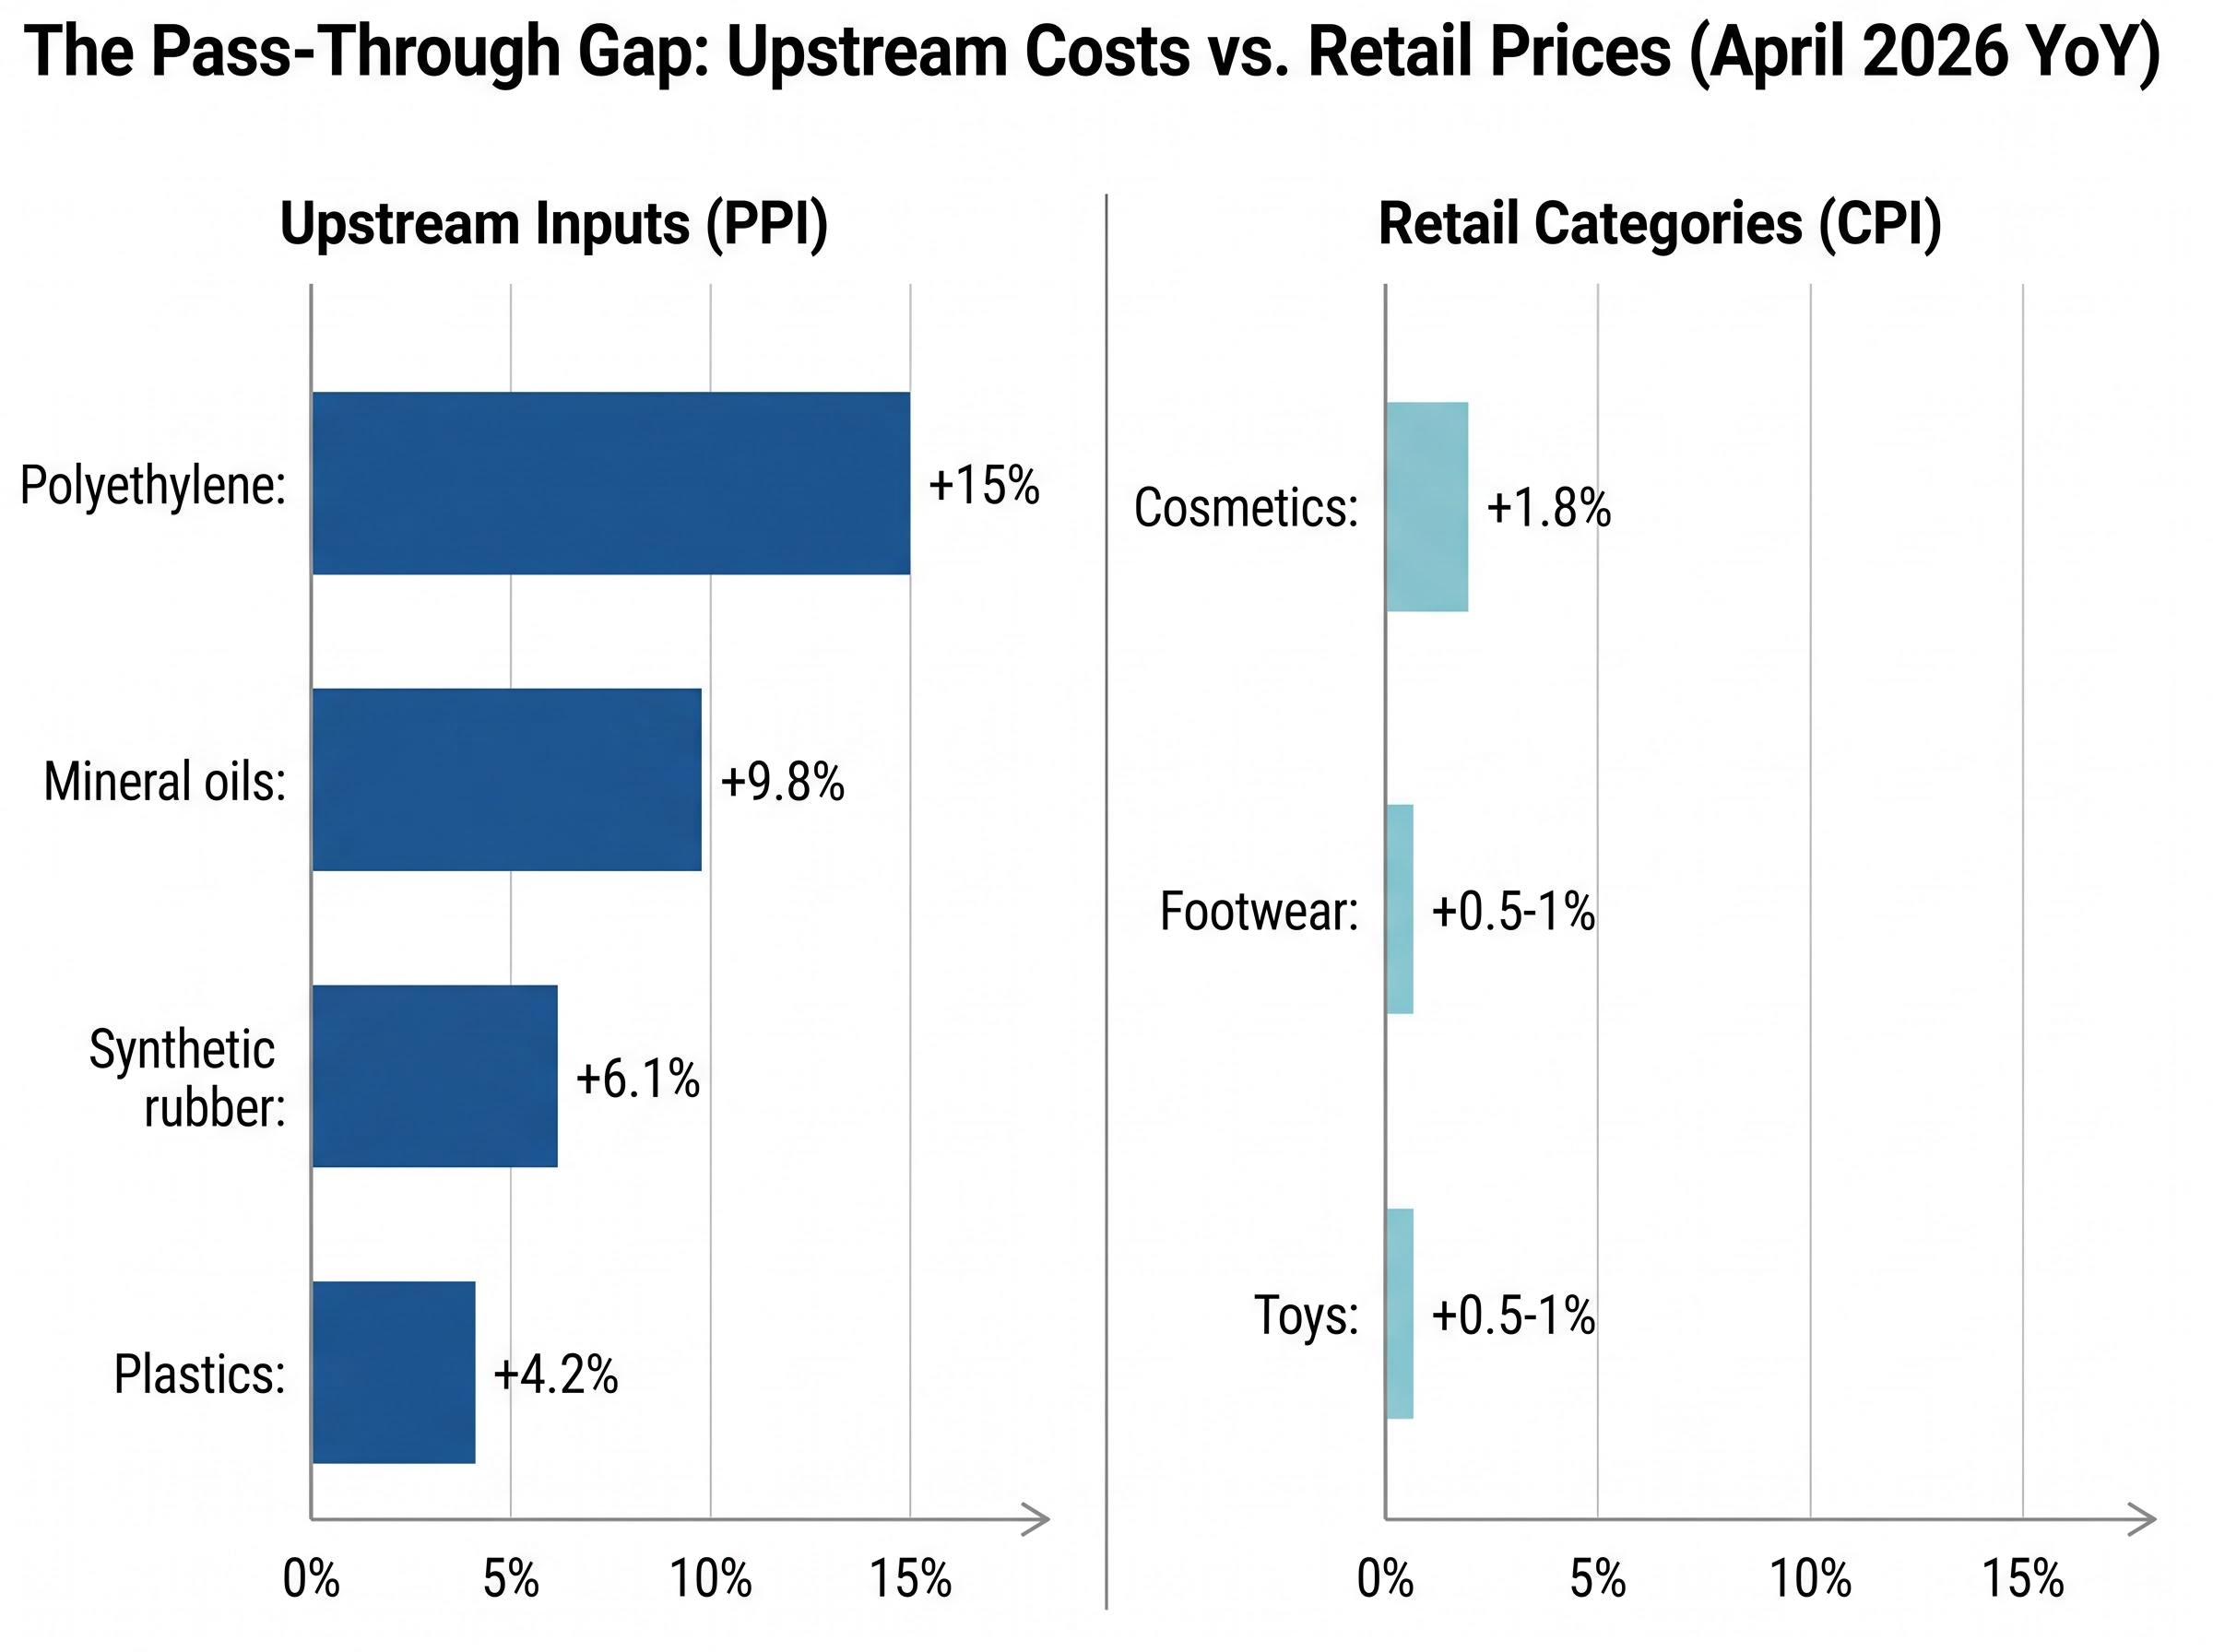
| Upstream Input (PPI) | YoY Change | Retail Category (CPI) | YoY Change |
|---|---|---|---|
| Plastics | +4.2% | Cleaning products | -0.7% MoM |
| Synthetic rubber | +6.1% | Footwear | +0.5-1% |
| Mineral oils | +9.8% | Cosmetics | +1.8% |
| Polyethylene | +15% | Toys | +0.5-1% |
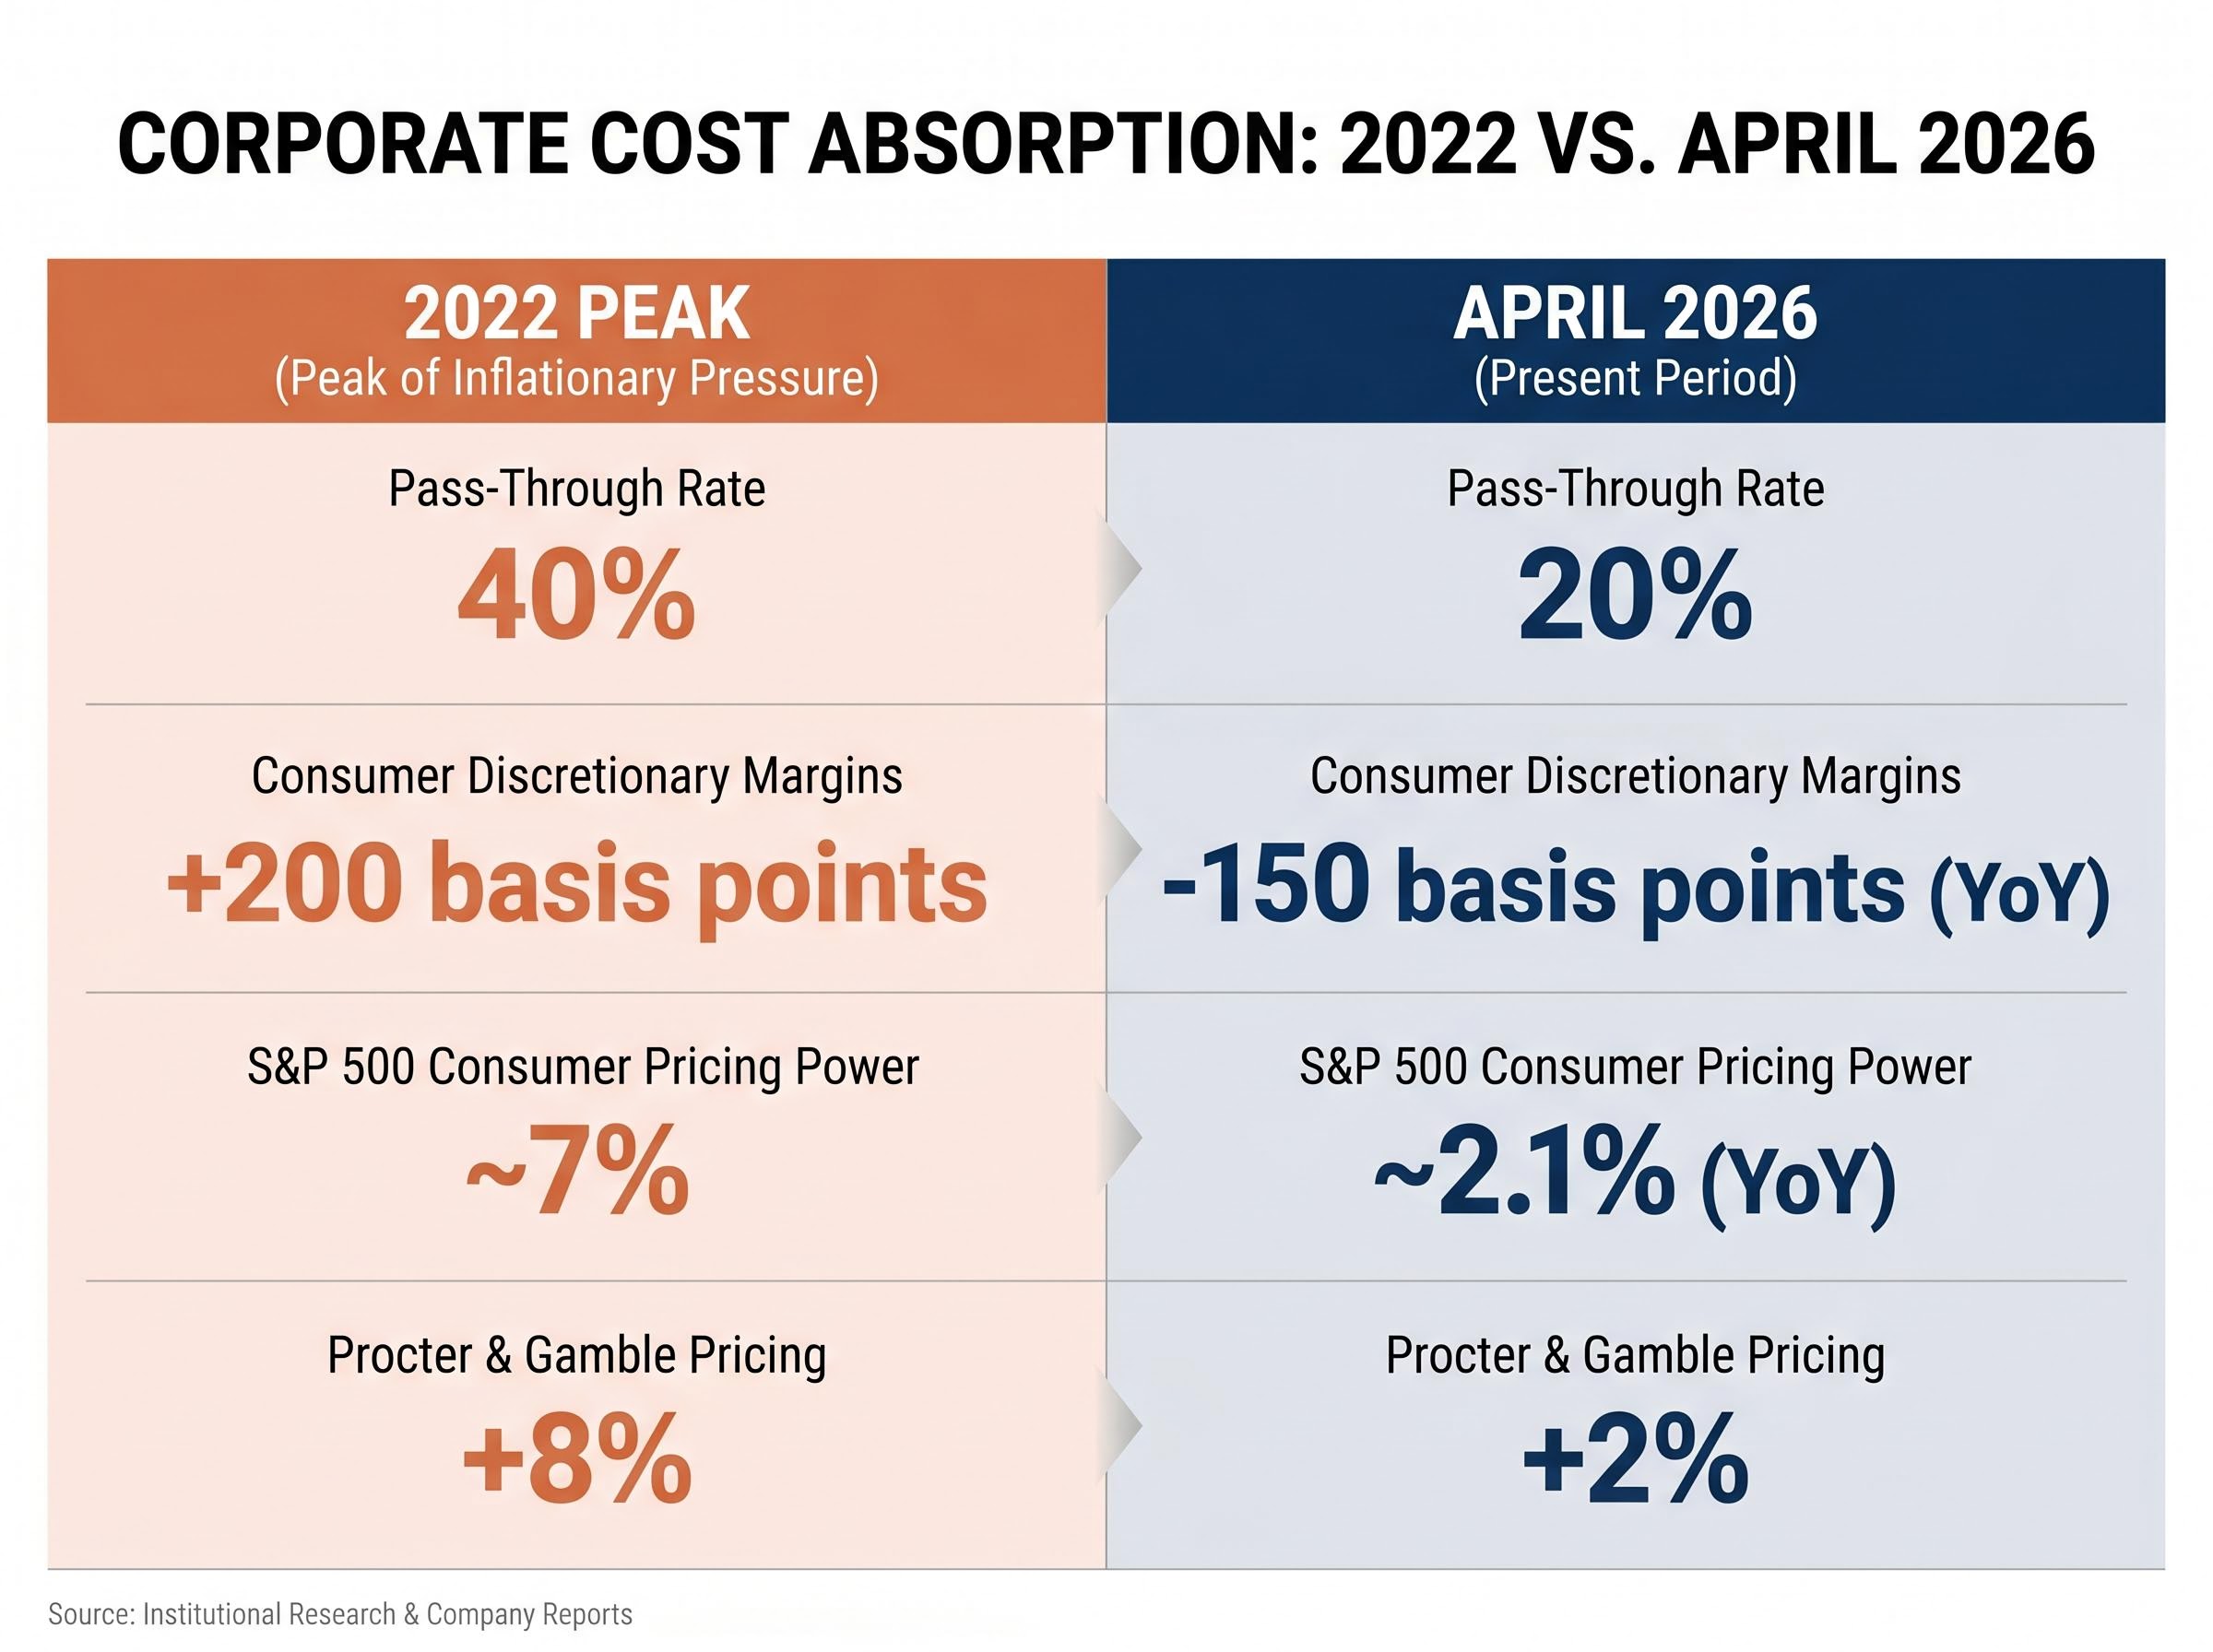
Approximately 20% of the roughly 11% aggregate petrochemical cost increase has filtered through to retail prices. During the 2022 episode, that pass-through rate was closer to 40%. The gap between input costs and shelf prices is not a measurement artefact. It is the product of deliberate corporate behaviour, and understanding why it persists is the key to reading what comes next.
The April CPI surprise, which printed at double the consensus monthly forecast and pushed the annualised rate to 3.8%, triggered a sharp repricing of the Fed rate path, with year-end hike probability rising to roughly 30% and major Wall Street banks pushing first-cut forecasts toward 2027.
Approximately 65% of consumer discretionary firms, including Nike and Hasbro, reported no oil-related pass-through pricing during Q1 2026 earnings season. Gross margins across the sector fell 150 basis points year-over-year, a direct cost absorption. In 2022, by contrast, consumer discretionary margins expanded by 200 basis points as firms raised prices ahead of input costs.
Procter & Gamble made the dynamic explicit on its 24 April earnings call.
“Absorbing petrochemical costs to defend volumes,” with pricing up 2% versus 8% in 2022.
That is the corporate calculus in a single sentence: volume preservation over margin protection. Aggregate pricing power across S&P 500 consumer companies runs at approximately 2.1% year-over-year in April 2026 comparables, against roughly 7% during the 2022 peak. Discretionary pricing is flat in 2026 versus a 10% surge at the 2022 high-water mark.
Four structural conditions explain why firms are choosing absorption over pass-through:
Demand softness in discretionary categories is not a theoretical constraint on pass-through pricing in 2026; Whirlpool’s North American operating profit collapsed 96% in Q1, and McDonald’s earnings confirmed a widening income fault line between value-tier and premium consumers, giving manufacturers concrete evidence that raising prices risks accelerating volume loss rather than restoring margins.
For equity investors, this reframes the immediate question. Oil is currently an earnings risk for consumer discretionary names, not a CPI risk. Margin compression (running approximately 1.8% in aggregate ex-food and energy) affects sector valuations differently than a sustained goods inflation breakout would.
Businesses can only sustain price increases when demand conditions support them. A manufacturer can raise the wholesale price of a cleaning product, but the increase only sticks if households are willing and able to absorb it. That willingness historically requires either strong wage growth or significant monetary expansion to maintain purchasing power across the economy.
When money supply growth is elevated, consumers have more liquidity to absorb higher prices without reducing volume. When it is restrained, households facing higher costs in one area (fuel, for instance) reduce spending in others (discretionary goods), which punishes any firm that raises prices into that softness. That demand destruction mechanism is the reason money supply growth functions as a ceiling on how far any cost-push shock can travel through the economy.
The contrast with the 2021-2022 inflation episode is not subtle. M4 (the Center for Financial Stability’s broader monetary aggregate, which includes Treasury bills and money market funds) exceeded 30% year-over-year growth in the summer of 2020. That surge preceded and enabled the broad-based inflation that followed. M2 growth exceeded 20% in the same period.
As of March 2026, M2 growth stands at approximately 4.6% year-over-year, per the Federal Reserve’s H.6 release. M4 sits at 5.8% year-over-year, according to the Center for Financial Stability.
The Federal Reserve H.6 release tracking M2 growth is the primary data source for the monetary aggregate figures cited throughout this analysis, and the May 28 publication will be the first update to incorporate April conditions following the fuel cost surge.
The Center for Financial Stability characterises current M4 growth as signalling a “deflationary bias” that caps inflation at 3-4% even with oil spikes. M4 at 5.8% year-over-year, March 2026.
The monetary precondition that enabled 2022’s broad goods inflation is not present. A repeat of that episode would require a monetary acceleration that current Fed policy is specifically designed to prevent. The next H.6 release, due 28 May 2026, will provide April M2 figures and the first update to this picture since the fuel cost surge intensified.
Fixed income markets offer an independent cross-check on the goods inflation question, and the signal is calibrated rather than one-directional.
Inflation swaps price headline CPI at approximately 3.7% annualised for 2026, with core CPI around 2.6-2.7%.
RSM US analysis indicates inflation swaps may be underpricing the risk of rising headline CPI given current conditions, a contrarian note against the prevailing contained-outlook view.
The gap between the 5-year and 10-year breakevens tells investors something specific about timing conviction. Near-term uncertainty is elevated; longer-run confidence in the Fed’s ability to keep inflation anchored remains intact. For portfolio positioning purposes, the 5Y5Y rate at 2.27% suggests the bond market views the current episode as a transitory oil shock, not a structural inflation regime change.
The contained scenario rests on specific conditions, and different institutions have mapped the points at which those conditions would begin to fail.
| Institution | Oil Price Threshold | Projected Impact |
|---|---|---|
| Federal Reserve (Chair Powell, 10 May) | $90/bbl Brent sustained | Cascade risks into discretionary items (apparel, toys) |
| J.P. Morgan (12 May) | $85/bbl average for H2 2026 | +1.2% price hikes in electronics and plastics; 25% probability of broad goods inflation |
| Bank of America | $100/bbl Brent | Broader tipping point; footwear CPI at 2.1% YoY cited as early signal |
These thresholds reflect different risk frameworks, but all sources align directionally: sustained elevated oil prices represent a meaningful risk to the current containment. The IMF estimates that 10-15% of petrochemical input costs have not yet filtered through, with potential to add 0.4% to core CPI by year-end if upstream costs remain unmitigated.
Oil shock transmission channels beyond petrochemical inputs include reduced consumer disposable income, rising business input costs across non-petrochemical categories, Federal Reserve rate pressure, and a pullback in investment and hiring, meaning the current article’s focus on goods pass-through captures one vector of a multi-channel macro risk that has preceded every major U.S. recession since 1973.
Q3 2026 is the period when inventory buffers are most likely to thin, and when oil price persistence would begin to shift the calculus for manufacturers weighing volume protection against margin erosion.
Two structural factors deserve attention as the more persistent inflation contributors, distinct from the oil and goods channel:
The federal funds rate sits at 4.75-5.00%, with markets pricing two cuts by end-2026, contingent on inflation cooling toward 2.5%. The Fed has signalled it will not cut preemptively, watching for sustained disinflation across both goods and services.
Approximately 60% of strategists surveyed see no major spread to discretionary categories by June. That consensus holds only if Brent remains below the $85-$90 range through Q3 under current monetary conditions.
The analytical case for containment rests on three structural conditions, each currently intact:
Goldman Sachs reference data shows core goods ex-housing at just a 0.3% year-over-year rise as of April BLS figures. Corporate pricing power at 2.1% year-over-year, against 7% in 2022, confirms that firms lack the market conditions to change this dynamic unilaterally.
The distinction that matters for investors is between the earnings risk and the inflation risk. Margin compression in consumer discretionary is the near-term equity concern. CPI broadening into goods remains a tail scenario under current monetary conditions. These call for different responses: the first is a sector positioning question; the second is a macro allocation question.
Two variables determine whether the contained scenario holds: Brent crude relative to the $85-$90/bbl threshold range, and M2 growth trajectory (next data point: 28 May H.6 release for April figures). Q3 2026 is the next evaluation window where both variables converge with thinning inventory buffers.
For readers tracking how long the current containment can hold across the broader macro picture, our full explainer on June 2026 recession buffers maps the seven structural factors BCA Research identifies as absorbing the Hormuz shock, explains why Q3 2026 is when inventory depletion, transmission lag, and futures repricing converge, and provides the institutional probability estimates ranging from 20% to 70% across major forecasters.
This article is for informational purposes only and should not be considered financial advice. Investors should conduct their own research and consult with financial professionals before making investment decisions. Past performance does not guarantee future results. Financial projections are subject to market conditions and various risk factors.
Cost pass-through is when businesses transfer rising input costs, such as higher oil or petrochemical prices, to consumers through higher retail prices. It matters because the degree of pass-through determines whether an upstream commodity shock becomes broad consumer inflation or stays contained as a corporate earnings problem.
Three structural conditions are suppressing pass-through: companies like Procter and Gamble and Nike are absorbing costs to defend sales volumes, post-2022 inventory buffers are insulating retailers from immediate input cost volatility, and M4 money supply growth of only 5.8% year-over-year removes the demand-side support businesses would need to sustain price increases.
Major institutions identify a range of thresholds: the Federal Reserve flags $90 per barrel Brent sustained as a cascade risk into apparel and toys, J.P. Morgan cites $85 per barrel average for H2 2026 as triggering a 25% probability of broad goods inflation, and Bank of America points to $100 per barrel as a broader tipping point.
The 2021-2022 inflation surge was enabled by M2 money supply growth exceeding 20% and M4 exceeding 30% year-over-year, which gave consumers the liquidity to absorb higher prices across all categories. In 2026, M2 growth stands at approximately 4.6% and M4 at 5.8%, removing the monetary foundation that made broad goods inflation possible last time.
The two key variables are Brent crude relative to the $85-$90 per barrel threshold and M2 growth from the Federal Reserve H.6 release, with the next publication due 28 May 2026 providing the first April money supply figures since the fuel cost surge intensified. Q3 2026 is the critical window when inventory buffers are expected to thin and both variables converge.