VAS vs VHY: Why the Lower-Yield ETF Wins in Retirement
2 hrs ago

Most homeowners searching for the answer to whether they should invest or pay off their mortgage expect a clean mathematical verdict. The math, however, has a poor track record of producing good real-world outcomes on its own. Survey data from the National Association of Realtors and Bank of America found that 25-30% of homeowners who aggressively prepaid their mortgages later regretted the decision after encountering unexpected repair costs, job disruptions, or medical expenses. With the 30-year fixed rate averaging 6.37% as of early May 2026, according to the Freddie Mac Primary Mortgage Market Survey, the question sits in genuinely ambiguous territory. That rate falls close enough to the analytical breakeven zone (roughly 6.0%-6.5%) that the right answer depends heavily on factors the spreadsheet ignores: liquidity access, tax situation, behavioural tendencies, and whether the homeowner has completed the financial steps that should come before this decision even arises.
This guide delivers four things: a priority sequence to run before the mortgage-versus-investing question becomes relevant, a behavioural self-assessment to identify whether index-like returns are realistically within reach, a tax framework showing how itemising status changes the effective rate, and a rate-tiered decision matrix calibrated to specific mortgage cohorts.
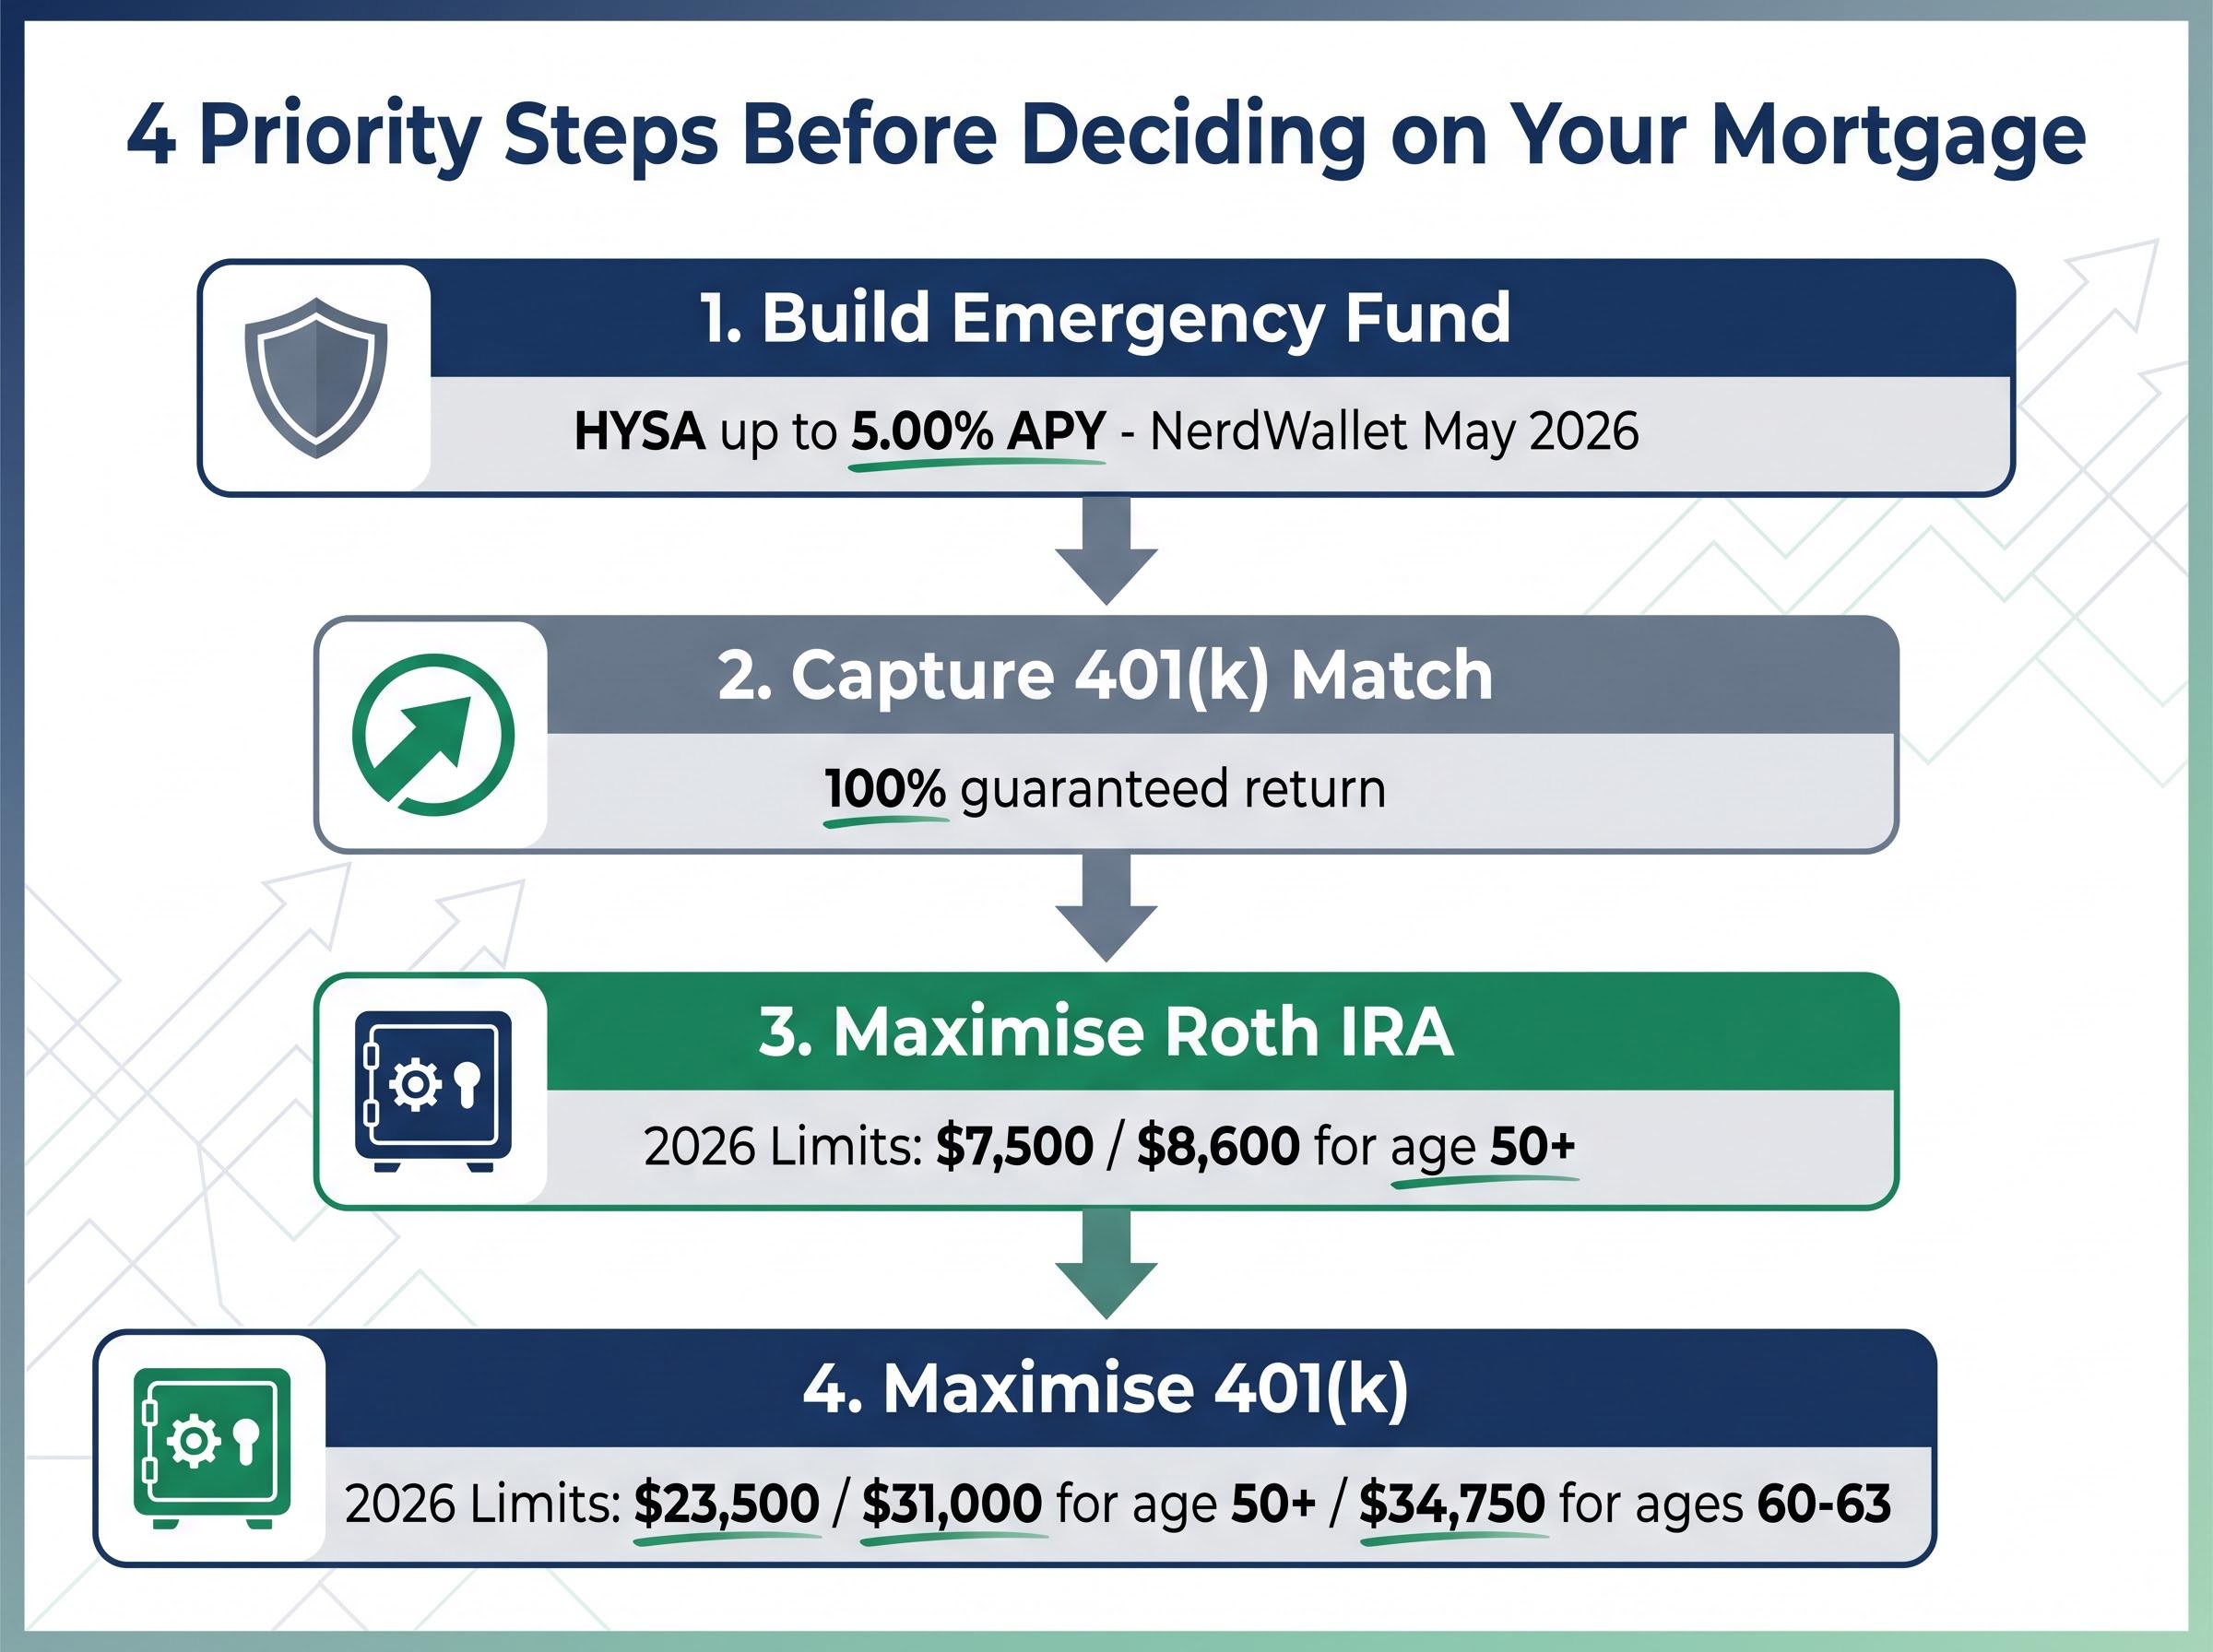
The decision between investing and mortgage prepayment is not the first question to answer. It is the last. Four steps carry higher guaranteed returns, lower risk, or both, and completing them changes the calculus of everything that follows.
Before the mortgage-versus-investing trade-off becomes the central question, investing vehicle selection shapes how much of any gross return a homeowner actually keeps: a 0.90% annual fee difference on a $10,000 position compounds to roughly $6,000 in lost growth over 20 years at a 7% gross return, which means the account type and fund structure decisions carry nearly as much weight as the mortgage-versus-prepay call itself.
“Skipping your employer’s 401(k) match to pay down a 6.37% mortgage means forfeiting a 100% guaranteed return to eliminate a 6.37% cost. The math does not support that trade.”
Only after completing all four steps does the mortgage-versus-investing question become the right one to ask. At that point, the homeowner has secured their emergency reserves, captured every guaranteed and tax-advantaged return available to them, and the surplus cash that remains is genuinely discretionary. The sections that follow provide the rate-based, tax-adjusted, and behavioural framework for deploying it.
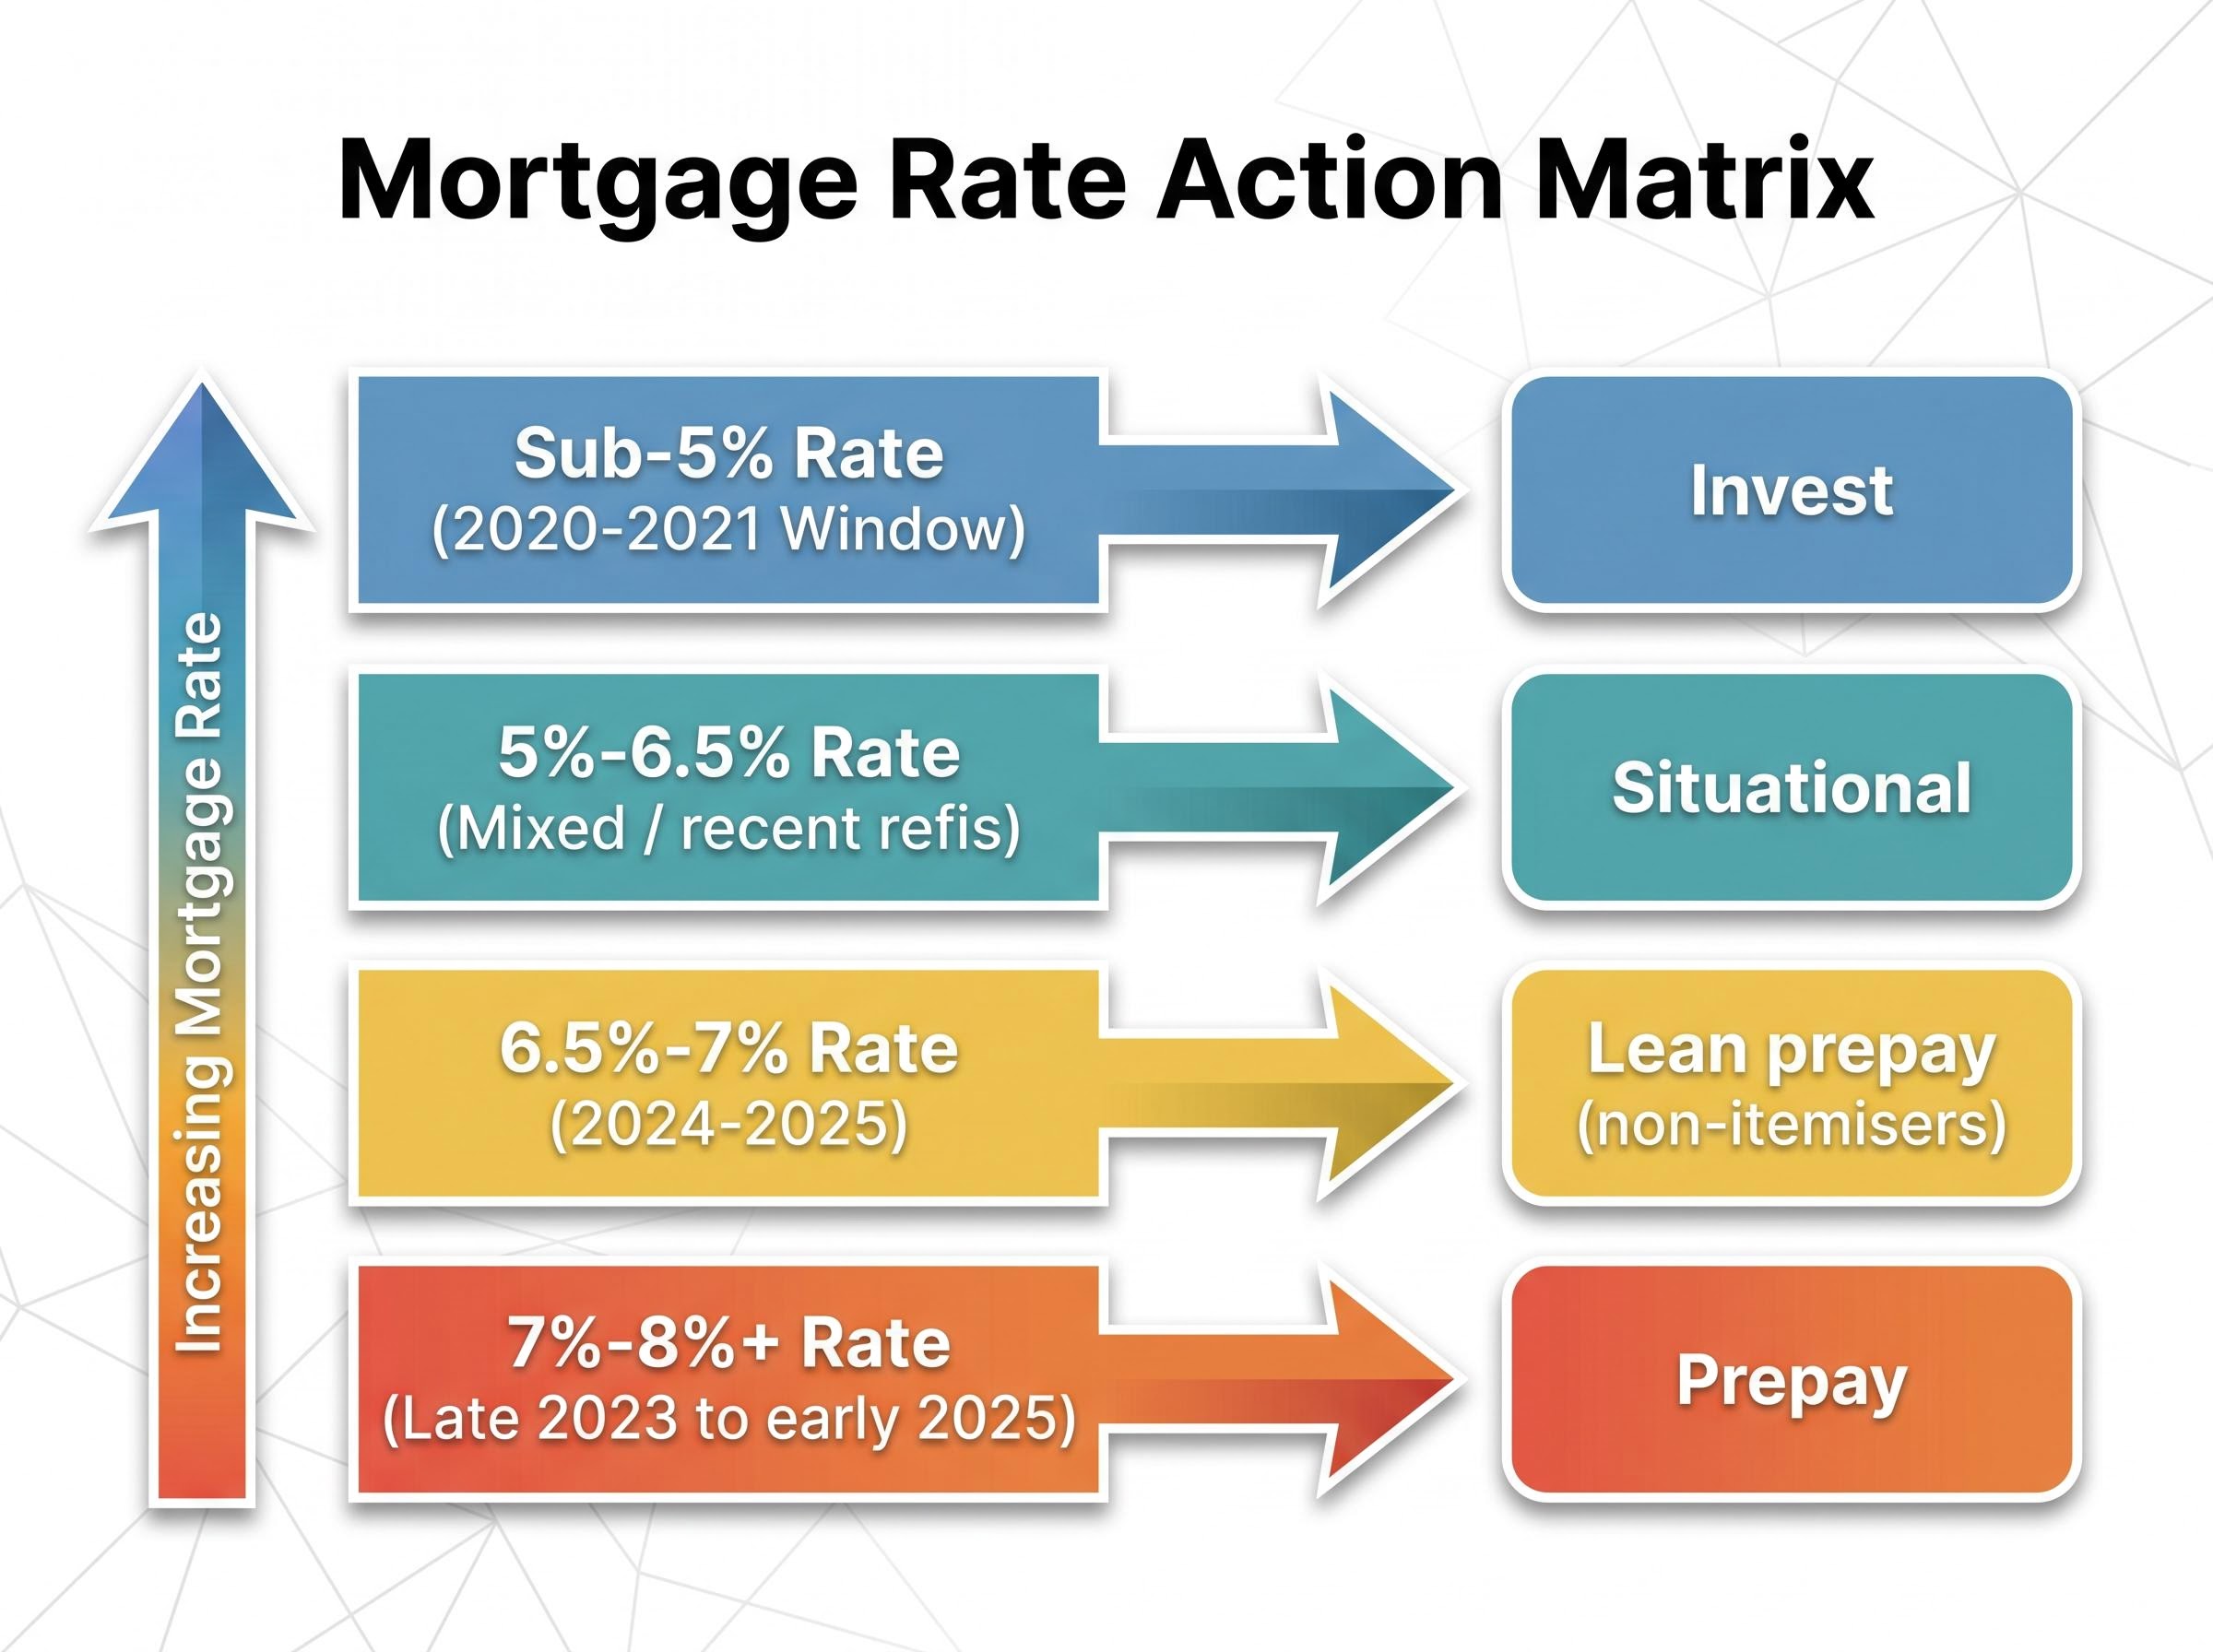
Not all homeowners face the same decision. A borrower who locked in a 3.5% rate during the 2020-2021 origination window and a borrower sitting at 7.5% from a late 2023 closing are in structurally different positions, even though the same question brought them here.
The S&P 500 has returned approximately 10.2% annualised over the long term and roughly 12.5% over the most recent 10-year period (2016-2025). Those returns form the investing side of the equation. The mortgage rate forms the other. Where a homeowner sits on the rate spectrum determines which side of the breakeven zone they fall on, and how much individual factors (tax status, behaviour, time horizon) need to do to tip the balance.
| Mortgage Rate Cohort | Origination Window | Invest vs. Prepay Lean | Key Condition | Priority Action |
|---|---|---|---|---|
| Sub-5% | 2020-2021 | Invest | Spread over expected returns is wide | Maximise tax-advantaged and taxable investing |
| 5%-6.5% | Mixed / recent refis | Situational | Tax and behavioural factors are decisive | Run tax and behavioural assessment below |
| 6.5%-7% | 2024-2025 | Lean prepay (non-itemisers) | Spread narrows; guaranteed return competitive | Hybrid split or prepay if standard deduction |
| 7%-8%+ | Late 2023 to early 2025 | Prepay | Guaranteed return exceeds realistic net equity returns | Accelerate prepayment; refinance if rates fall |
Homeowners with sub-5% mortgages should not be influenced by current-rate headlines. Their personal breakeven calculus has nothing to do with today’s 6.37% average. At the other end, borrowers in the 7%-8%+ cohort face a guaranteed return from prepayment that competes with, and for many investors exceeds, what they would realistically capture in the equity market after accounting for behavioural drag and taxes on gains.
The number on the mortgage statement may not be the number that matters. For homeowners who itemise their deductions, the mortgage interest deduction reduces the effective cost of borrowing, sometimes substantially.
Under current rules (IRS Publication 936, 2026), mortgage interest on up to $750,000 in acquisition debt remains deductible for those who itemise. The Tax Cuts and Jobs Act framework, which significantly raised the standard deduction and reduced the number of Americans who itemise, remains in effect through at least 2026.
IRS Publication 936 governs the home mortgage interest deduction and sets the $750,000 acquisition debt ceiling that determines how much interest a homeowner can deduct, a threshold that directly shapes the after-tax rate calculations in the table above.
The practical effect is straightforward. A homeowner in the 24% federal tax bracket with a 6.37% nominal mortgage rate pays an effective after-tax rate of approximately 4.84%. In the 32% bracket, that effective rate drops to roughly 4.33%. At 4.33%, the mathematical case for investing over prepayment is considerably stronger, because expected long-term equity returns sit well above that threshold.
| Tax Situation | Nominal Rate | Effective After-Tax Rate | Invest vs. Prepay Lean |
|---|---|---|---|
| Itemiser, 24% bracket | 6.37% | ~4.84% | Invest |
| Itemiser, 32% bracket | 6.37% | ~4.33% | Strongly invest |
| Standard deduction filer | 6.37% | 6.37% | Borderline; personal factors decisive |
“If you itemise and fall in the 32% bracket, your 6.37% mortgage effectively costs you closer to 4.33% after the interest deduction. At that rate, the mathematical case for investing is considerably stronger.”
The catch is that many homeowners assume they receive this benefit when they do not. Since the 2017 TCJA raised the standard deduction, fewer Americans itemise. Those taking the standard deduction receive no marginal tax benefit from mortgage interest and face the full 6.37% effective rate, which places them squarely in the breakeven zone where behavioural and liquidity factors become the deciding variables.
Every dollar of extra mortgage payment builds equity. That equity appears on the balance sheet as wealth. But it cannot be spent, invested, or deployed in an emergency without either selling the home or taking on new debt, typically at a higher rate than the original mortgage.
This distinction matters more than most homeowners appreciate. A homeowner who directs all surplus cash into prepayment may build substantial equity while simultaneously losing the financial flexibility to handle the disruptions that homeownership reliably produces.
Consider the most common equity access tool: a home equity line of credit (HELOC). According to Bankrate data from 6 May 2026, the average HELOC rate is 7.26%, variable. Approval typically takes 4-6 weeks, requires current employment verification, carries closing costs of $1,000-$3,000, and may be denied precisely when the borrower needs it most, during a job loss or income disruption.
“HELOC approval can take four to six weeks, requires current employment verification, and may be denied precisely when the need is greatest. The money that felt saved is not accessible on your timeline.”
The Bank of America 2025 Better Money Habits Report found that 60% of homeowners cite liquidity fear as the primary driver of their financial behaviour over mathematical optimisation. NAR and BofA survey data from 2025-2026 found that 25-30% of homeowners who aggressively prepaid reported regretting the decision after facing unexpected costs.
The contrast with liquid alternatives is sharp:
Three asset types can serve as genuine emergency backstops: a high-yield savings account (immediate access, no penalties), Roth IRA contributed principal (penalty-free withdrawal), and a taxable brokerage account (liquidation within days). Home equity and 401(k) balances subject to early withdrawal penalties do not qualify. The distinction is not academic; it determines whether a homeowner who has aggressively prepaid can actually respond when an unplanned expense arrives.
The mathematical case for investing over mortgage prepayment assumes the homeowner captures index-like returns. Most retail investors do not.
Research consistent with the DALBAR methodology has documented that average retail equity investors underperform the S&P 500 by approximately 1.4%-1.9% annually over multi-decade periods. The primary driver is market timing: selling during downturns and buying after recoveries, behaviours triggered by the same volatility that makes investing feel risky in the first place.
The behavioural biases that drive market-timing decisions form an interlocking feedback loop: loss aversion makes portfolio drawdowns feel roughly twice as painful as equivalent gains feel rewarding, which triggers selling at the worst possible point, converting temporary volatility into permanent loss and producing the return drag that DALBAR-methodology research consistently documents across multi-decade periods.
“The S&P 500 has averaged roughly 10.2% annually over the long term. But the average retail investor has captured closer to 8.3%-8.8% of that, primarily due to market-timing decisions made during volatility.”
If the realistic investor return is 8.5% rather than 10.2%, the spread over a 6.37% mortgage narrows to approximately 2.1%. That is still positive, but it is thin enough that the guaranteed return from prepayment becomes genuinely competitive, particularly for non-itemisers facing the full nominal rate.
Vanguard research has found smaller gaps (approximately 1.4%) among investors using target-date funds or working with advisers, suggesting the gap is partially closable with disciplined behaviour. The NAR 2026 survey found that 35% of homeowners with surplus cash direct it to stocks and ETFs, but among those aged 55 and above with rates at 6.5% or higher, prepayment preference rises to 42%.
A short self-assessment can help identify which side of the behavioural gap a homeowner is likely to fall on:
Homeowners who automate contributions via 401(k) payroll deduction into target-date or index funds largely sidestep the behavioural gap. Those making discretionary investment decisions in taxable accounts, particularly those who answered yes to the first two questions, are more exposed to it and may find the guaranteed return from prepayment produces a better real-world outcome than their actual investing track record.
Five sections of framework, four variables. The question now is which combination describes the homeowner reading this.
| Profile | Rate Situation | Tax Situation | Behavioural Profile | Recommended Approach |
|---|---|---|---|---|
| Invest-first | At or below 6.37% | Itemiser, 24%-32% bracket | Automated index investing, under 50, adequate reserves | Direct surplus to taxable index investing after tax-advantaged accounts |
| Prepay-first | 7%+ | Standard deduction | Over 60, prone to market timing, or no remaining tax-advantaged room | Accelerate mortgage prepayment; refinance if rates fall |
| Hybrid / split | 5%-7% | Either | Aged 30-50, moderate risk tolerance, values both debt reduction and growth | Split surplus approximately 50/50 between prepayment and investing |
The hybrid approach deserves particular attention for homeowners in the 5%-7% range. Under genuine analytical uncertainty, splitting surplus cash between prepayment and investing captures some of the guaranteed return from debt reduction while maintaining market participation. It is not the mathematically optimal strategy for either extreme, but it is the most defensible strategy under ambiguity.
One figure provides useful perspective on the stakes. At a 7% annualised return assumption, the after-tax net worth gap between the invest-first and prepay-first strategies over 30 years is approximately $21,000. That is meaningful, but it is not a fortune-defining difference. Both strategies, pursued consistently and with the right sequencing, produce strong long-term outcomes.
Rate movements in either direction will shift the calculus. A drop toward 6.0% strengthens the investing case. A rise toward 7.0% or above makes prepayment more competitive even for disciplined investors. Homeowners should re-evaluate whenever their mortgage rate, tax situation, or risk tolerance changes materially.
The priority sequence outlined in this guide, emergency fund, employer match, Roth IRA, 401(k), is not a preamble to the mortgage-versus-investing decision. For most homeowners, most of the time, it is the decision. Completing those steps produces thousands of dollars in guaranteed and tax-advantaged returns before the prepay-versus-invest question even becomes relevant.
For those who have completed the sequence and arrived at the final trade-off, both paths produce strong 30-year outcomes. The $21,000 after-tax gap over three decades is smaller than most assume. What separates good outcomes from regretted ones is not which strategy a homeowner chose, but whether they chose it with the right sequencing, an honest behavioural self-assessment, and adequate liquidity in place.
Conditions change. Rate environments shift, tax laws evolve, incomes rise, and life stages advance. The answer that fits today may not fit in five years. Revisit the framework when any of those variables moves materially.
This article is for informational purposes only and should not be considered financial advice. Investors should conduct their own research and consult with financial professionals before making investment decisions. Past performance does not guarantee future results. Financial projections are subject to market conditions and various risk factors.
The mortgage interest deduction allows homeowners who itemise their taxes to deduct interest on up to $750,000 in acquisition debt, effectively lowering the true cost of borrowing. For example, a 6.37% mortgage drops to roughly 4.33% after-tax for someone in the 32% federal bracket, which strengthens the mathematical case for investing over prepayment.
You should first build a 3-6 month emergency fund, capture your full employer 401(k) match, maximise Roth IRA contributions, and maximise your 401(k) contributions before the mortgage-versus-investing question becomes relevant. These steps offer guaranteed or tax-advantaged returns that typically exceed what mortgage prepayment delivers.
Homeowners with sub-5% mortgage rates have a wide spread over expected equity returns and should generally prioritise investing, while those at 7% or above face a guaranteed prepayment return that competes with realistic after-tax equity returns. Rates in the 5%-7% range sit in genuinely ambiguous territory where tax status and behavioural factors become decisive.
The behavioural gap refers to the approximately 1.4%-1.9% annual underperformance that average retail investors experience relative to the S&P 500, primarily due to market-timing decisions during downturns. If your realistic return is closer to 8.5% rather than 10.2%, the spread over a 6.37% mortgage narrows enough that the guaranteed return from prepayment becomes genuinely competitive.
Home equity cannot be accessed without selling your home or taking on new debt such as a HELOC, which carries an average rate of 7.26%, takes 4-6 weeks to approve, and may be denied during a job loss or income disruption. In contrast, Roth IRA contributed principal and taxable brokerage accounts can be accessed quickly without approval processes, making them far more reliable as emergency reserves.