Fed Holds Rates but Dot Plot Signals a Hike Before Year-End
2 hrs ago
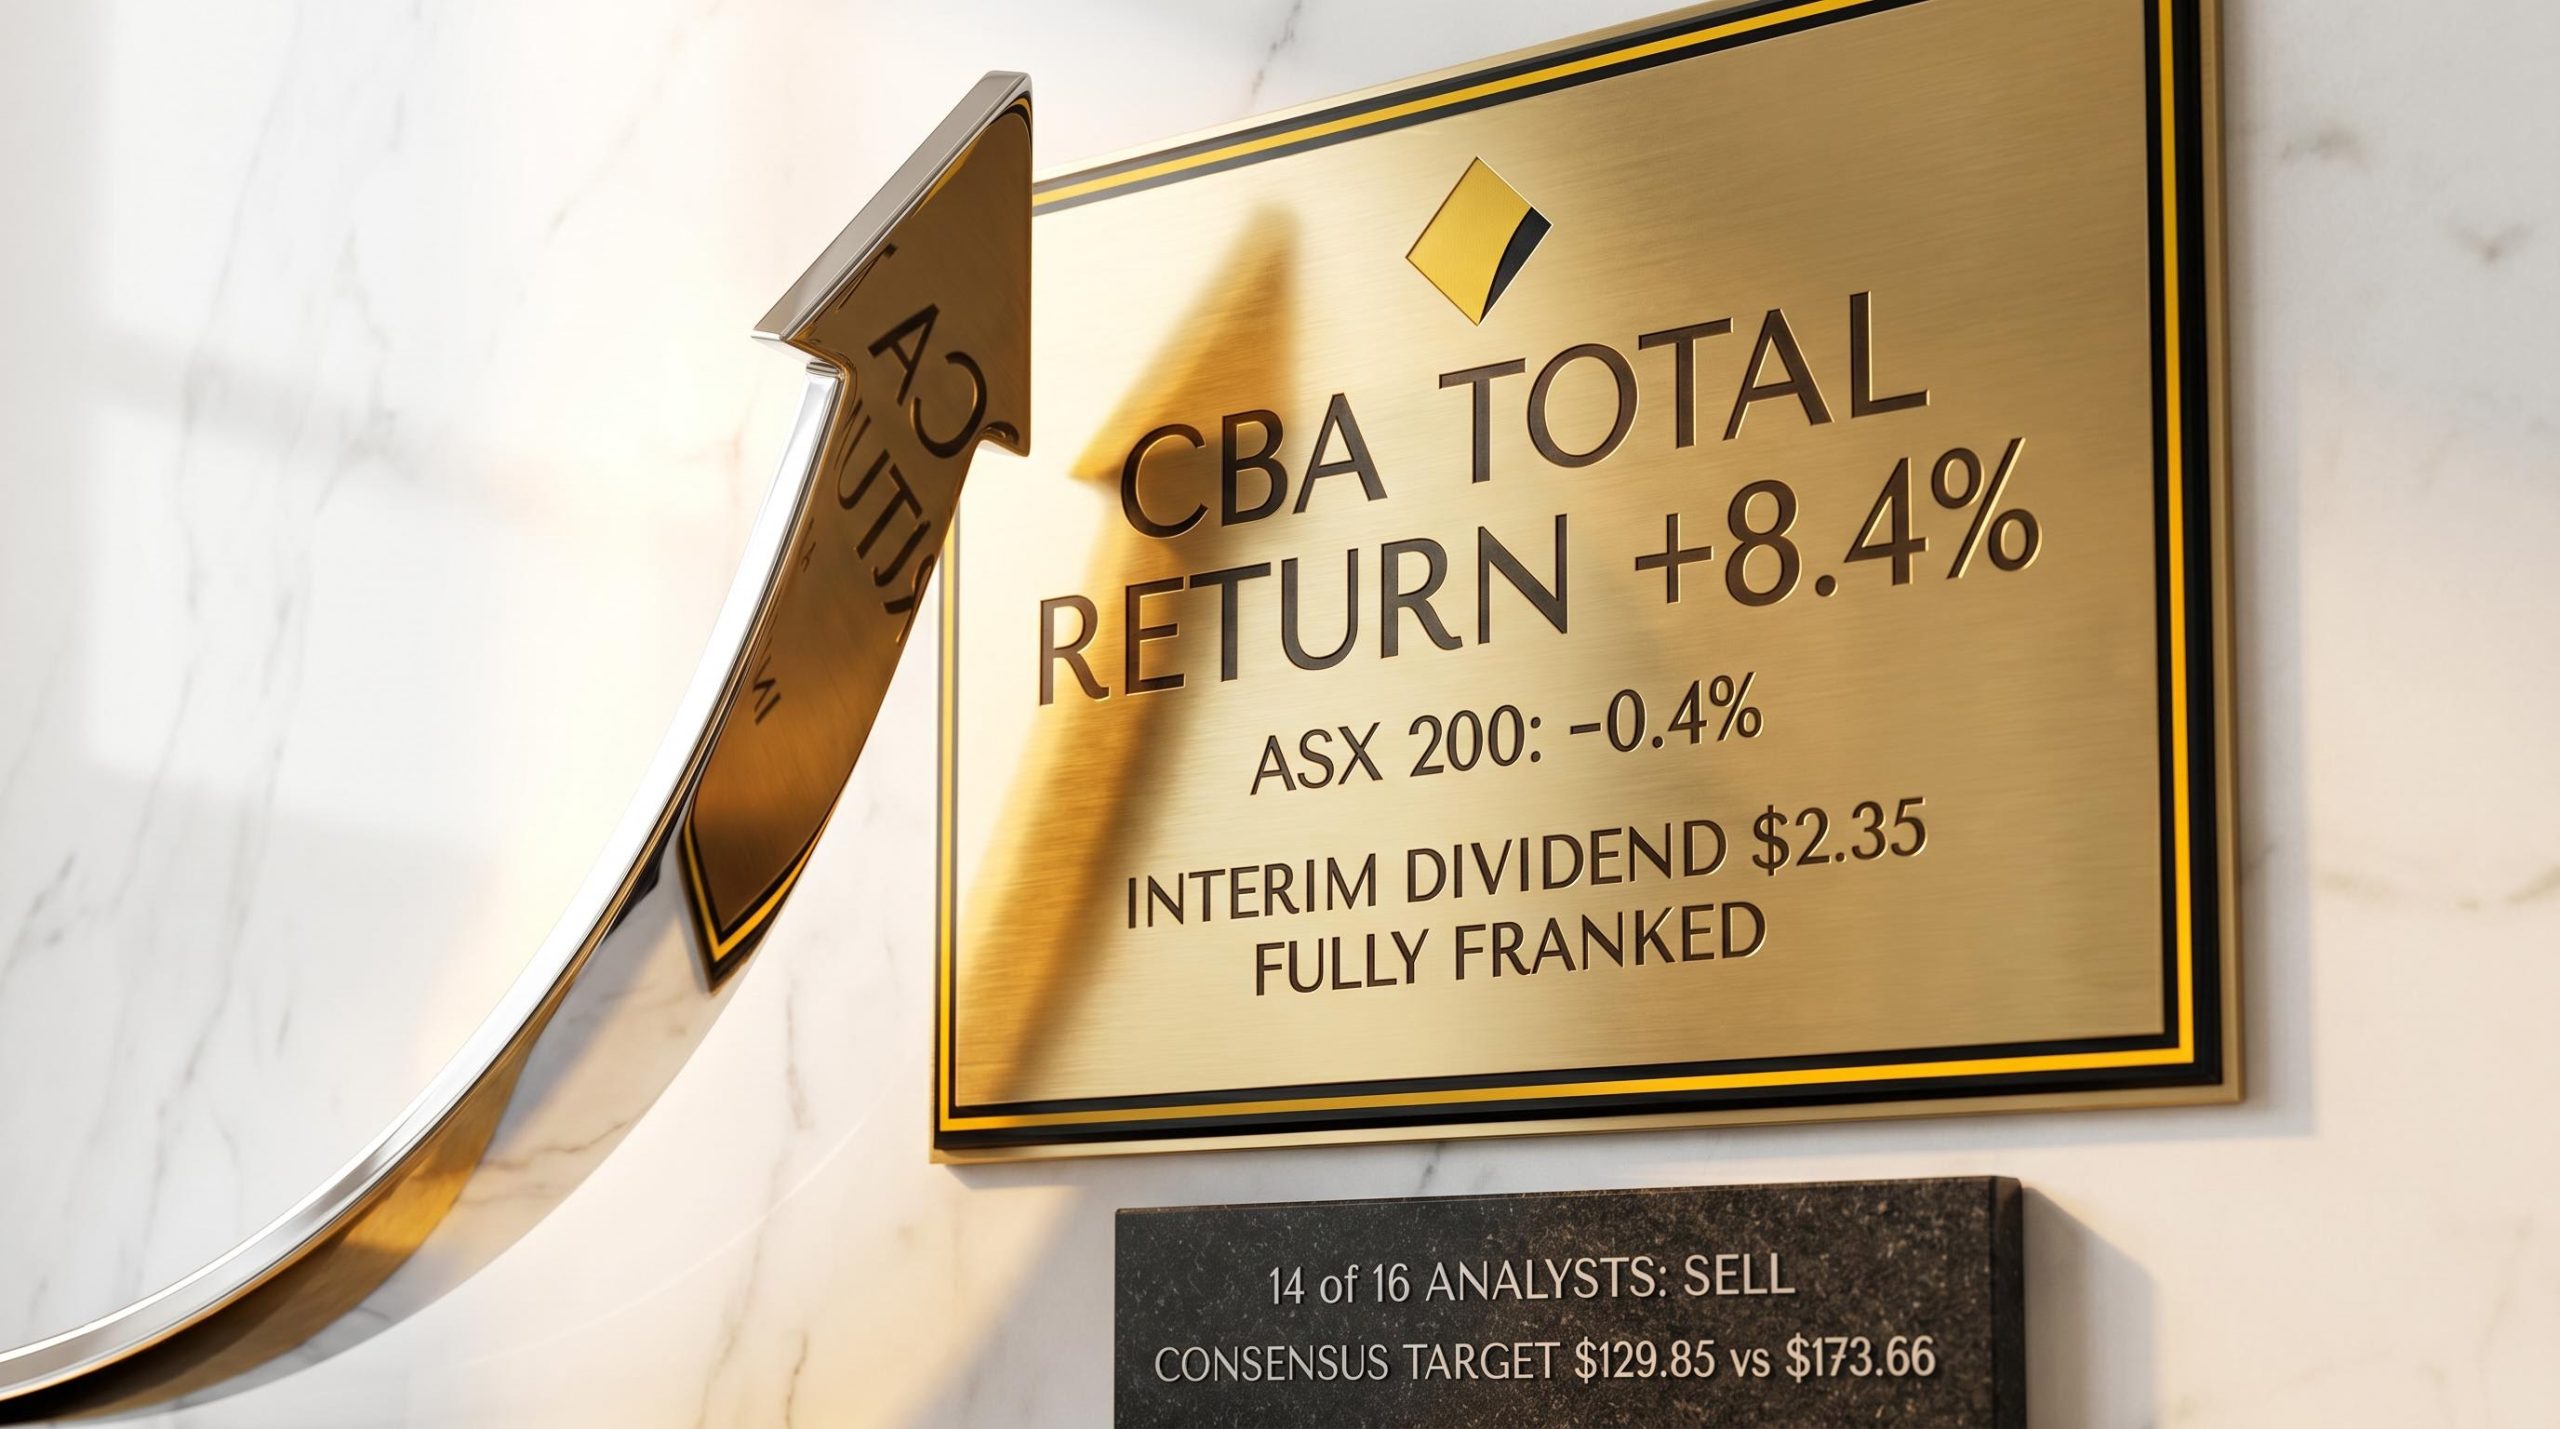
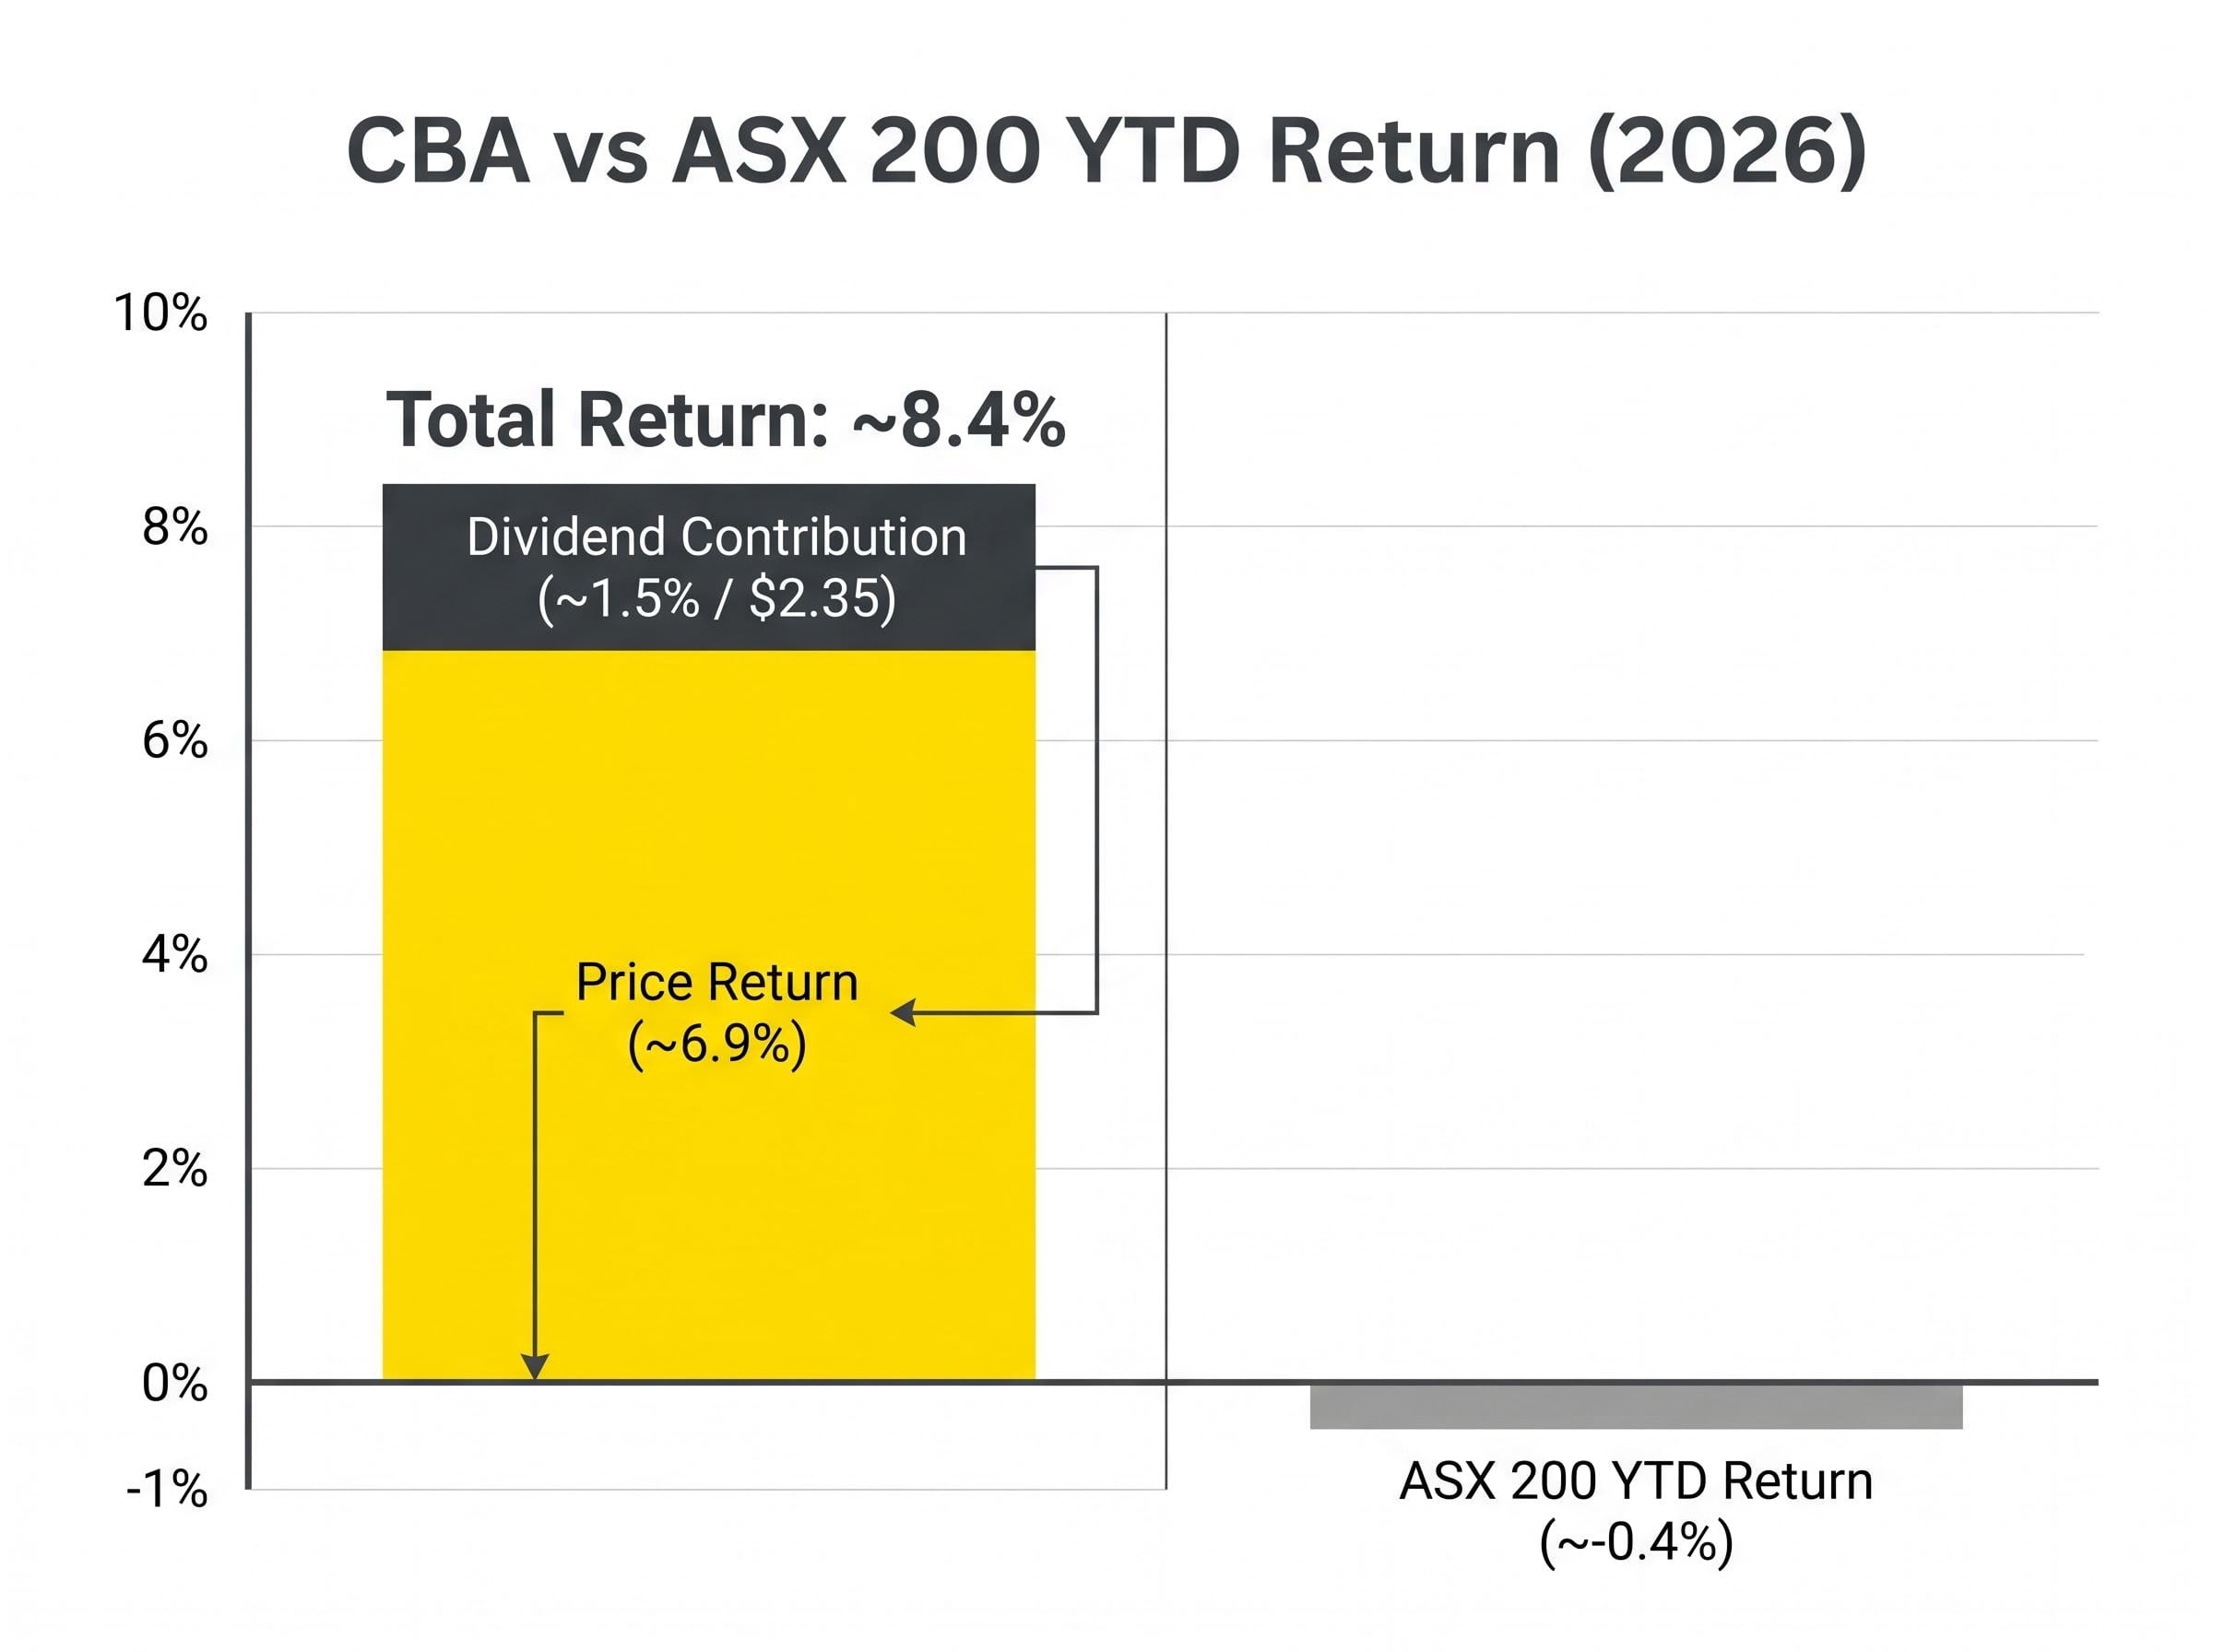
Commonwealth Bank of Australia shares are up approximately 6.9% in 2026, comfortably outpacing an ASX 200 that has delivered negative returns over the same period. Factor in the $2.35 fully franked interim dividend paid on 30 March 2026, and the real number is closer to 8.4%. For investors watching Australia’s largest bank pull away from the benchmark it dominates, the performance gap raises a straightforward question: is the premium justified, or has the market already priced in everything CBA can deliver?
What follows breaks down the total return picture, the half-year results underpinning the rally, why dividends change the maths for Australian shareholders, where the valuation debate stands, and what the Reserve Bank of Australia’s (RBA) rate path means for CBA’s earnings from here. The aim is to give investors the full context behind the headline number, including the risks that come with buying at a premium.
On a price-only basis, CBA shares have gained approximately 6.9% year to date. The ASX 200, by contrast, sits at roughly negative 0.4%. That gap alone is notable, but it understates the real divergence.
On 30 March 2026, CBA paid an interim dividend of $2.35 per share, fully franked. Once that payment is included, the cumulative total return for shareholders rises to approximately 8.4%, a figure that outpaces most term deposit rates available in Australia over the equivalent four-month period.
The approximately 8.4% total return over four months captures the full picture for CBA shareholders: price appreciation and income combined.
The 29 April session saw CBA close at $172.18, down 1.39% on the day amid broader market weakness. By 30 April, the stock had recovered to $173.66, up 0.86%. A single-session dip within a broader uptrend, not a reversal signal.
The performance base was built on 11 February 2026, when CBA reported H1 FY2026 results that beat expectations and sent the share price surging 6.8% in a single session.
Cash net profit after tax (NPAT) came in at $5.445 billion, up 6% year on year. Earnings per share rose to 325.7 cents, also up 6%. The interim dividend of $2.35 per share at a 74% payout ratio signalled management’s confidence in both the result and forward capital generation. A Common Equity Tier 1 (CET1) ratio of 12.3%, comfortably above Australian Prudential Regulation Authority (APRA) requirements, reinforced the capital position.
The capital position narrative received further external validation in March 2026, when CBA received a Fitch credit rating upgrade to AA from AA-, a move that Fitch attributed to the bank’s earnings strength and balance sheet quality and that may reduce CBA’s wholesale funding costs over the medium term.
| Metric | H1 FY2026 Result | YoY Change |
|---|---|---|
| Cash NPAT | $5.445 billion | +6% |
| EPS | 325.7 cents | +6% |
| Interim Dividend | $2.35 (fully franked) | 74% payout ratio |
| CET1 Ratio | 12.3% | Above APRA requirements |
Without these results, the 2026 share price move looks arbitrary. With them, the 6.8% single-day surge and the subsequent dividend make structural sense.
Many retail investors track share prices without accounting for dividends. For high-yield holdings such as the major banks, this means routinely understating actual returns.
Total return combines two components: price appreciation and dividend income. Price return captures only the movement in the share price. Total return captures the full economic benefit of holding the investment.
The CBA figures illustrate the difference clearly:
What “fully franked” means: A fully franked dividend has already had company tax paid on it at the 30% corporate rate. Australian resident shareholders receive a tax offset (called a franking credit) for the tax already paid, reducing their personal income tax on that dividend income. This makes the effective after-tax yield higher than the headline figure suggests.
Franking credits are tax offsets attached to dividends paid from after-tax corporate profits. For Australian resident investors, these credits reduce personal income tax liability dollar for dollar up to the amount of tax already paid at the corporate level. Investors on lower marginal tax rates may receive a refund for excess franking credits. The practical effect is that a fully franked dividend from CBA delivers more after-tax income than an equivalent unfranked dividend from a different source.
The ATO guidance on franking credit refunds confirms that eligible Australian resident individuals can receive cash refunds for excess franking credits where the tax offset exceeds their total income tax liability, a mechanism that meaningfully lifts the after-tax value of CBA’s fully franked dividend for low-to-middle income shareholders.
CBA’s business quality is not the debate. The debate is whether the current share price already reflects that quality, and then some.
On a forward price-to-earnings basis, CBA trades at approximately 25.6-28 times earnings. The peer group tells a different story.
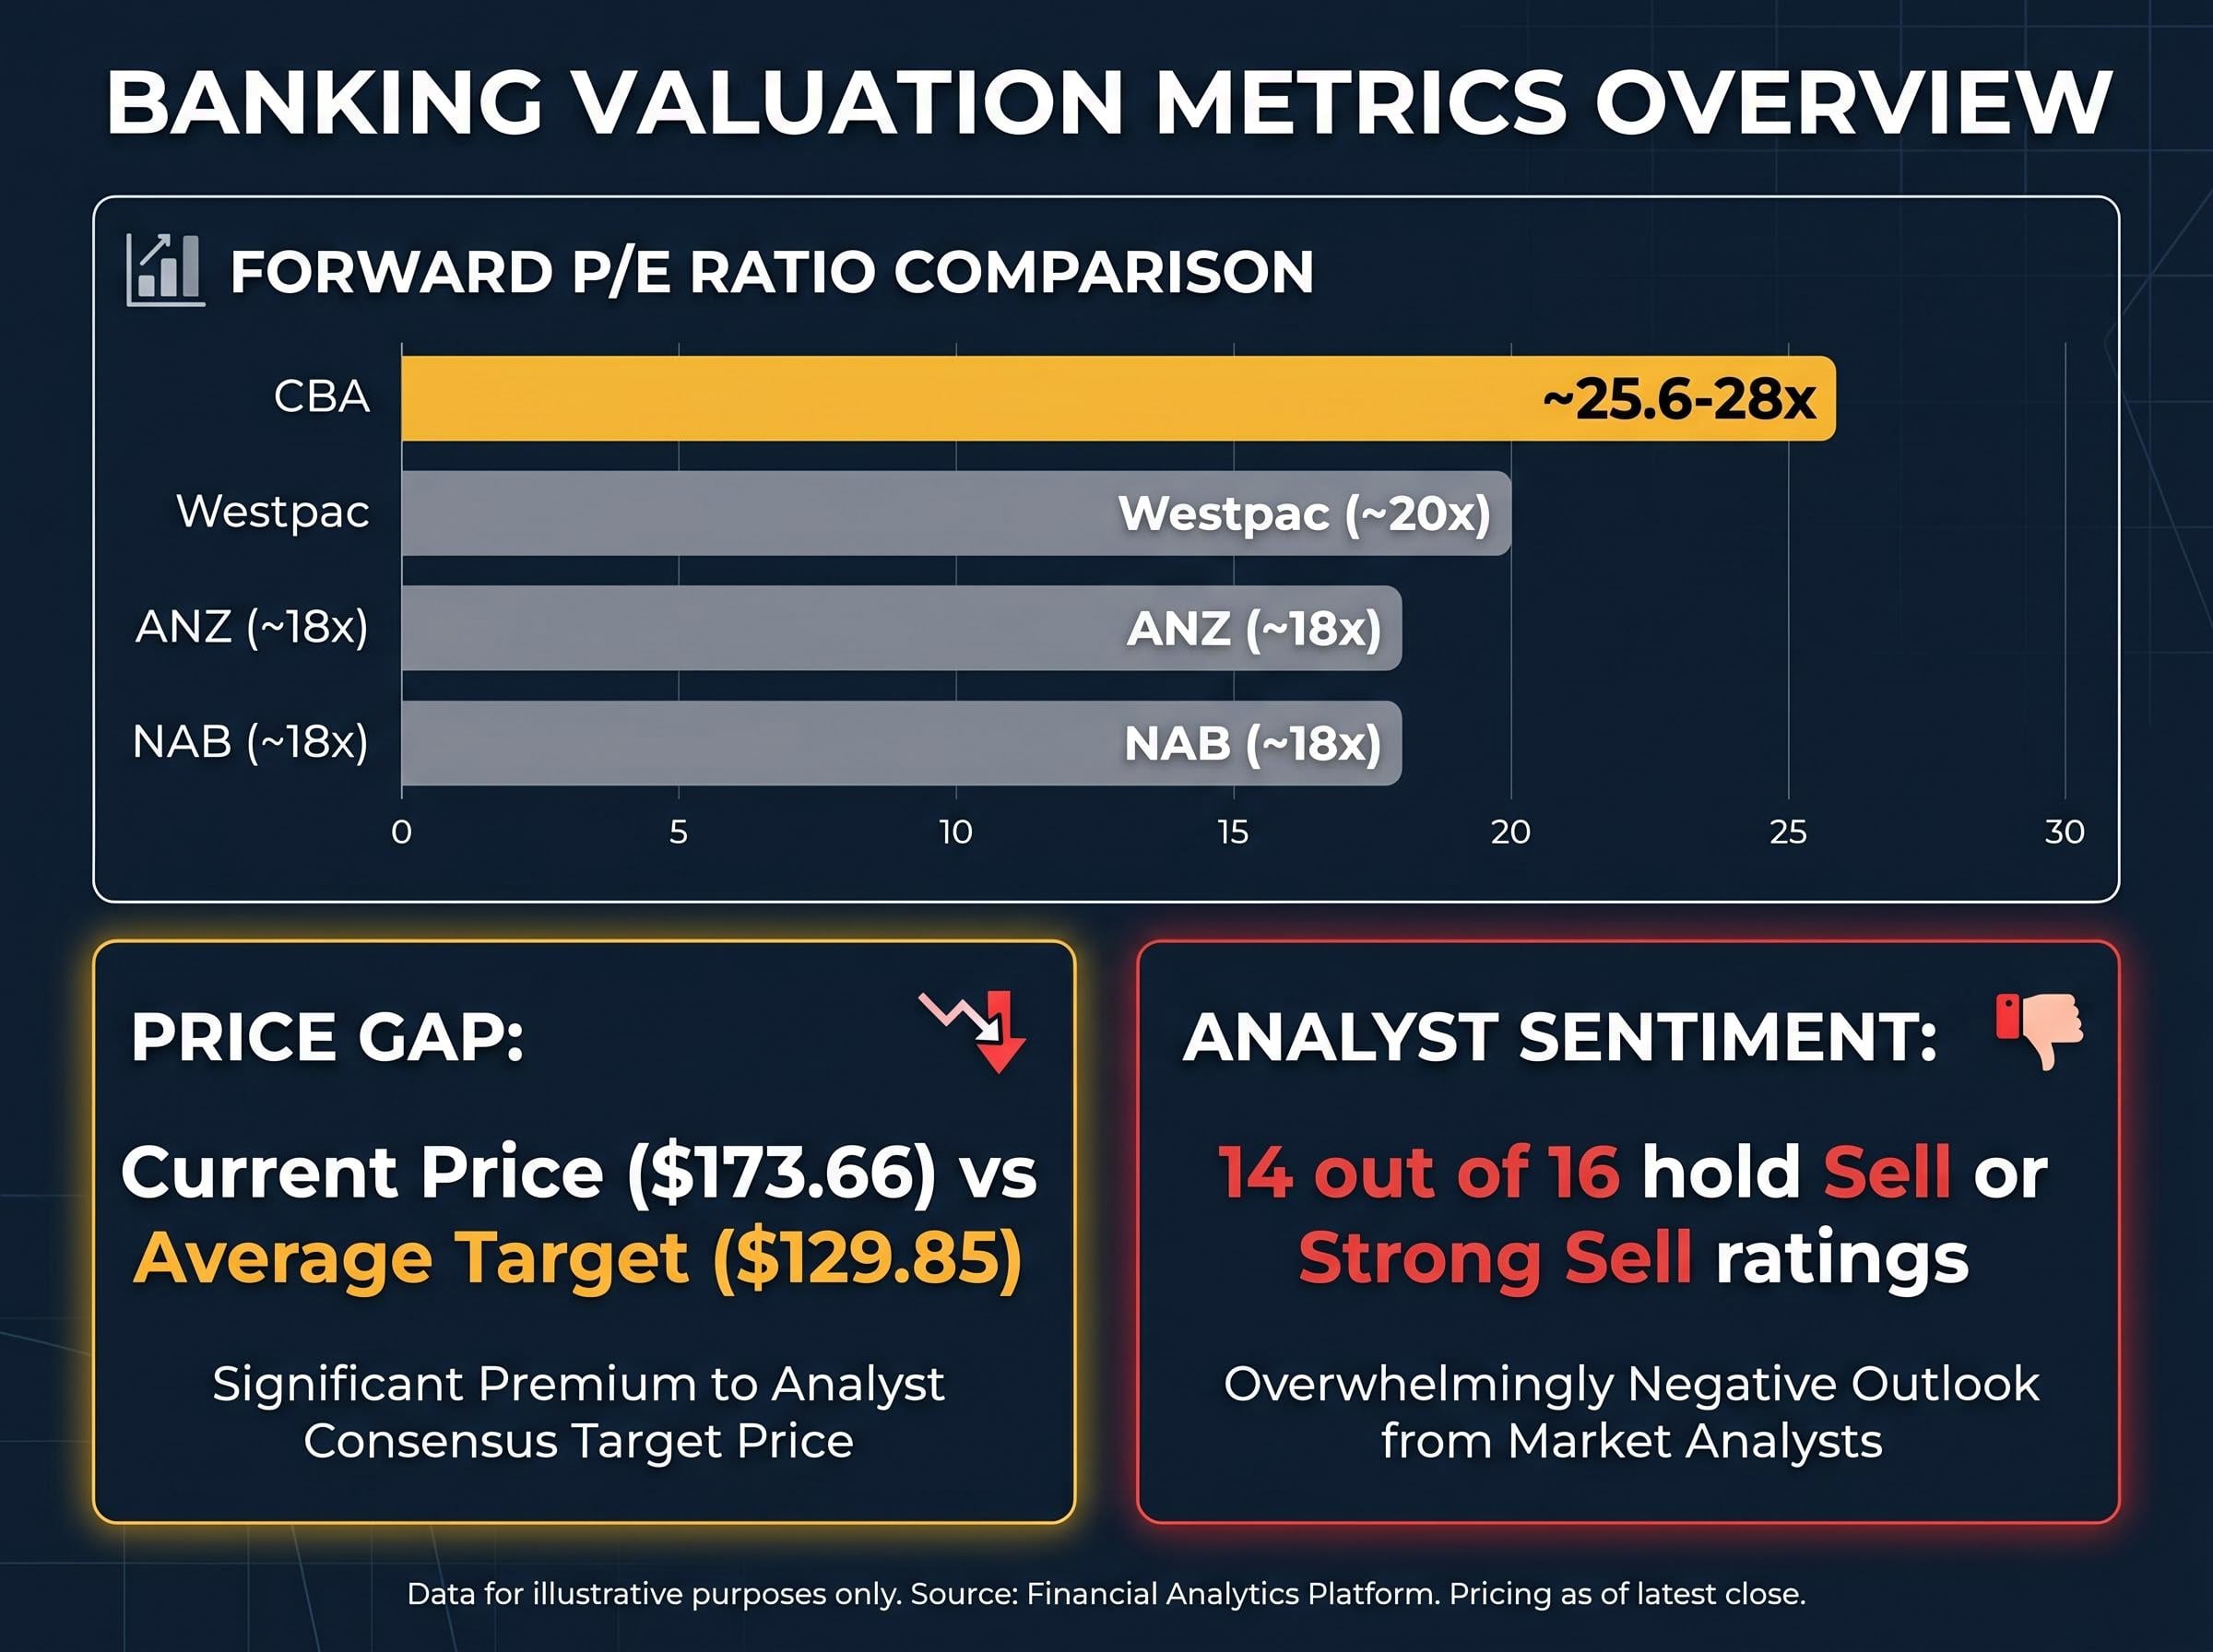
| Bank | Forward P/E Ratio |
|---|---|
| CBA | ~25.6-28x |
| Westpac | ~20x |
| ANZ | ~18x |
| NAB | ~18x |
14 out of 16 analysts covering CBA hold sell or strong sell ratings as of late April 2026.
The average analyst price target sits at $129.85, with a high of $155.55 and a low of $90.00. Morgan Stanley issued a sell rating with a price target of $131.20 on 7 April 2026. At the 30 April close of $173.66, the stock trades roughly 25% above the consensus target.
The concern is specific: CBA’s franchise quality, dividend reliability, and digital capabilities are already reflected in the premium. Buyers at current levels are paying for perfection, with limited margin for error if earnings growth slows or margins compress further.
Investors wanting to examine the structural risks behind CBA’s premium in the context of the broader index will find our deep-dive into ASX bank overvaluation examines Morningstar’s analysis of all four major banks, the concentration risk embedded in ASX 200 index funds, and what a valuation reset in financials would mean for domestic equity portfolios.
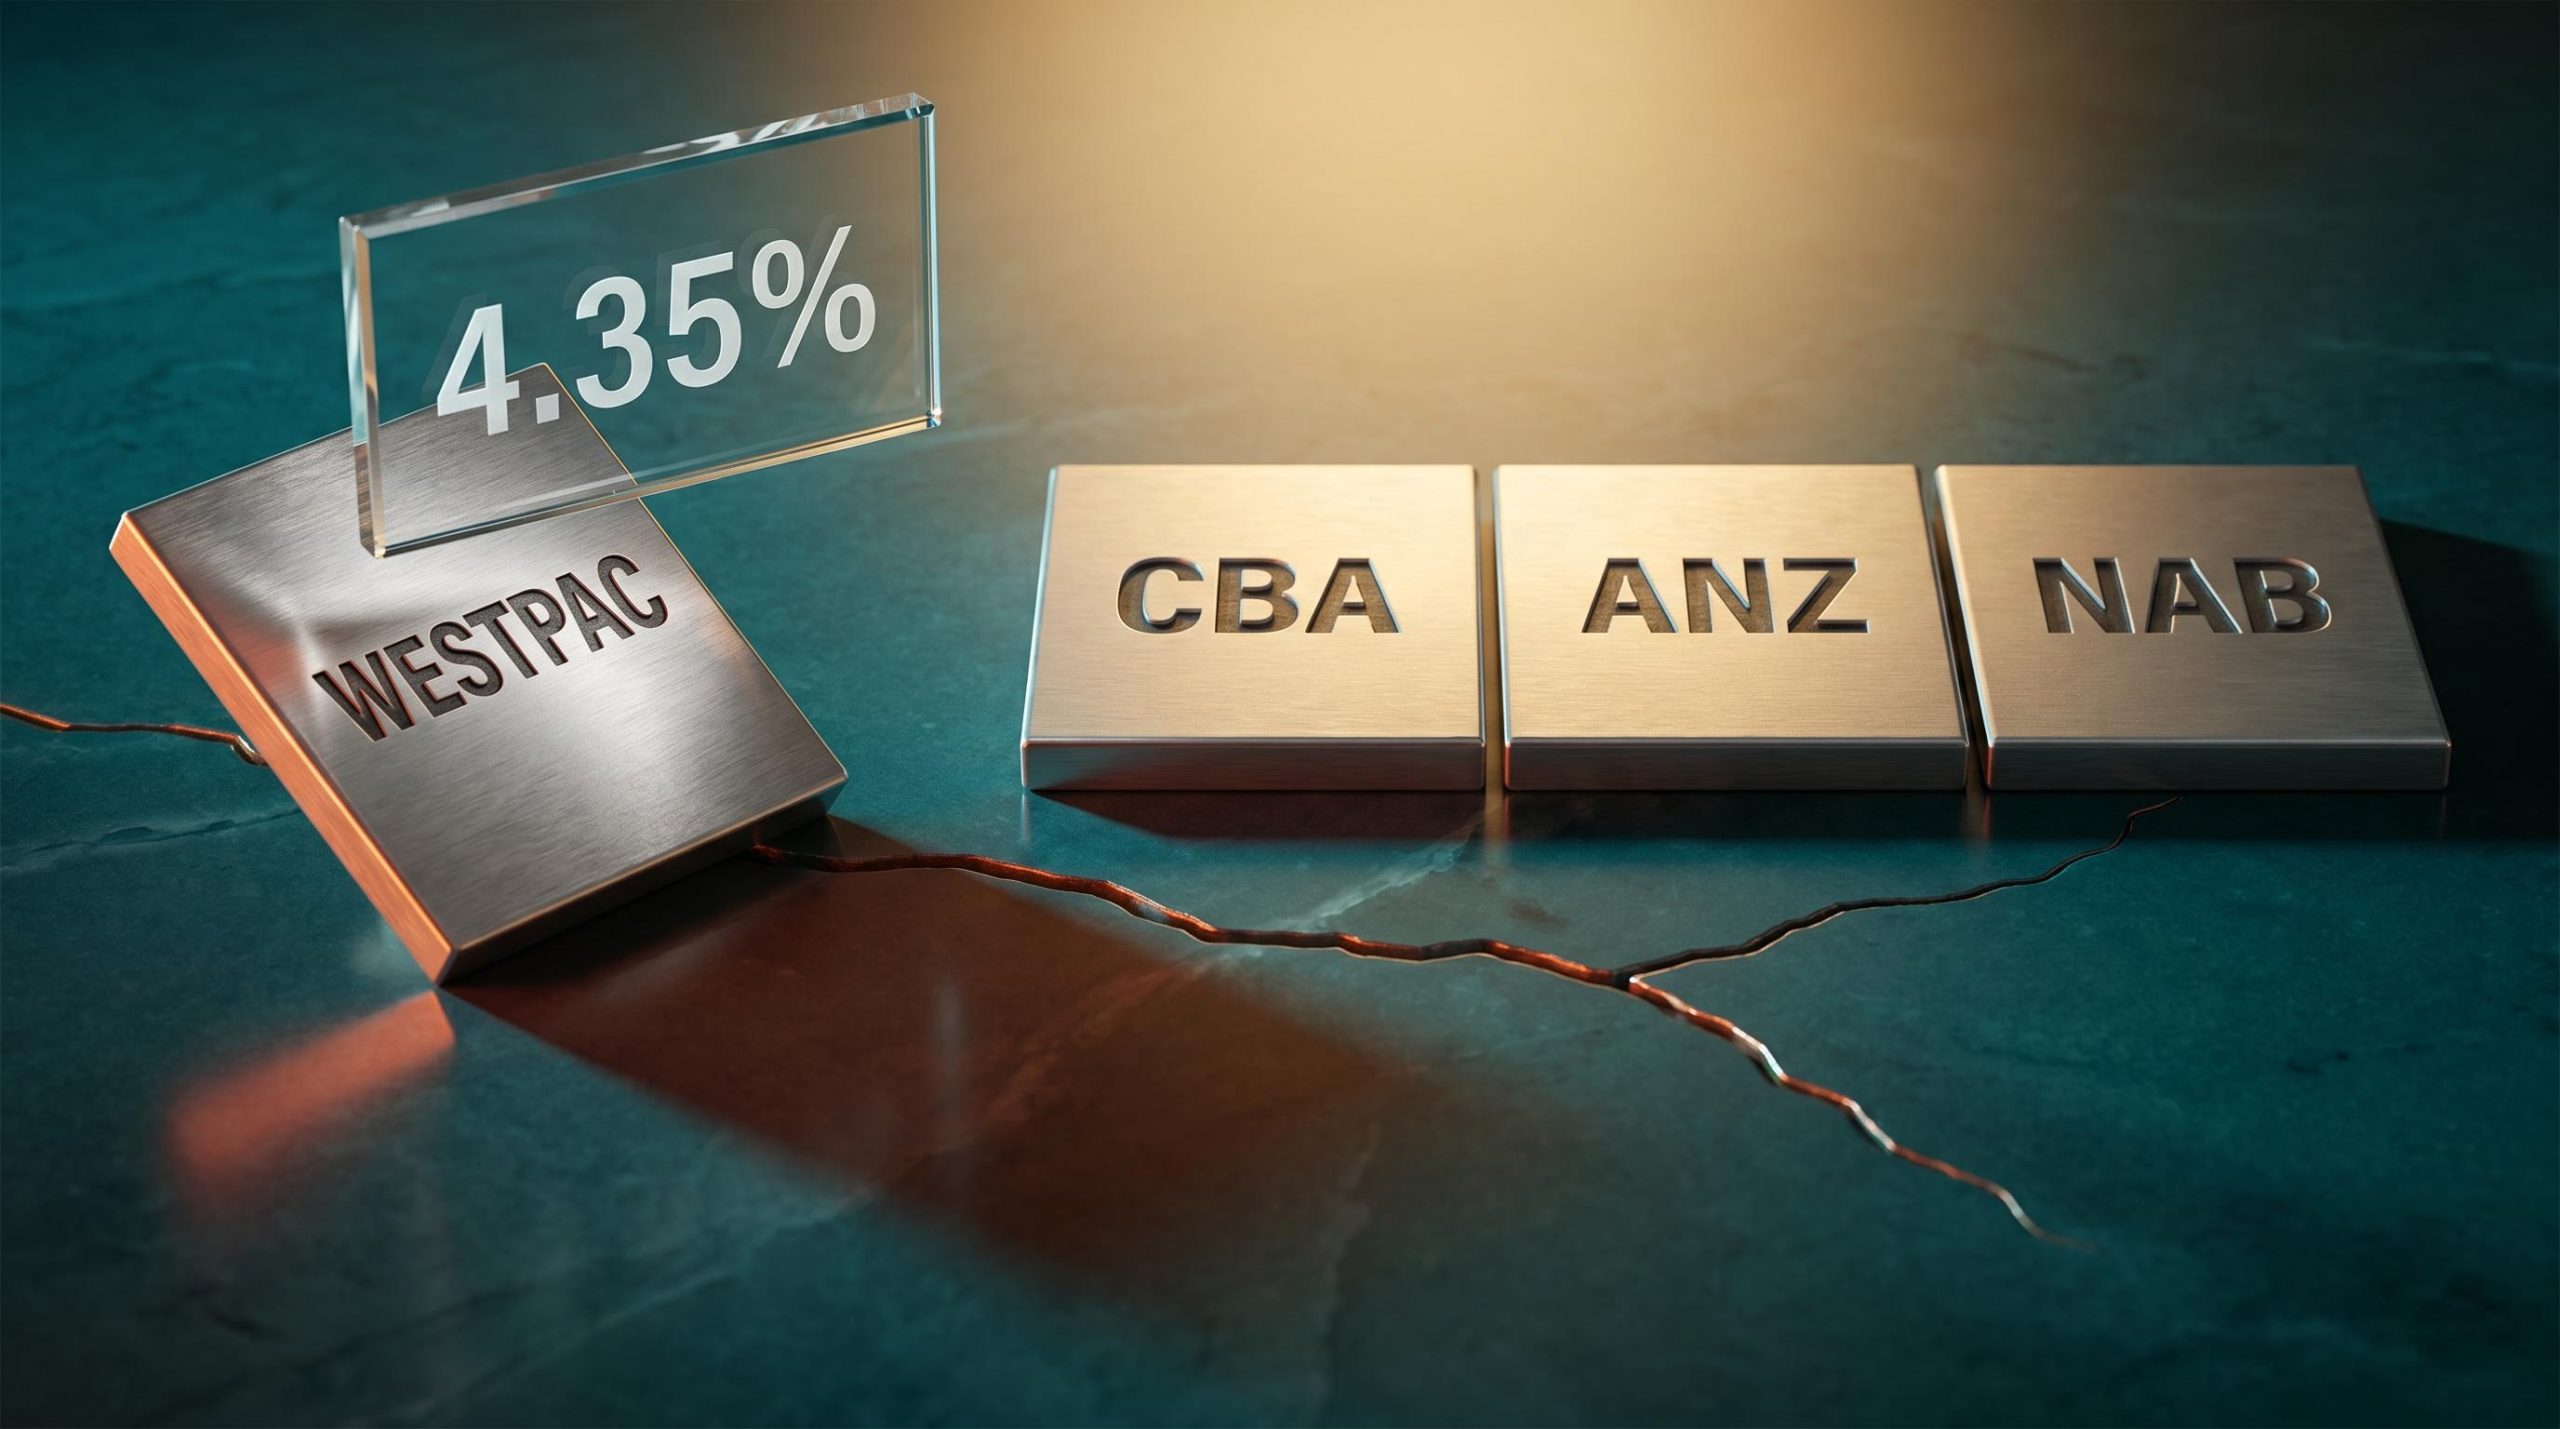
The RBA cash rate stands at 4.10% following two increases in early 2026: to 3.85% on 4 February and to 4.10% on 18 March. For Australia’s largest mortgage lender, this rate environment cuts both ways.
The RBA rate environment shifted materially in early 2026: headline CPI surged to 4.6% in March, well above the 2-3% target band, pushing markets to price a 62% probability of a further hike at the May board meeting that would lift the cash rate to 4.35%.
CBA’s Q1 2026 trading update tempered the optimism from the strong H1 result, showing only marginal profit growth and ongoing margin pressure. The forward dividend yield of approximately 2.9% reflects the elevated share price rather than any decline in the dividend itself. With a CET1 ratio of 12.3%, the capital buffer remains comfortable, but the earnings trajectory over the second half will depend heavily on how these rate dynamics play out across the loan book.
The scoreboard is clear. CBA has delivered approximately 8.4% total return in 2026 while the ASX 200 has gone backwards. The H1 FY2026 results were solid, the dividend was well covered, and the capital position is strong.
The other side of the ledger is equally clear. The valuation premium over peers is the widest in the sector, 14 of 16 analysts rate the stock sell or strong sell, and the consensus target sits roughly 25% below the 30 April closing price of $173.66.
CBA accounts for approximately 10% of the ASX 200, meaning many index investors already carry significant exposure. The decision from here is whether the bank’s dividend reliability, capital strength, and defensive qualities justify paying a premium that the vast majority of professional analysts consider stretched.
For investors who want to act on this analysis rather than simply track CBA’s performance, our comprehensive walkthrough of ASX portfolio positioning during inflation covers how to allocate across ASX cash ETFs, equity instruments, and fixed income when the RBA tightening cycle has not yet peaked, with specific instrument examples and a framework for avoiding reactive decisions on CPI headlines.
This article is for informational purposes only and should not be considered financial advice. Investors should conduct their own research and consult with financial professionals before making investment decisions. Past performance does not guarantee future results.
CBA shares have delivered approximately 8.4% total return year to date in 2026, combining a price gain of around 6.9% with the $2.35 fully franked interim dividend paid on 30 March 2026.
A fully franked dividend means company tax at the 30% corporate rate has already been paid on the profits distributed; Australian resident shareholders receive franking credits as a tax offset, reducing their personal income tax liability and in some cases generating a cash refund from the ATO.
As of late April 2026, 14 out of 16 analysts rate CBA a sell or strong sell because the stock trades at roughly 25 to 28 times forward earnings, a significant premium to peers like ANZ and NAB at around 18 times, with the consensus price target of $129.85 sitting approximately 25% below the current share price.
Higher RBA rates can widen CBA's net interest margins and support profitability, but they also increase repayment burdens on borrowers, which could slow loan growth and raise credit quality risks, as reflected in CBA's Q1 2026 trading update that showed only marginal profit growth.
CBA shares have outperformed the ASX 200 by roughly 8.8 percentage points year to date in 2026, with CBA delivering approximately 8.4% total return while the ASX 200 has returned approximately negative 0.4% over the same period.