Fed Holds Rates but Dot Plot Signals a Hike Before Year-End
2 hrs ago
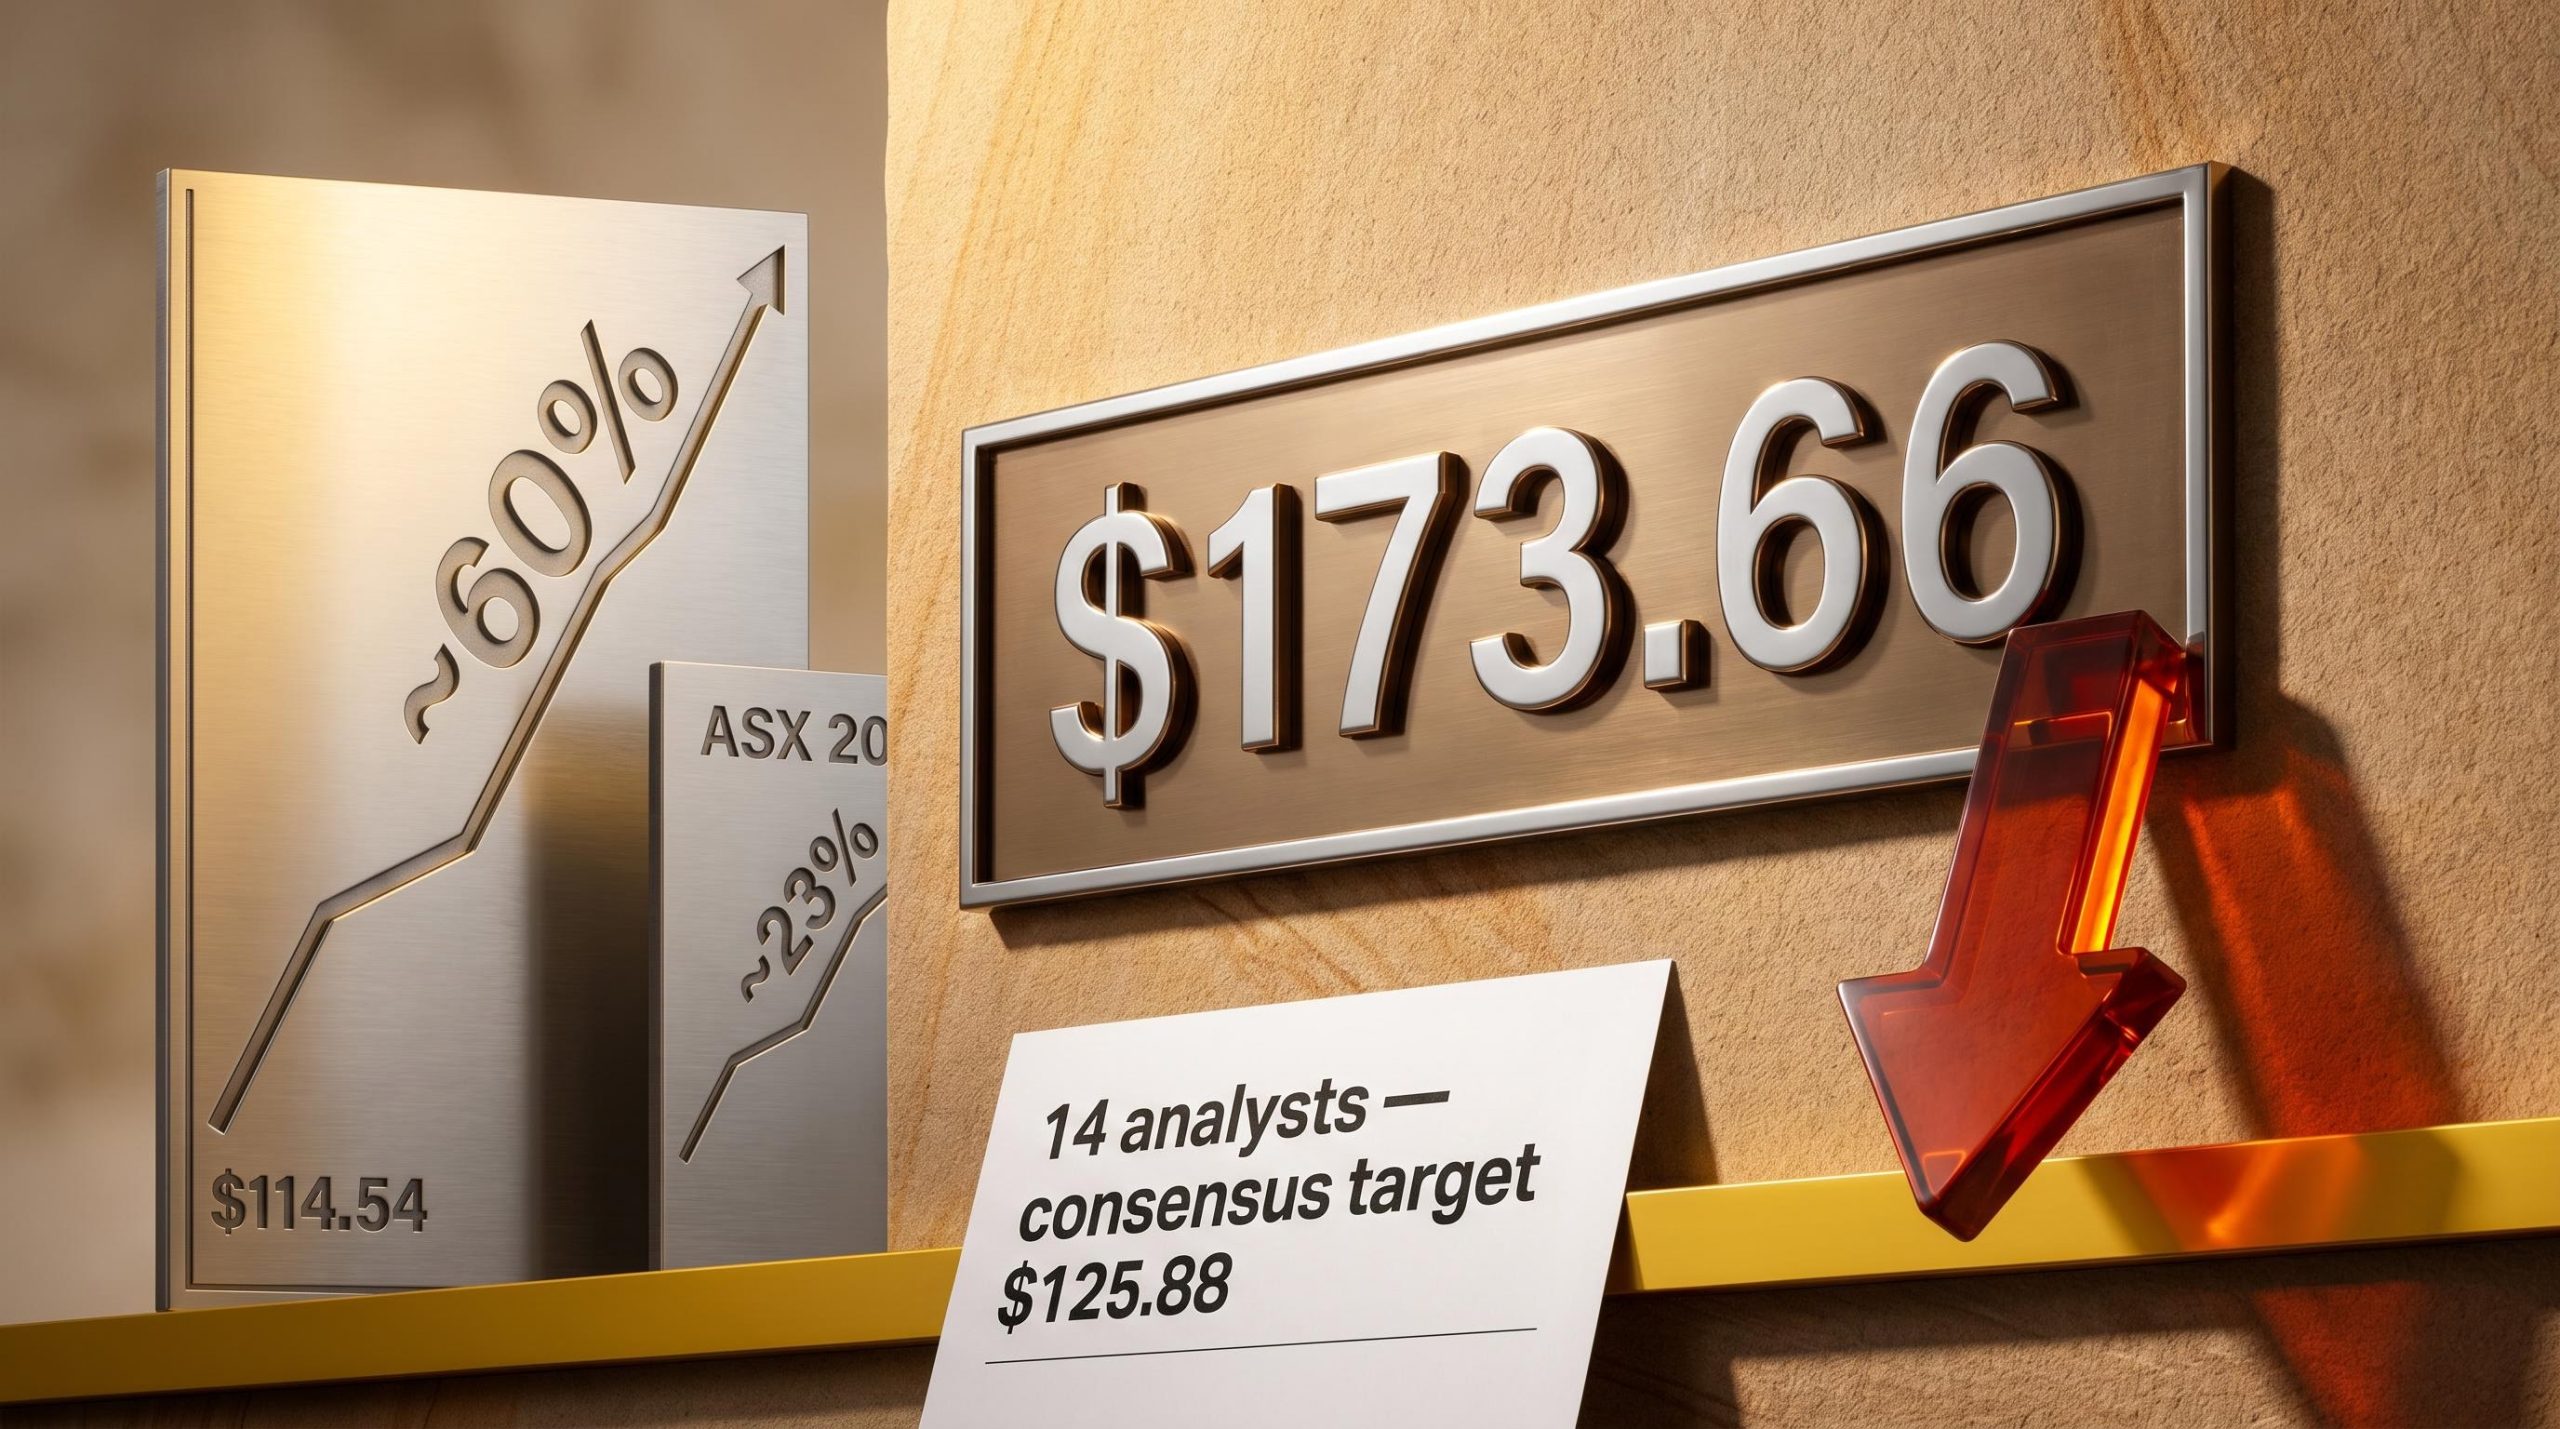
Commonwealth Bank of Australia shares were trading at roughly $114.54 in April 2024. By April 30, 2026, they closed at $173.66, a gain of approximately 60% over two years. During the same window, the S&P/ASX 20 managed approximately 23%. The gap between those two numbers is the starting point for a larger question.
CBA is not a speculative growth stock. It is a 115-year-old retail bank with a mortgage book, a dividend, and a reputation for predictability. The fact that it delivered outsized returns against Australia’s largest-cap index over two years raises a pointed question for investors: what actually drove this, and does the case still hold at $173.66?
What follows works through the verified numbers, the business fundamentals behind them, the dividend contribution to total return, and the analyst consensus that now warns of meaningful downside, giving readers a complete picture of what CBA’s run means and what comes next.
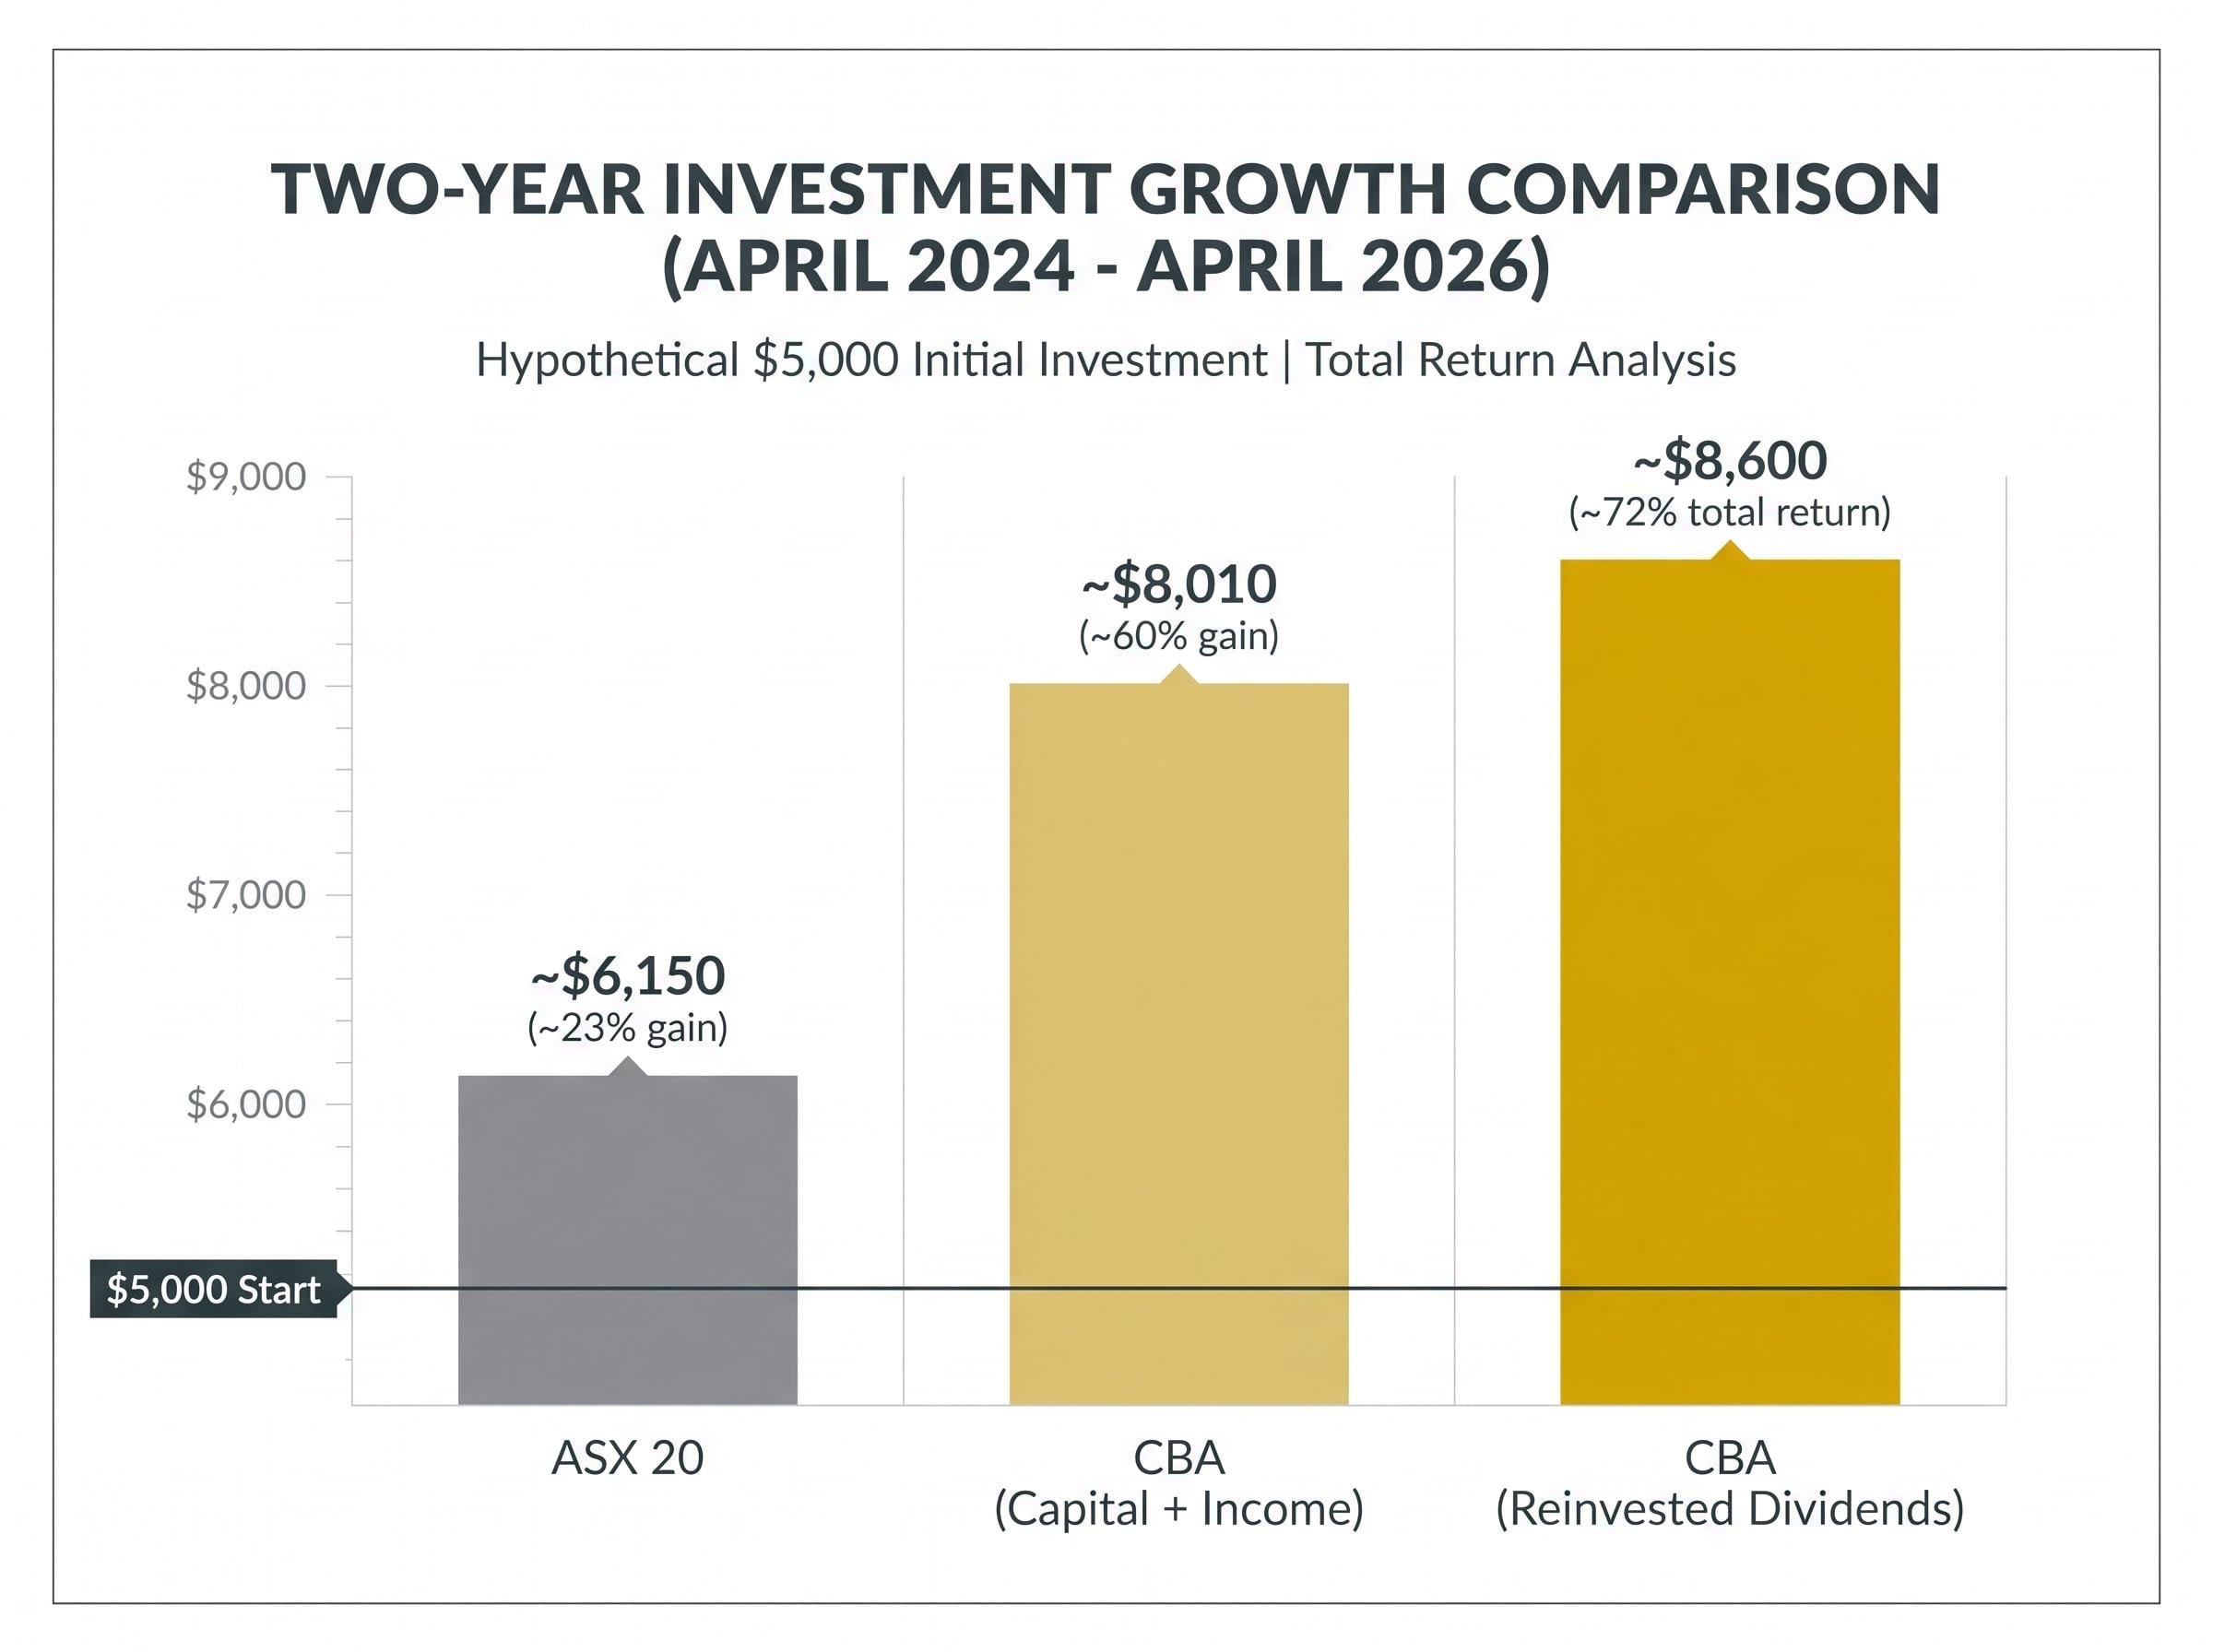
A $5,000 investment in CBA at $114.54 in April 2024 would have acquired approximately 43.7 shares. At the April 30, 2026 close of $173.66, those shares would be valued at approximately $7,593 on capital appreciation alone. Against the same starting point, a $5,000 allocation tracking the ASX 20’s 23% gain would have reached roughly $6,150.
A $5,000 position in CBA grew to approximately $8,010 over two years (including estimated dividend income), representing over $3,000 in combined capital and income return.
The contrast sharpens when set side by side.
| Metric | CBA | ASX 20 |
|---|---|---|
| Start value (April 2024) | $114.54 | Index level |
| End value (April 2026) | $173.66 | Index level |
| Percentage gain | ~60% | ~23% |
| $5,000 hypothetical outcome | ~$8,010 | ~$6,150 |
The broader ASX 200 closed at 8,665.82 on April 30, 2026, well below its February 2026 record of 9,128.30. CBA outperformed not just its peer group but a market that itself had a strong run before pulling back.
The 60% figure captures the price chart. It does not capture the full investment return. When fully franked dividends are reinvested, CBA’s estimated total return over the two-year period rises to approximately 72%.
Three components make up the total return picture:
On this basis, the hypothetical $5,000 position, with dividends reinvested, would be estimated above $8,600 by April 2026. The most recent interim dividend, declared with the H1 FY2026 results, came in at $2.35 per share, a 4% year-on-year increase, fully franked with a payout ratio of approximately 74%.
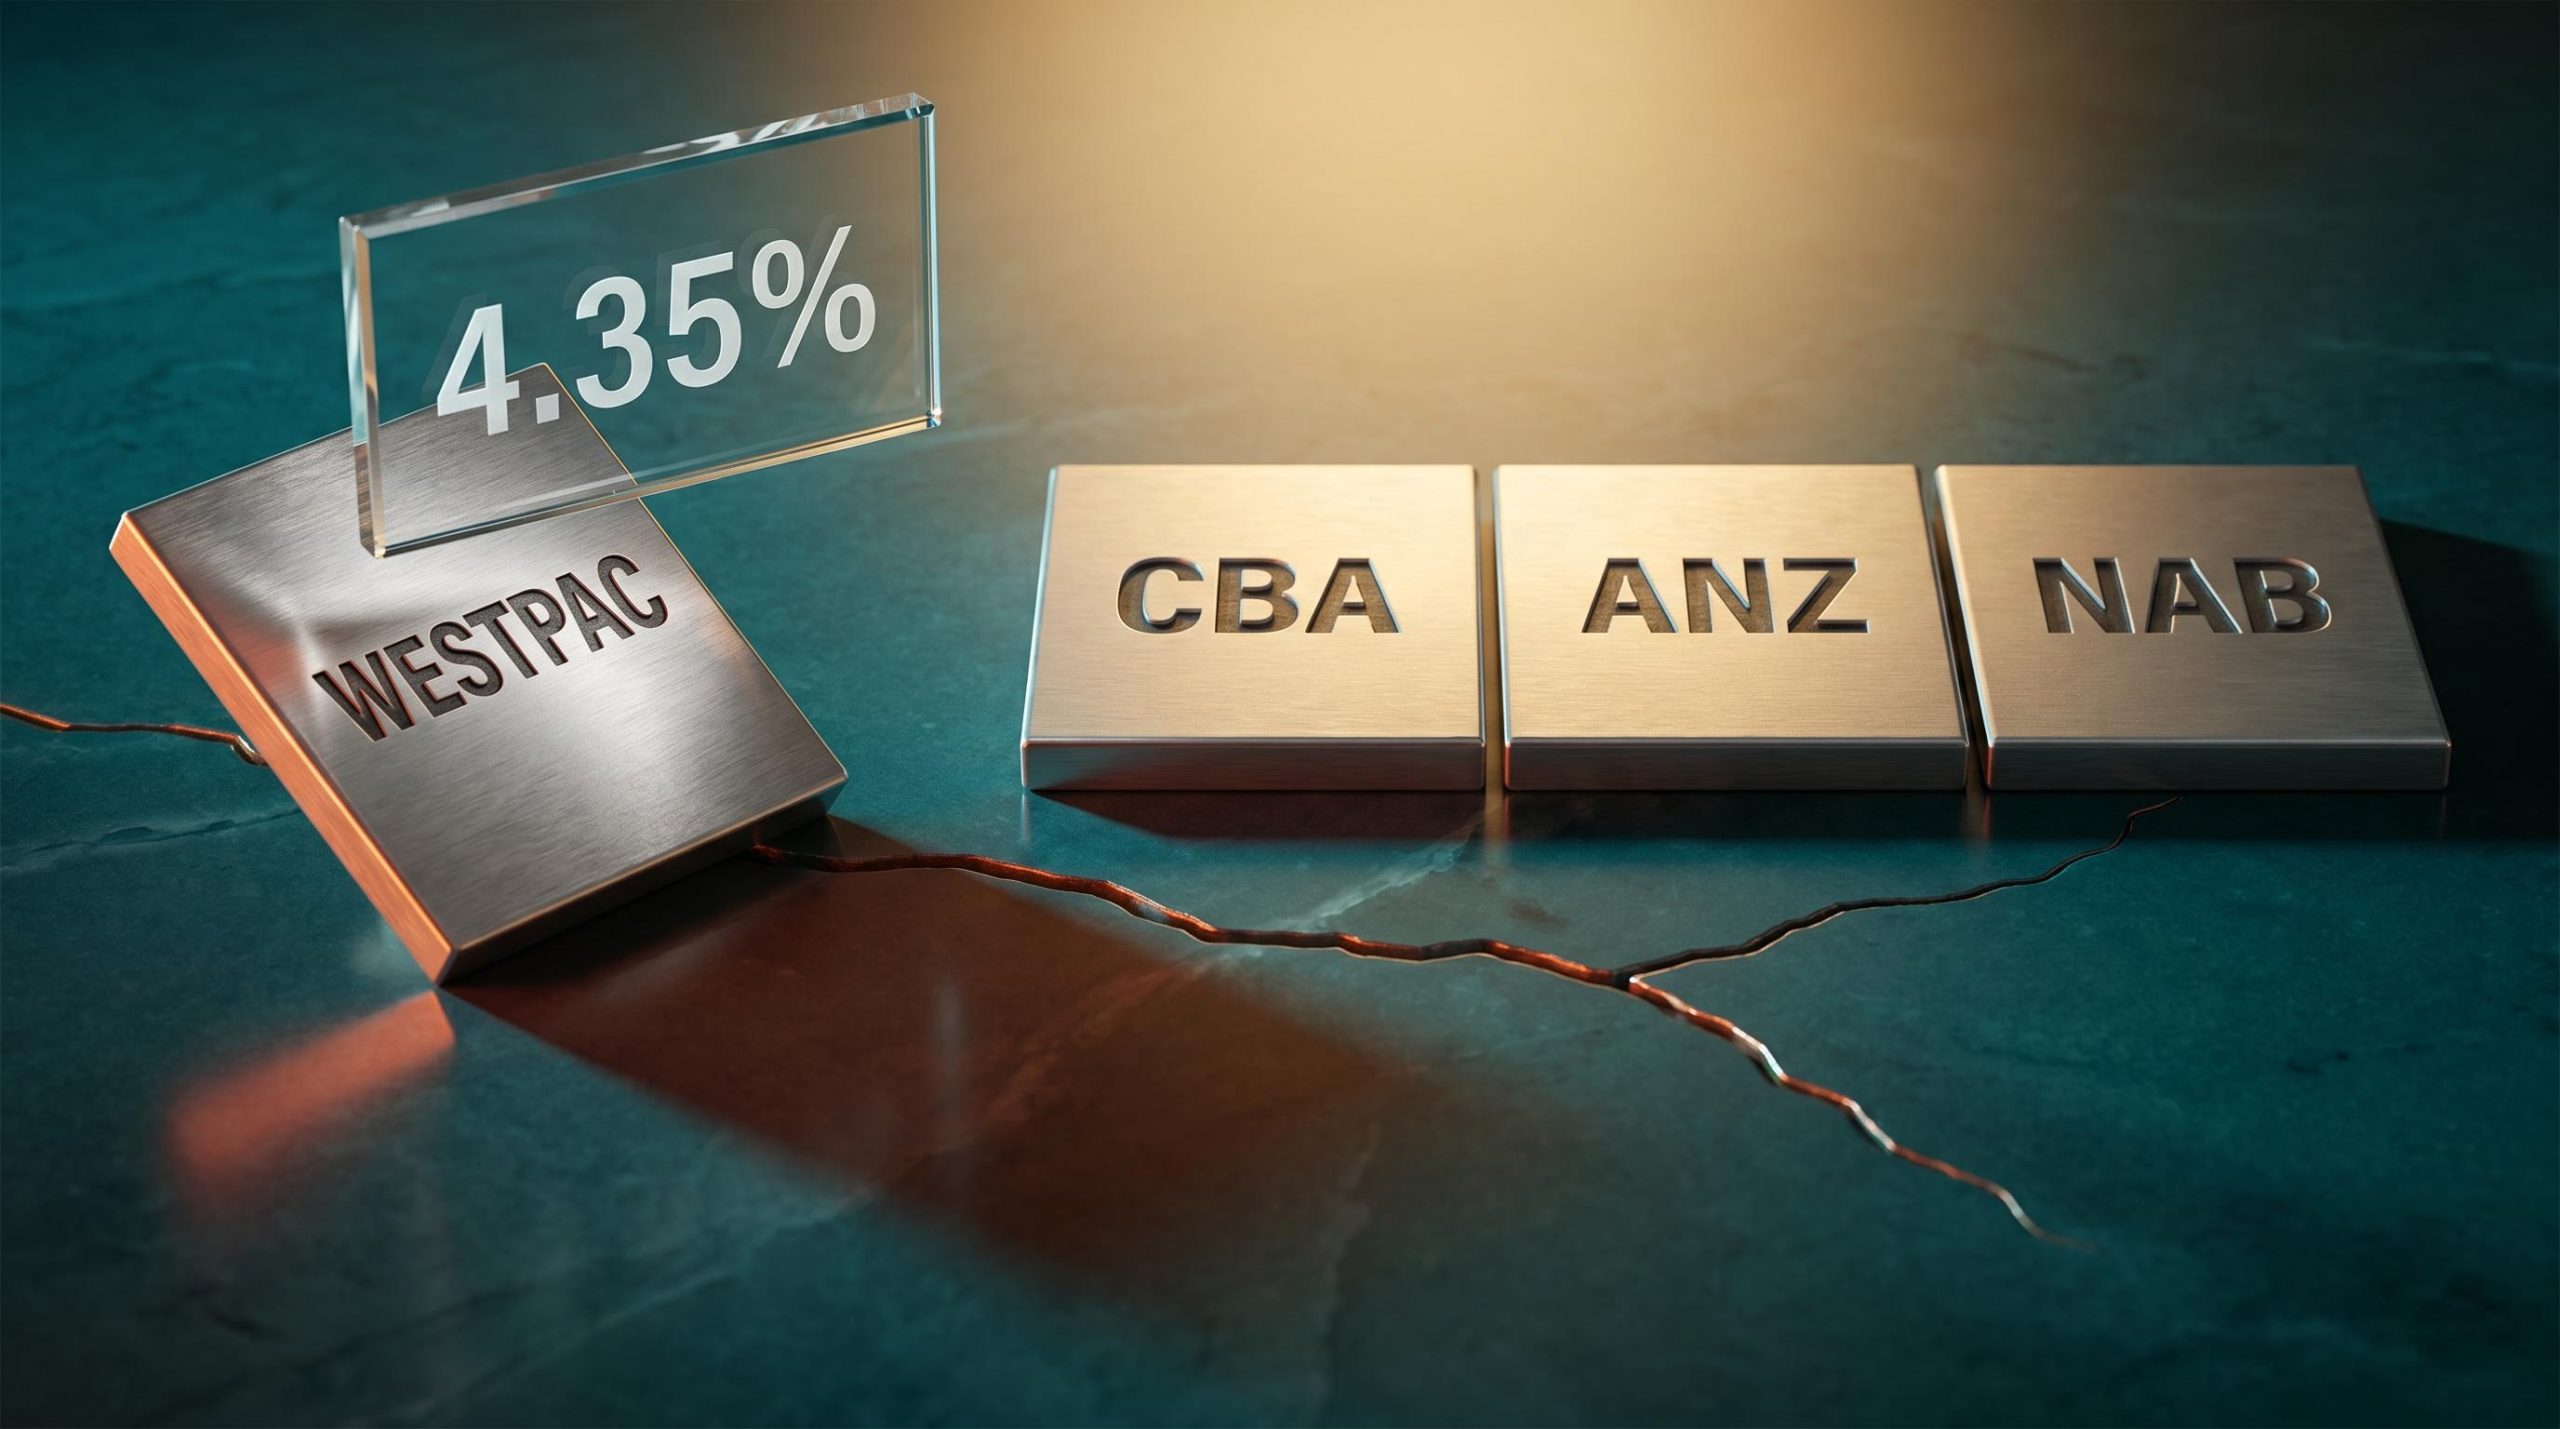
CBA’s dividend sustainability rests on a payout ratio of approximately 74% and an unbroken payment record since 2006, but the effective gross yield for SMSF holders in pension phase, lifted by refundable franking credits, diverges materially from the headline figure that yield-focused comparisons with ANZ, NAB, and Westpac typically use.
The difference between 60% and 72% over two years is not trivial. In dollar terms, it represents hundreds of additional dollars on a modest starting position, and the effect scales with portfolio size.
Australia’s dividend imputation system means CBA has already paid 30% corporate tax on distributed profits. Shareholders receive a credit for this prepaid tax, which offsets their personal tax liability on the dividend income.
The ATO dividend imputation rules establish the framework under which shareholders receive franking credits representing the 30% corporate tax already paid, with the credit available to offset personal tax liability or generate a cash refund for eligible low-rate taxpayers such as superannuation funds in the accumulation phase.
For superannuation funds in the accumulation phase, taxed at 15%, the franking credit generates a refund that effectively boosts the net dividend yield above the headline figure. The benefit varies depending on the investor’s marginal tax rate and entity structure, but for many Australian holders, the after-tax return from a fully franked CBA dividend is materially higher than the gross yield suggests.
Three structural factors underpinned CBA’s share price appreciation:
The H1 FY2026 results, reported in February 2026, confirmed the earnings base. Cash net profit reached $5.4 billion, up 6% year-on-year. Pre-provision profit came in at $8.1 billion, up 5%.
CBA’s return on equity of 13.8% in H1 FY2026 reflects the efficiency of its capital deployment relative to the broader banking sector.
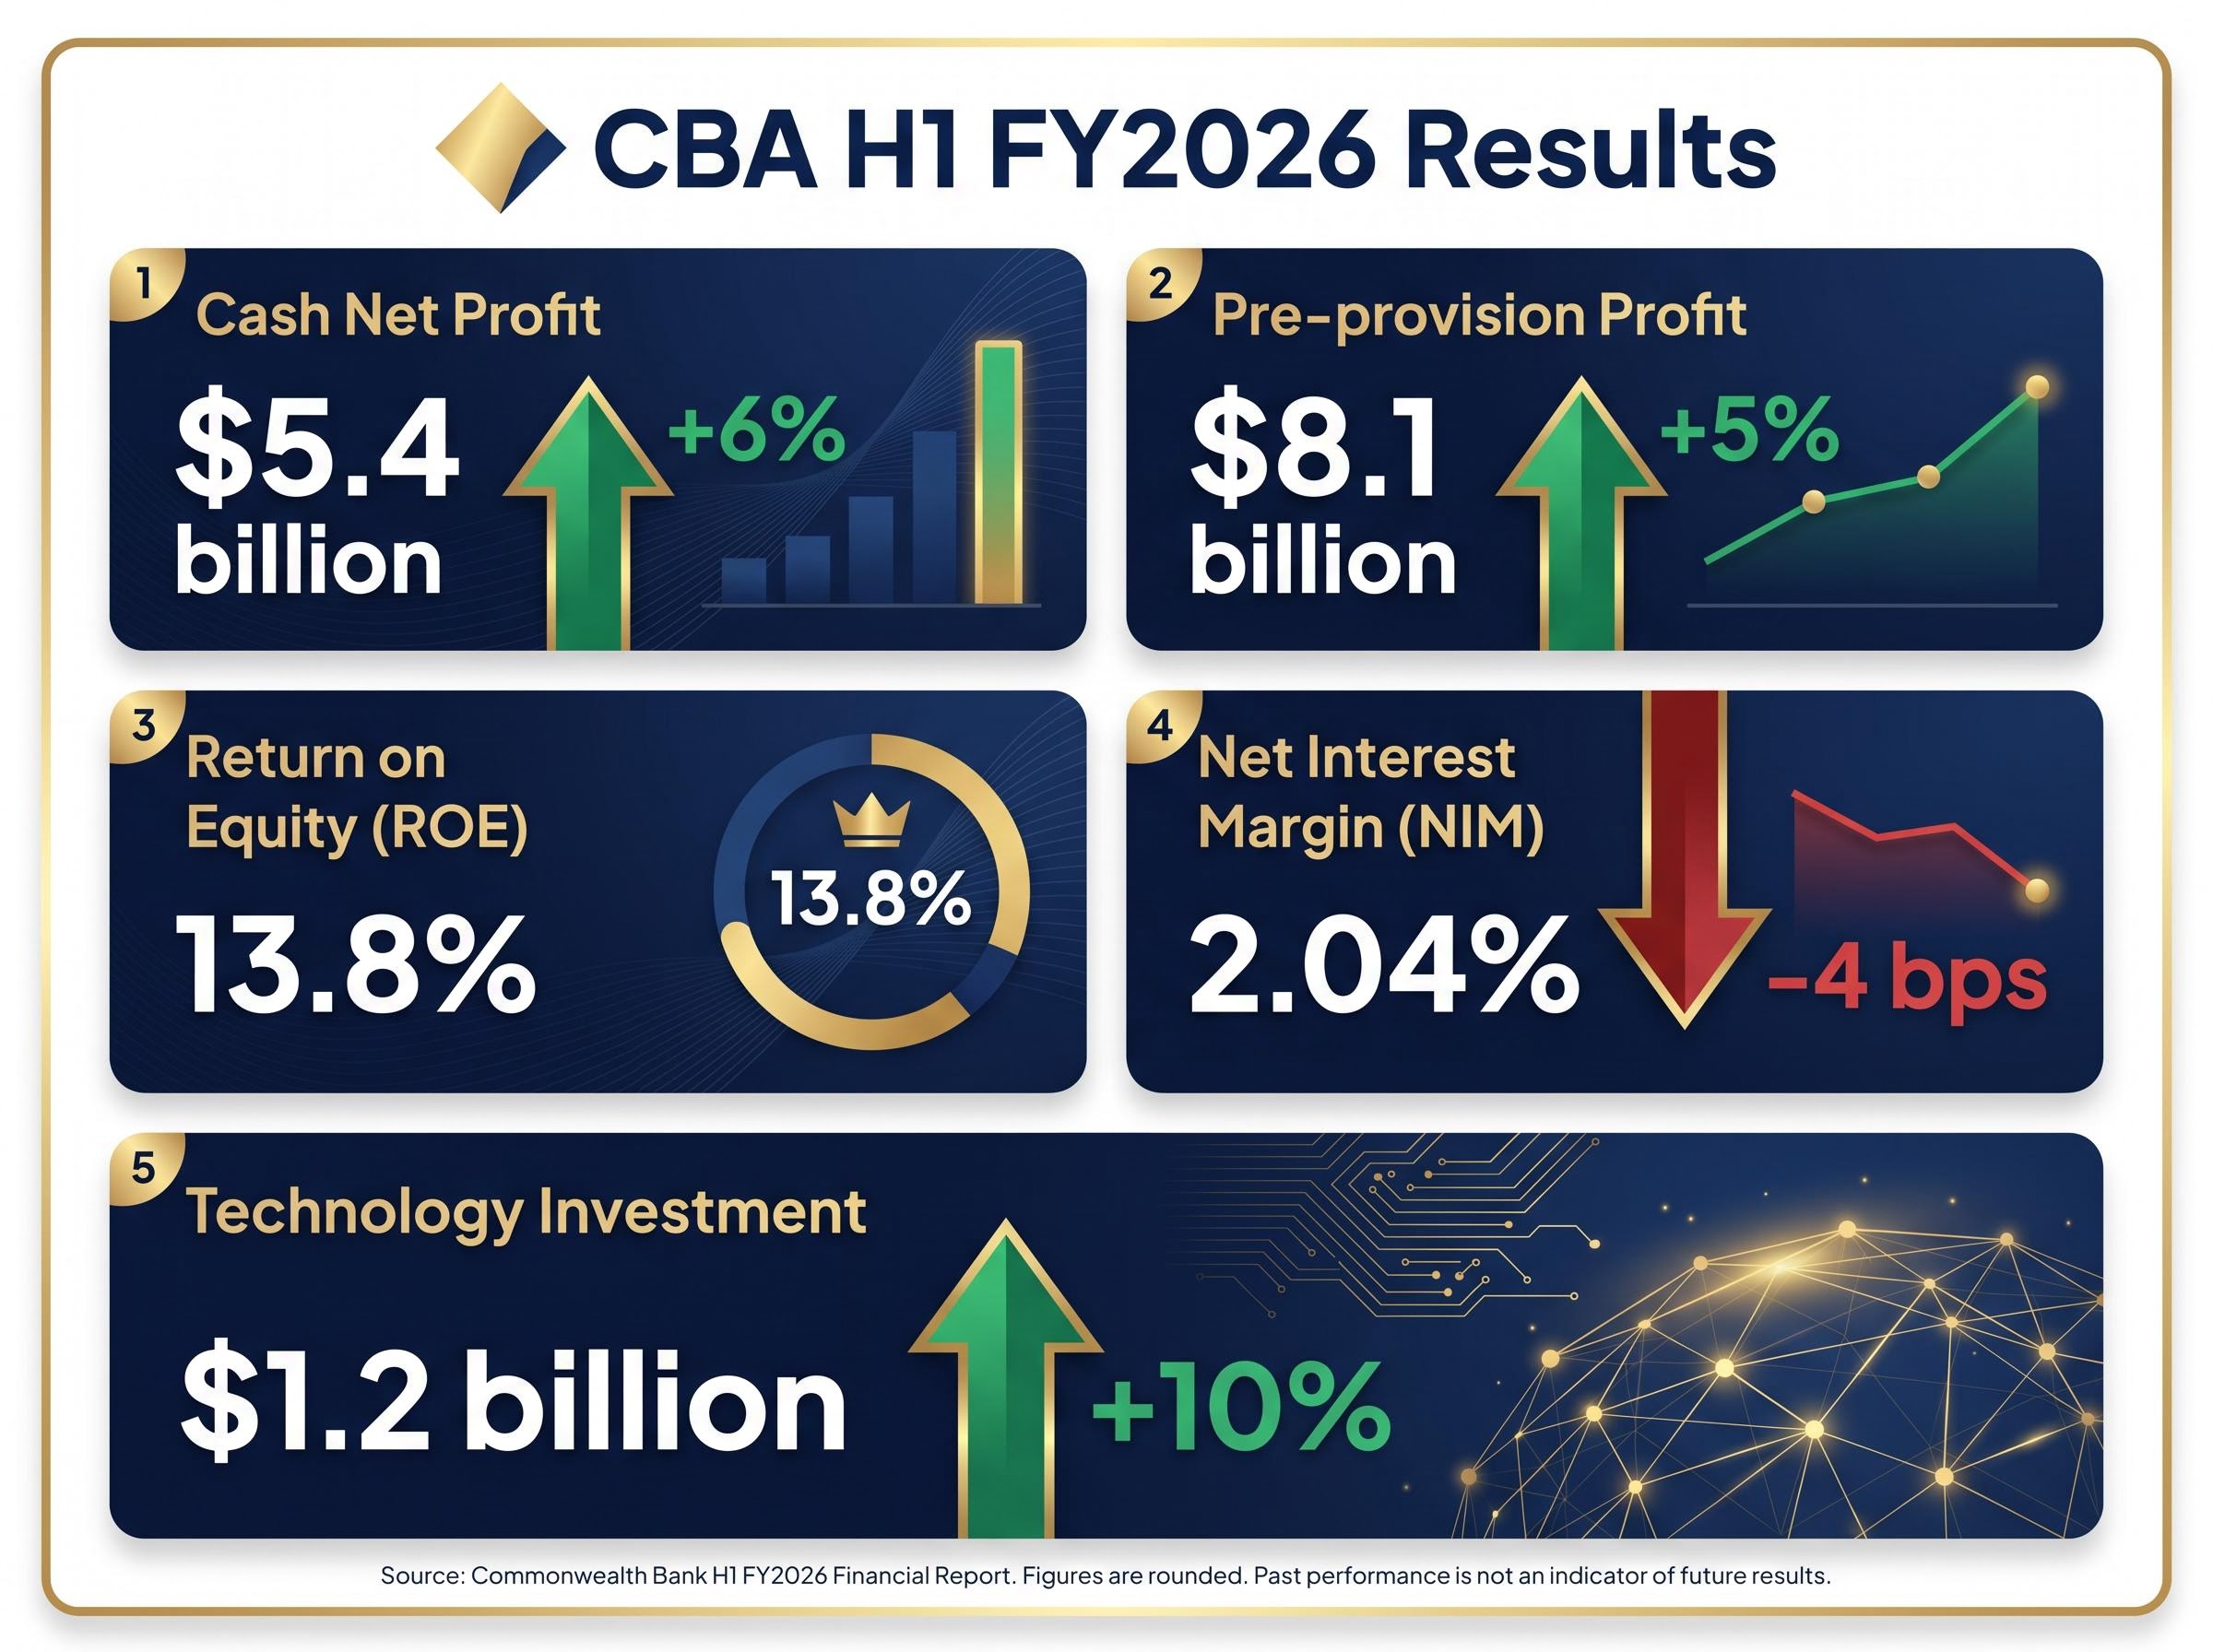
Operating expenses rose 5% to $6.7 billion, driven partly by a 10% increase in technology investment to $1.2 billion. The spending signals reinvestment in digital infrastructure rather than cost drift, though the distinction matters more across several reporting periods than in a single half.
The genuine headwind sits in the net interest margin. NIM compressed to 2.04% in H1 FY2026, down 4 basis points from the prior period. The RBA cash rate stood at 4.10% as of 18 March 2026, with a projected peak of 4.85%. In theory, rising rates expand lending spreads. In practice, intense competition in the Australian mortgage market has eroded that benefit, and CBA’s margin tells that story clearly.
CBA’s market capitalisation as of April 30, 2026 sat at approximately $291.74 billion, making it Australia’s largest listed company by that measure.
The instinct for many investors is to look for outperformance in high-growth or technology sectors. CBA’s two-year record complicates that assumption. A traditional lender, operating in one of the world’s most mature mortgage markets, outpaced the ASX 20 by nearly three times.
Three observations stand out:
None of this means CBA’s trajectory will repeat. The lesson is narrower: established businesses with income streams and market dominance can compound wealth over multi-year horizons in ways that are frequently underestimated by investors focused on growth narratives.
The two-year performance is a matter of record. The forward-looking picture is less comfortable.
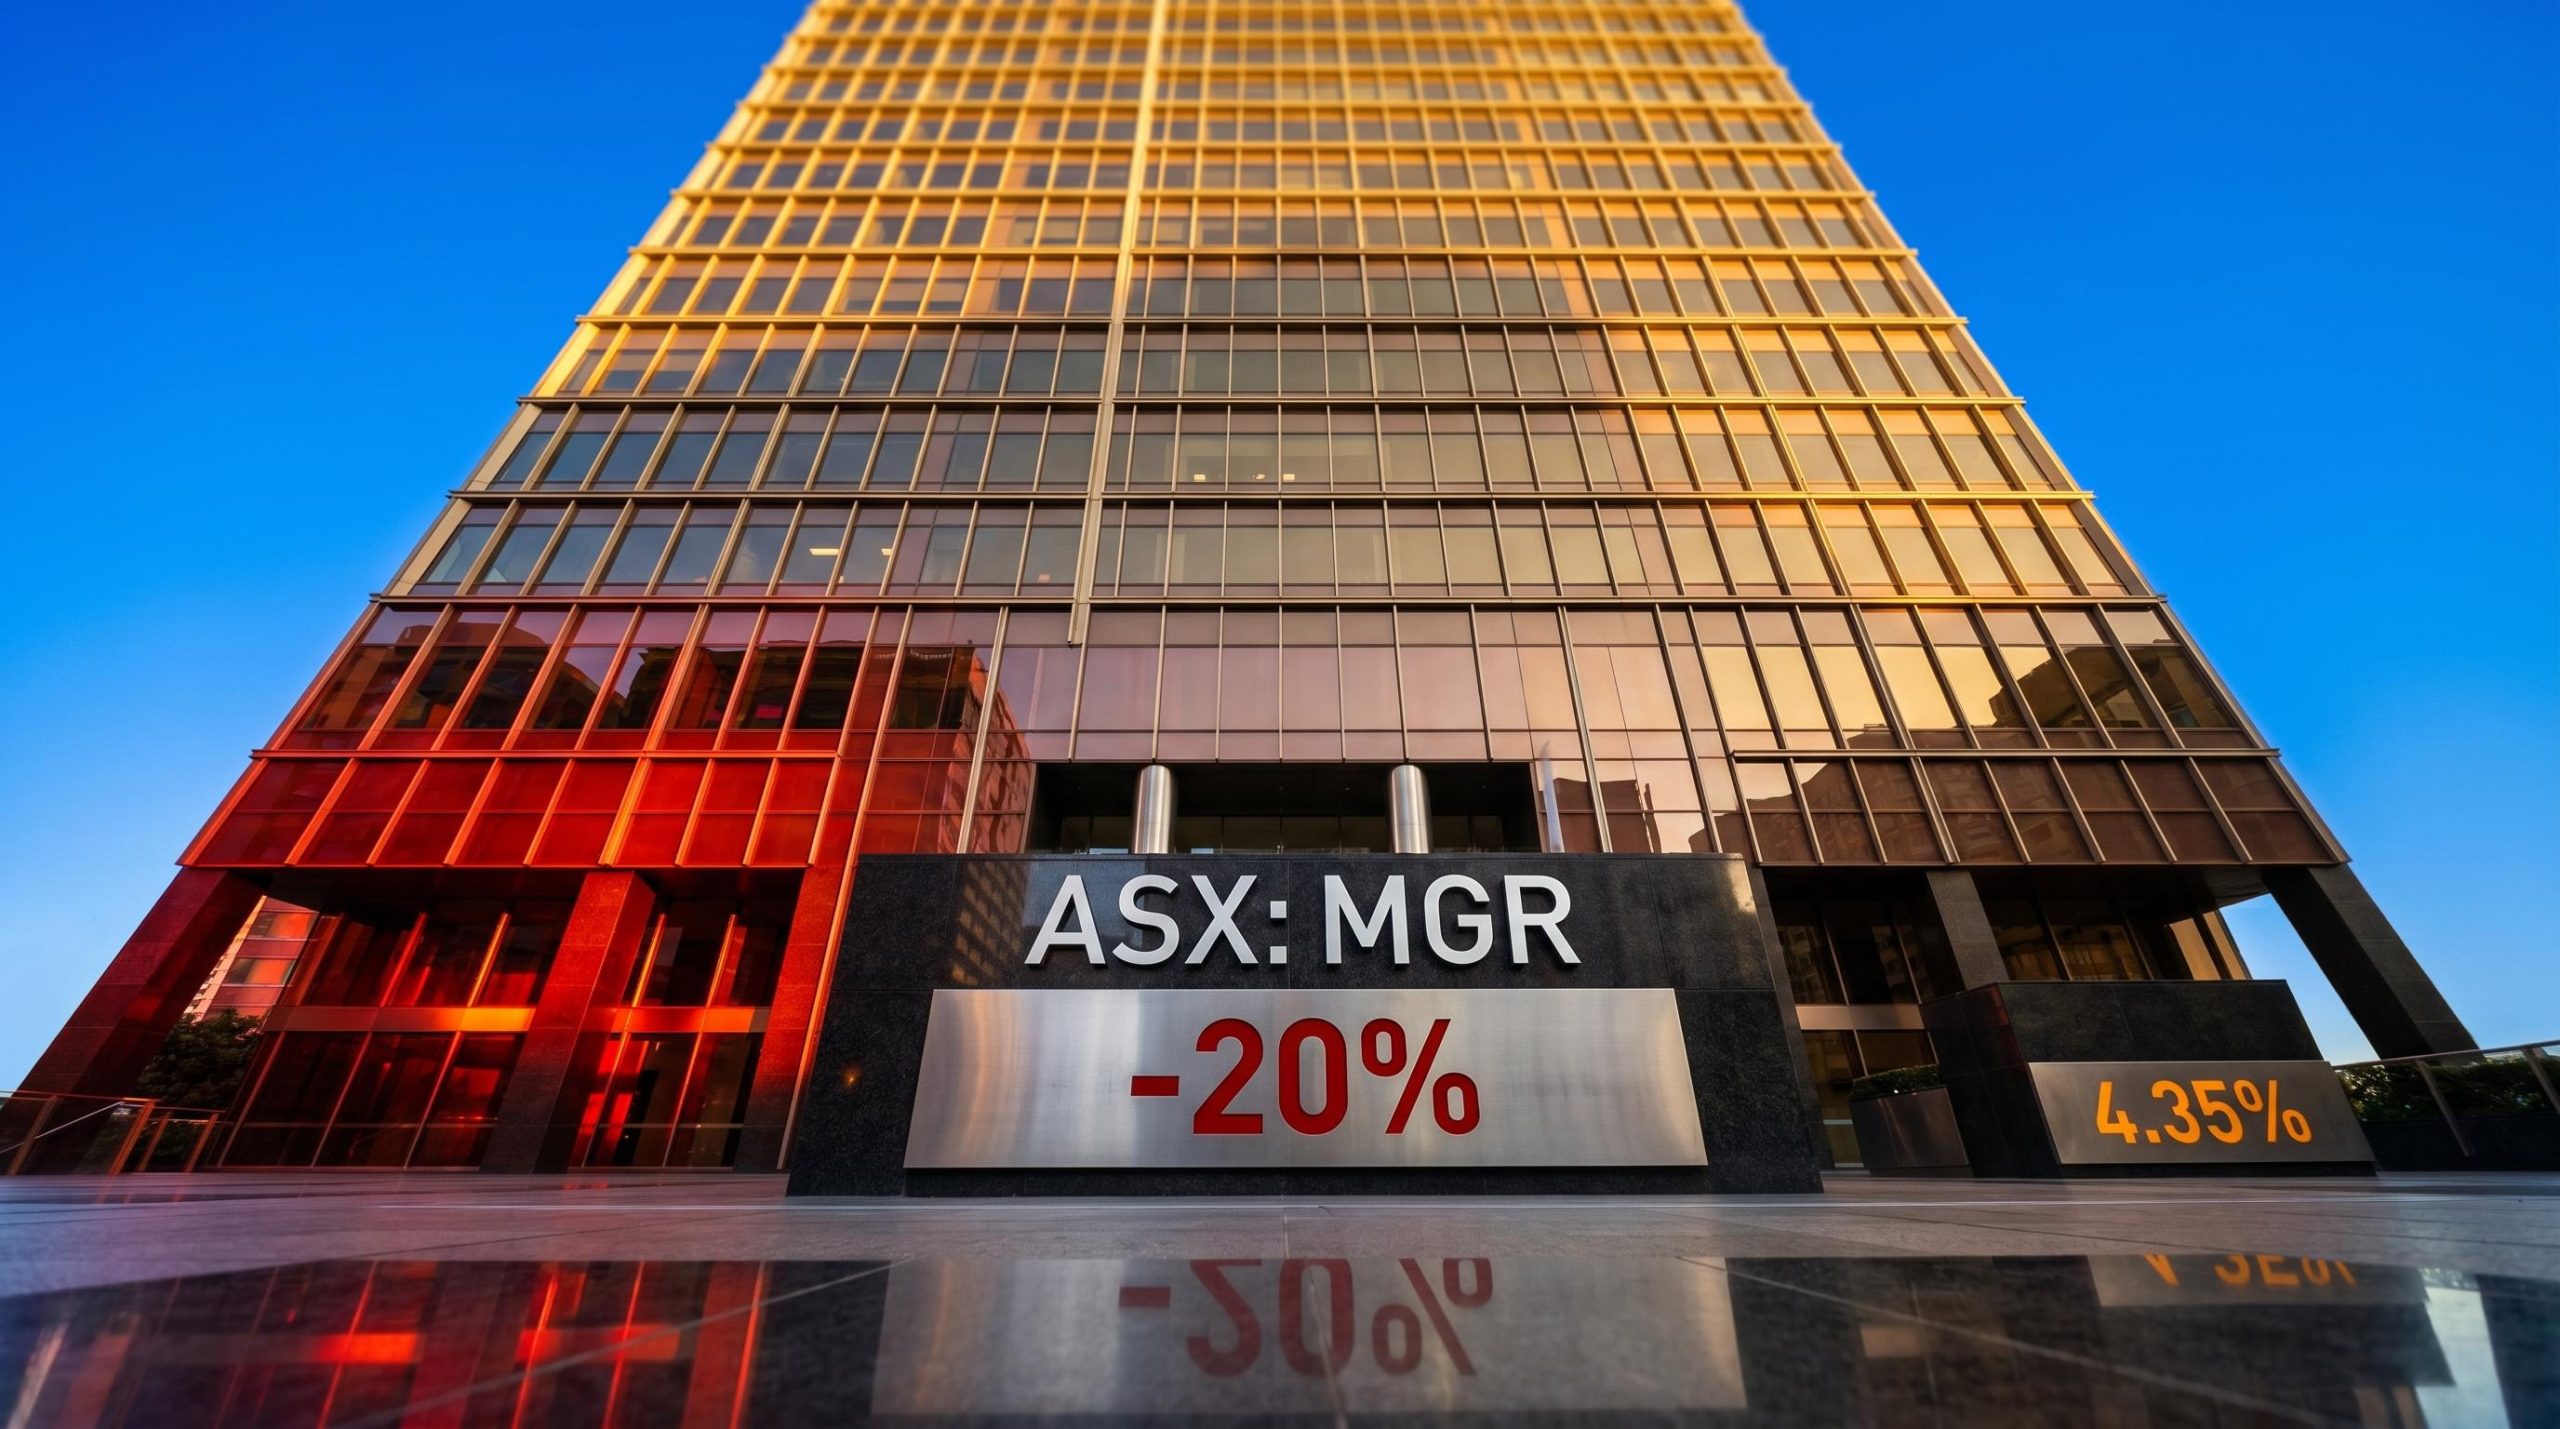
As of April 2026, 14 analysts covering CBA hold a consensus rating of strong sell. The average 12-month price target sits at $125.88, implying approximately 28% downside from the April 30 close of $173.66. The highest estimate among the group is $142, still roughly 18% below the current price.
CBA’s valuation premium over its Big Four peers is not a new phenomenon, but at roughly 27.7 times trailing earnings it now represents a gap of more than 55% above Westpac and approximately 60% above ANZ and NAB, a spread that demands sustained earnings outperformance that current low single-digit EPS growth projections do not obviously support.
At $173.66, the consensus analyst view implies approximately 28% downside to the average 12-month target of $125.88.
| Metric | Value |
|---|---|
| Current price (April 30, 2026) | $173.66 |
| Average analyst target (12-month) | $125.88 |
| High analyst target | $142.00 |
| Implied downside (average target) | ~28% |
| Implied downside (high target) | ~18% |
The analyst caution is about valuation, not operational failure. CBA’s business is performing. The concern is that the share price has moved ahead of earnings in a way that demands sustained growth to justify the current multiple. The February 25, 2026 peak close of $178.68 has already partially unwound to $173.66, suggesting momentum has plateaued.
On the other side of the ledger, CBA’s balance sheet remains well fortified. The Common Equity Tier 1 (CET1) ratio of 12.3% sits comfortably above APRA’s 10.25% minimum, providing a buffer of approximately 205 basis points. APRA’s finalisation of the AT1 phase-out in December 2025 reduced the minimum leverage ratio to 3.25% on a CET1 basis. CBA’s capital position exceeds all relevant thresholds.
APRA’s AT1 phase-out finalisation, confirmed in December 2025, restructured the minimum leverage ratio to 3.25% on a CET1 basis, a regulatory shift that further concentrates capital adequacy assessments on the highest-quality equity tier that CBA already holds well above the required threshold.
The downside risk is about price, not about the bank itself being in trouble.
ASX 200 index concentration in the Big Four banks means investors holding broad Australian equity exposure already carry significant CBA weighting, and a valuation reset in financials would remove the index’s primary structural support at a time when the broader market has already pulled back from its February 2026 record.
Understanding how a major retail bank generates profit gives investors context for interpreting rate decisions, earnings releases, and regulatory changes as they affect CBA’s outlook.
Three levers drive profitability for a bank of CBA’s scale:
CBA’s NIM of 2.04% in H1 FY2026 captures the spread between lending income and deposit costs. CEO Matt Comyn cited a resilient economy and strong labour market as supportive conditions for credit quality, but the margin compression of 4 basis points illustrates the competitive pressure on lending spreads.
Operating expenses of $6.7 billion, including $1.2 billion in technology investment, demonstrate CBA’s ongoing reinvestment in digital infrastructure, a cost line that supports long-term efficiency but weighs on near-term profit growth.
In a rising rate environment, banks can typically reprice loans upward faster than deposit rates adjust, which theoretically expands net interest margins. The RBA raised the cash rate to 3.85% in February 2026 and again to 4.10% in March 2026, with further hikes projected toward a peak of 4.85%.
RBA rate trajectory has become one of the most contested variables for CBA’s earnings outlook, with headline CPI surging to 4.6% in March 2026 and markets pricing a 62% probability of a further hike at the May board meeting, a scenario that cuts in two directions for a lender with both variable-rate mortgage exposure and deposit repricing obligations.
The countervailing force is competition. Australian lenders have offered heavily discounted mortgage rates to retain borrowers, eroding the theoretical benefit of higher benchmark rates. CBA’s NIM compression to 2.04% reflects this tension directly. The trajectory of this margin in H2 FY2026 and beyond remains one of the most significant variables for CBA’s earnings outlook.
CBA’s two-year record is genuinely strong. A 60% price gain, a 72% estimated total return, earnings growth, and a fully franked dividend profile make the case for quality. The structural advantages remain intact: dominant market position, well-capitalised balance sheet, and consistent dividend history.
The tension is equally real. 14 analysts believe the stock is approximately 28% above fair value at the current price of $173.66. The ASX 200, at 8,665.82, has pulled back from its February 2026 record of 9,128.30. CBA’s interim dividend of $2.35 per share, while growing, does not alone compensate for a potential valuation correction of that magnitude. CBA’s market capitalisation of approximately $291.74 billion prices in expectations that earnings need to meet.
Before making a decision about CBA at the current price, investors may wish to consider:
Past performance does not guarantee future results. Financial projections are subject to market conditions and various risk factors.
This article is for informational purposes only and should not be considered financial advice. Investors should conduct their own research and consult with financial professionals before making investment decisions.
CBA shares rose approximately 60% from $114.54 in April 2024 to $173.66 by April 30, 2026, and when fully franked dividends are reinvested the estimated total return rises to around 72%.
CBA pays fully franked dividends, meaning shareholders receive a credit for the 30% corporate tax already paid by the bank, which can be used to offset personal tax liability or generate a cash refund for eligible investors such as superannuation funds taxed at 15%.
As of April 2026, 14 analysts covering CBA hold a consensus rating of strong sell, with an average 12-month price target of $125.88, implying approximately 28% downside from the April 30 closing price of $173.66.
Rising RBA rates can theoretically expand bank lending spreads, but intense mortgage competition in Australia has eroded this benefit, with CBA's net interest margin compressing to 2.04% in H1 FY2026 despite the cash rate reaching 4.10% in March 2026.
CBA's most recent interim dividend of $2.35 per share (fully franked, up 4% year on year) provides meaningful income, but the consensus analyst view implies a potential valuation correction of around 28%, which investors should weigh against their income needs and risk tolerance before making a decision.