Cook Warns Memory Costs Will Force Apple Price Increases in 2026
53 mins ago
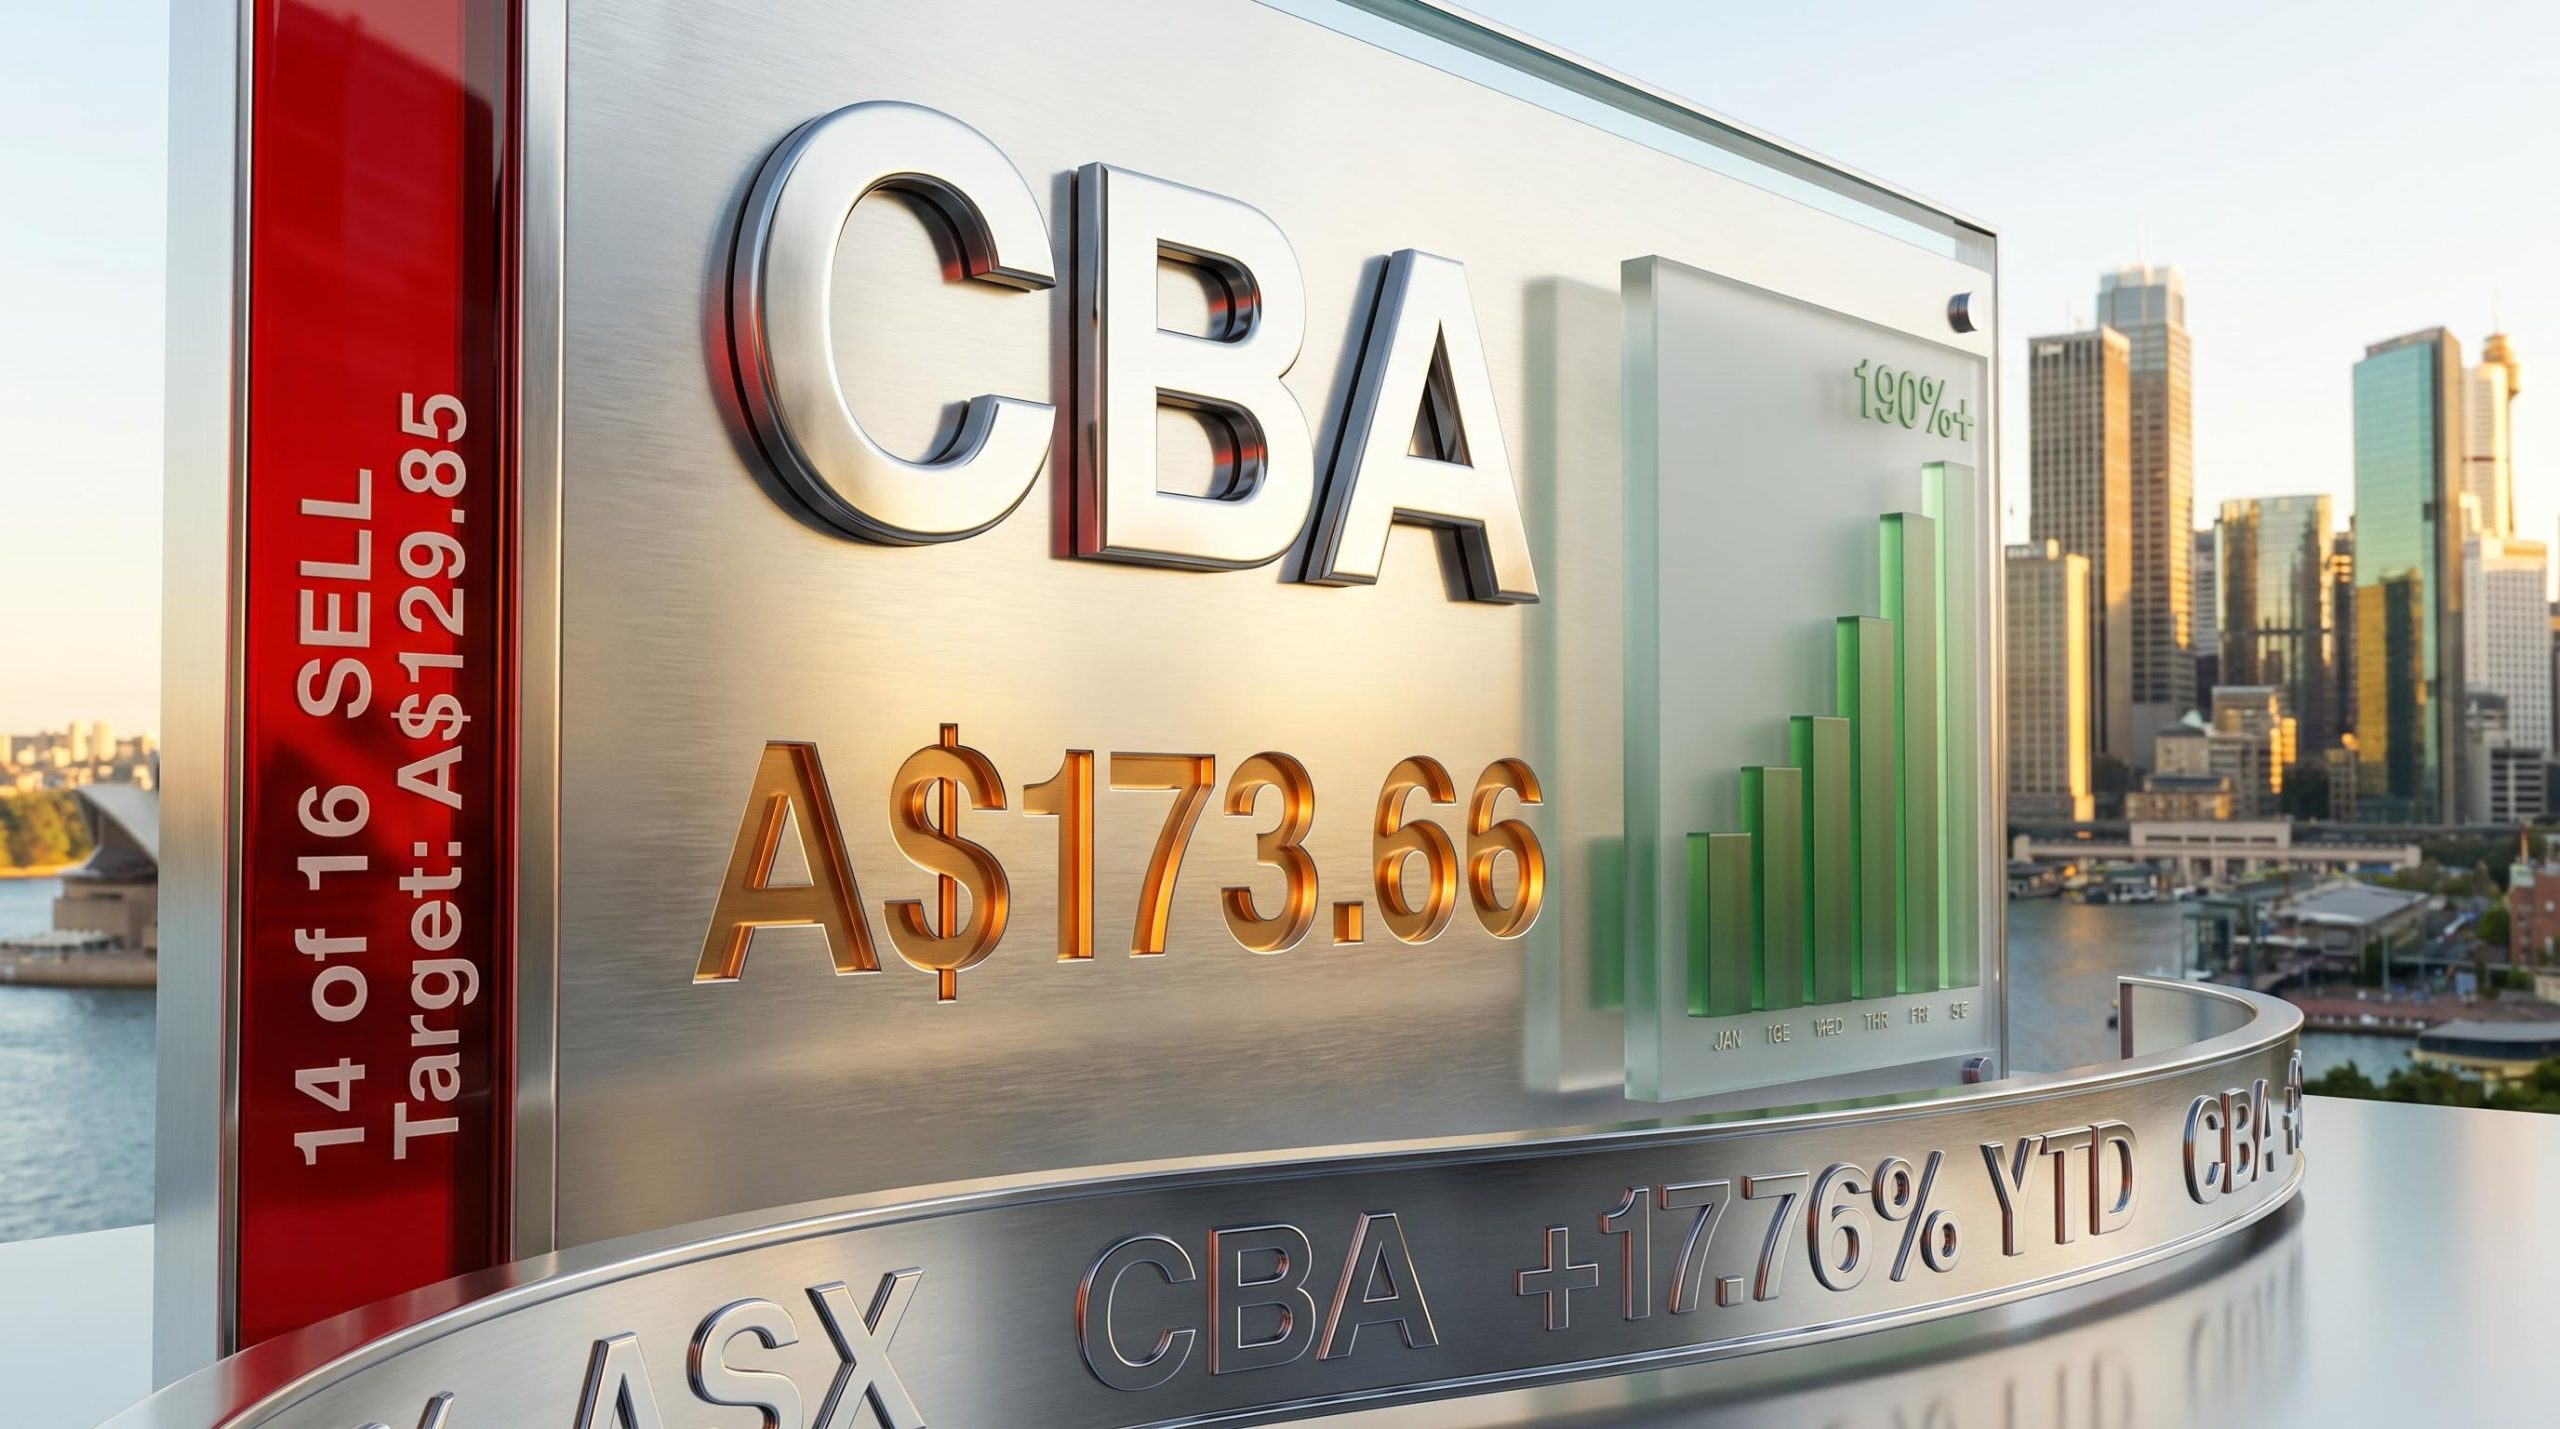
Commonwealth Bank of Australia (ASX: CBA) closed at A$173.66 on 30 April 2026, capping a year-to-date gain of approximately 17.76% and extending one of the most remarkable five-year runs on the ASX. For long-term holders, the CBA share price has delivered roughly 150% in capital appreciation alone since mid-2020, or north of 190% including dividends. Yet the professional analyst community has rarely been more bearish: 14 of 16 analysts covering the stock hold a Sell or Strong Sell rating, and the consensus 12-month price target of A$129.85 implies a 25% fall from current levels.
That is not a small gap. It is a gap that demands explanation, not dismissal. What follows is an examination of both sides of the disconnect: the evidence behind CBA’s returns, the specific mechanics of the analyst bear case, what a 31x earnings multiple actually means for a bank stock, and how Australian investors can think about position sizing when market price and professional consensus diverge this sharply.
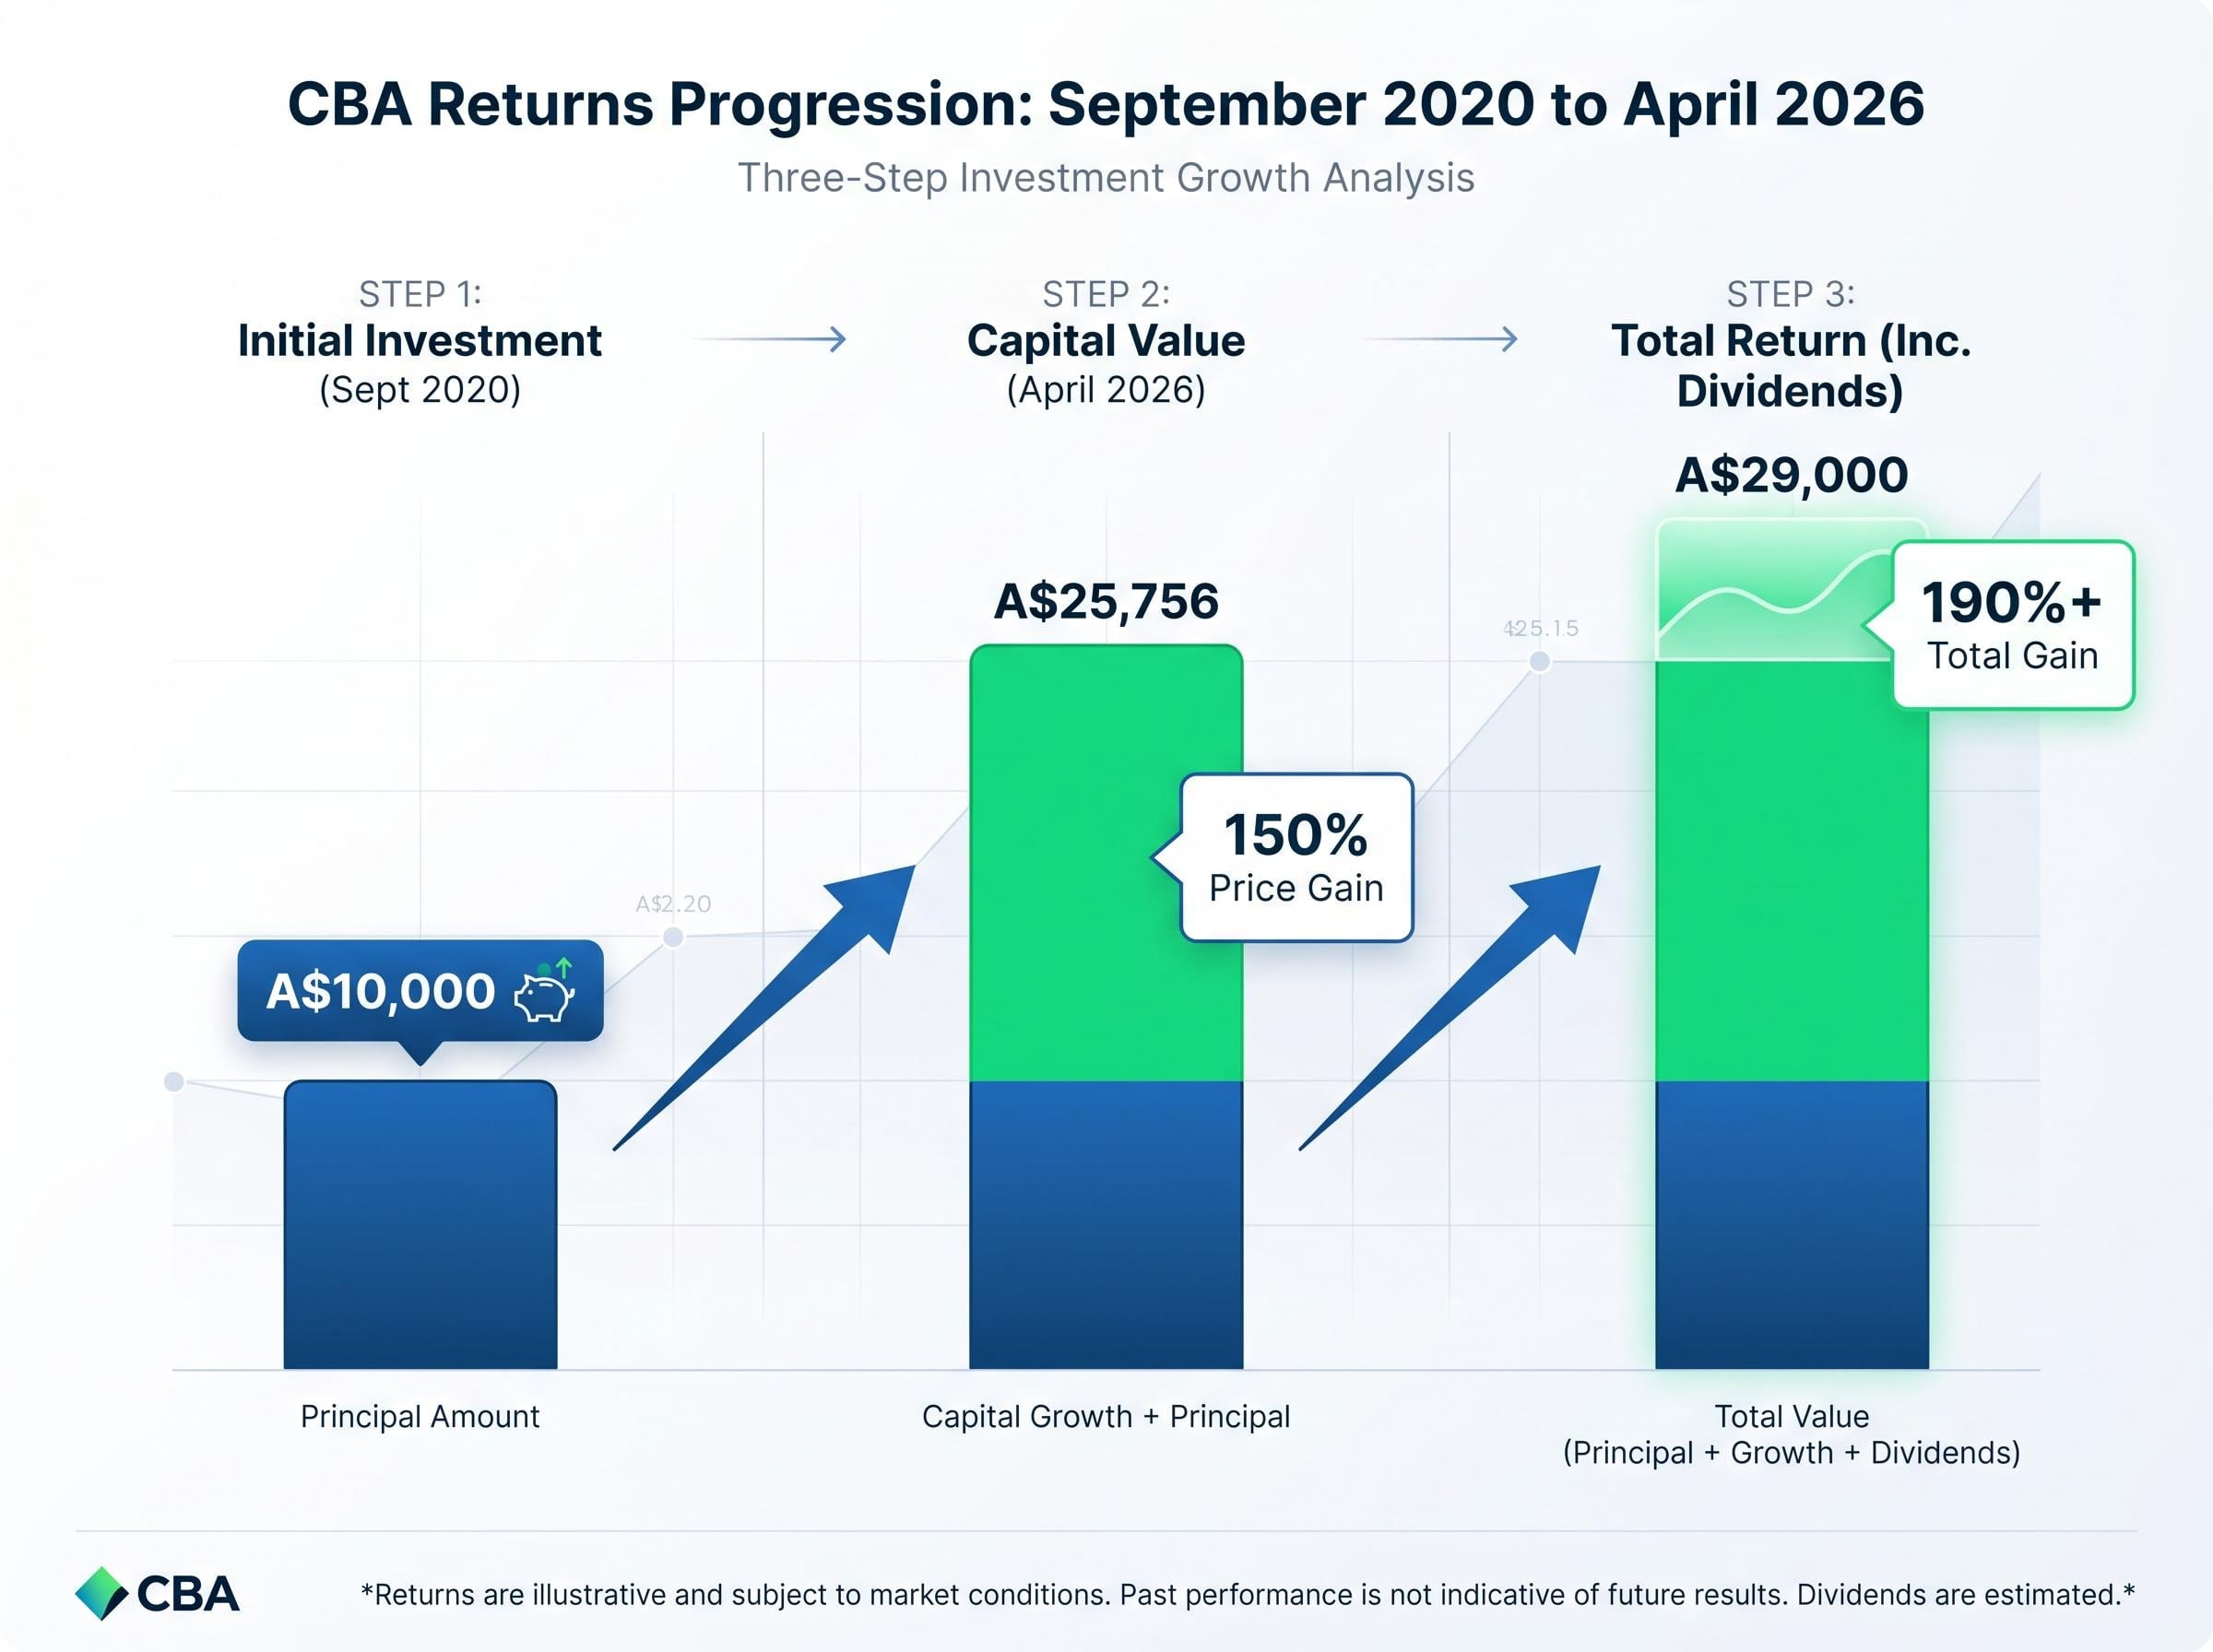
The scale of CBA’s returns is best understood in dollar terms.
A$10,000 invested in CBA in September 2020, when shares traded around A$64-73, grew to approximately A$25,756 on price appreciation alone by 30 April 2026. Including accumulated dividends, that figure approaches A$29,000, before accounting for the additional benefit of franking credits for eligible Australian resident investors.
The milestones behind that compounding story are worth isolating:
The stock touched A$185.59 on 14 April 2026, its most recent verifiable peak, before pulling back to its current level. For Australian retail investors who hold CBA as a core portfolio position, these are not paper gains. They represent genuine, compounded wealth creation delivered through a period that included rising interest rates, banking sector volatility, and persistent global uncertainty.
That performance is the context against which the analyst consensus must be weighed.
The analyst consensus on CBA is not merely cautious. It is, by the standards of blue-chip ASX coverage, unusually bearish.
According to TradingView data as of late April 2026, the rating breakdown is as follows:
| Rating | Number of Analysts | Implied Price | Implied Move from A$173.66 |
|---|---|---|---|
| Strong Sell / Sell | 14 | A$129.85 (consensus) | -25% |
| Hold | 2 | n/a | n/a |
| Buy | 0 | n/a | n/a |
| Bear case floor | 1 | A$90.00 | -48% |
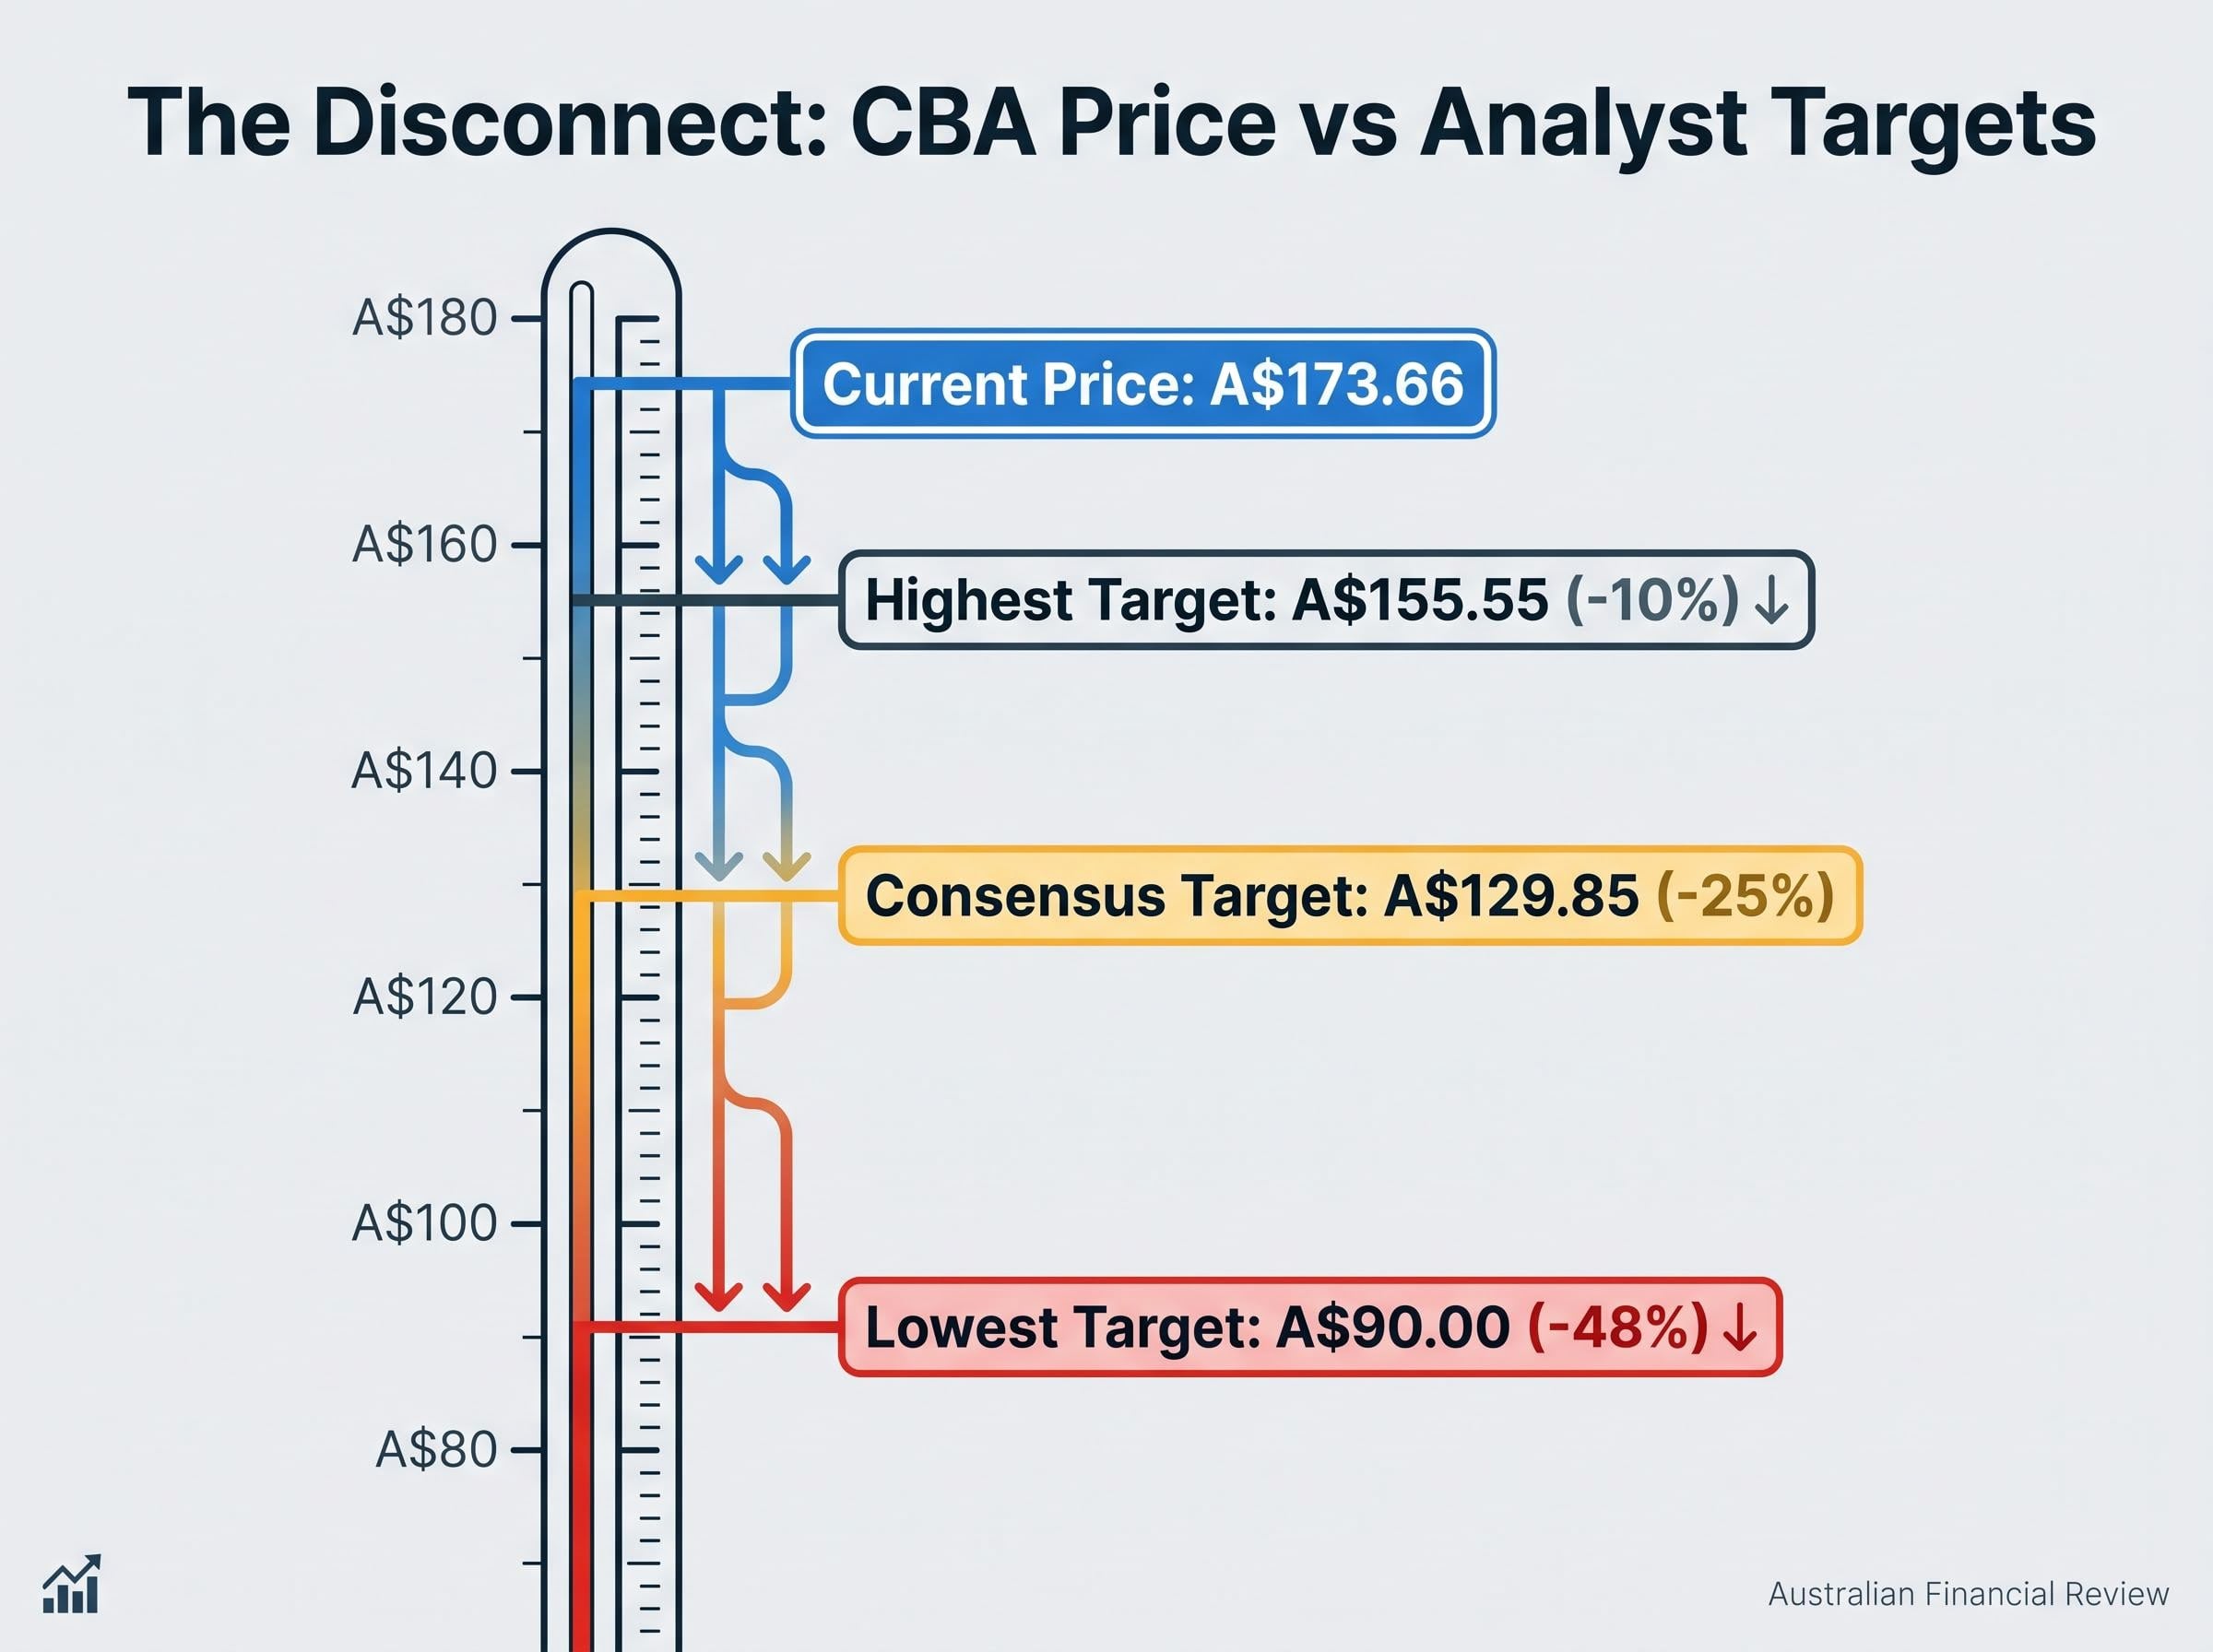
The consensus 12-month price target of A$129.85 implies approximately 25% downside from the 30 April close of A$173.66. Even the most optimistic analyst target of A$155.55 sits roughly 10% below the current price. Zero analysts rate CBA a Buy.
That is a striking level of unanimity. It does not guarantee a correction, and analysts have been consistently bearish on CBA for several years while the stock has continued to rise. But it does represent the considered view of 16 professional equity researchers whose job is to value this specific company on a 12-month forward basis. Dismissing that view requires understanding what drives it.
Banks are not growth companies. Their earnings are shaped by regulated capital requirements, credit cycle exposure, and the margin they earn on lending. For these reasons, bank stocks typically trade at lower price-to-earnings multiples than technology, healthcare, or consumer growth names. The historical range for Australian major banks has generally sat between 13x and 18x earnings.
BIS research on bank valuation multiples covering US and European institutions across a multi-decade sample period consistently identifies price-to-earnings ratios in the low-to-mid teens as the central tendency for large, well-capitalised banks, providing an independent international benchmark against which CBA’s current 31x multiple stands as a pronounced outlier.
A P/E ratio, for a bank, reflects the market’s confidence in the stability and growth trajectory of the loan book, the durability of net interest margins, and the quality of regulatory capital management. At 31x, the market is pricing CBA as though it can sustain earnings growth well above what its underlying business model has historically delivered.
CBA reported FY2025 cash NPAT of A$10,252 million, up 4% year-on-year. That is solid, but it is not the kind of growth trajectory that typically justifies a 31x multiple in any sector, let alone banking.
The premium becomes more visible in relative terms. ANZ, NAB, and Westpac all trade at materially lower multiples than CBA, making CBA an outlier not just against global banking peers but within its own domestic peer group. Analyst commentary frequently describes CBA as one of the most expensive major banks globally on an earnings basis.
Even the highest analyst price target of A$155.55 implies a meaningful de-rating from the current 31x multiple. The question is not whether CBA deserves some premium for its brand strength and market position. The question is whether that premium should be this large.
Australian bank overvaluation is not a risk isolated to CBA; Morningstar has flagged all four major banks as trading above fair value, meaning investors in ASX 200 index funds or superannuation with a domestic equity bias are running a concentrated bet on shared sector risk factors rather than a genuinely diversified portfolio.
The analyst consensus tells one story. The capital flows tell another, and the investors driving those flows have reasons that are not irrational.
CBA’s income credentials are difficult to dismiss:
For eligible Australian resident investors, fully franked dividends carry additional after-tax value through the imputation credit system. This effective yield enhancement is a benefit unique to the Australian tax framework and is a material factor in how self-managed super fund (SMSF) trustees and retirees value CBA as an income holding.
The deeper point is structural. Analysts price stocks on 12-month forward horizons. Income investors price them on yield, franking, and reliability measured over years or decades. These are different valuation frameworks applied to the same company, and neither is inherently wrong. The tension between them is a genuine analytical disagreement, not a case of retail naivety versus professional insight.
The Reserve Bank of Australia raised the cash rate by 25 basis points to 4.10% in March 2026, with market expectations pointing to the possibility of further hikes. For CBA, the implications cut both ways:
The RBA cash rate outlook sharpened considerably after March 2026 CPI data showed headline inflation at 4.6%, well above the 2-3% target band, with markets at the time pricing a 62% probability of a further hike at the May board meeting that would lift the cash rate to 4.35%.
CBA’s dominant exposure to Australian residential mortgages makes it particularly sensitive to both RBA decisions and broader housing market conditions. Any material deterioration in property prices or a meaningful rise in mortgage stress would disproportionately affect CBA’s earnings outlook.
The RBA’s March 2026 monetary policy decision confirmed a 25 basis point increase to 4.10%, with the Board’s accompanying statement citing persistent domestic inflation and resilient labour market conditions as the primary justifications for the tightening move.
The most instructive recent example of how elevated expectations create asymmetric risk arrived on 13 August 2025. CBA reported FY2025 results showing 4% cash NPAT growth. By most measures, a solid result. The share price fell approximately 5.4% on the day.
At 31x earnings, the asymmetry is unfavourable. Upside requires beating expectations that are already elevated. Downside requires only meeting them. For investors holding CBA at current levels, the stock does not need a bad result to decline. It needs only a result that fails to justify the premium already priced in.
CBA is simultaneously one of the strongest long-term performers on the ASX and one of the most expensive bank stocks in the world. Both statements are true. The question for investors in 2026 is not whether CBA is a good company; it is whether A$173.66 reflects good value.
The answer depends on individual circumstances. Investors weighing their CBA position should consider:
The pullback from the April peak of A$185.59 to A$173.66 (approximately 6.4%) and commentary from the Australian Financial Review noting CBA faces an “uphill battle to win back investors in 2026” suggest that momentum alone may not sustain the premium indefinitely. The question is whether investors are positioned for that possibility.
For investors prompted by the CBA analysis to review their broader equity allocation, our comprehensive walkthrough of ASX portfolio positioning during inflation covers how rising rates affect different ASX asset classes, which instruments historically provide resilience near the rate peak, and how to avoid reactive decisions that lock in losses before a policy pivot.
CBA has delivered exceptional returns and remains a credible income stock with an unbroken dividend record stretching back nearly two decades. That track record has earned the loyalty of Australian retail investors.
At the same time, 14 of 16 professional analysts have placed a Sell rating on the stock, and their consensus target of A$129.85 represents a specific, quantified view that the current price overshoots fair value by a quarter. Investors holding CBA at A$173.66 are accepting that risk, whether consciously or not.
The most constructive use of the analyst consensus is not as a sell signal in isolation. It is as a prompt to review position size, cost basis, income reliance, and portfolio diversification. CBA’s long-term record speaks for itself. The question for 2026 is whether the price reflects the value, and whether investors have sized their exposure for both answers.
This article is for informational purposes only and should not be considered financial advice. Investors should conduct their own research and consult with financial professionals before making investment decisions.
Commonwealth Bank of Australia (ASX: CBA) closed at A$173.66 on 30 April 2026, delivering a year-to-date gain of approximately 17.76% and a five-year total return (including dividends) of more than 190%.
14 of 16 analysts rate CBA a Sell or Strong Sell primarily because the stock trades at roughly 31 times earnings, far above the historical 13x-18x range for major Australian banks, with the consensus 12-month price target of A$129.85 implying approximately 25% downside from current levels.
A P/E ratio of 31x is unusually high for a bank, which typically trades between 13x and 18x earnings; at this premium, investors are pricing in exceptional growth that CBA's recent 4% cash NPAT growth does not clearly support, creating an asymmetric risk where only a disappointing result is needed to push the share price lower.
CBA has paid uninterrupted semi-annual fully franked dividends since 2006, with the most recent dividend of A$2.35 per share; for eligible Australian resident investors, including SMSF trustees, franking credits provide additional after-tax value through the imputation credit system, strengthening the income case even when valuation concerns exist.
Investors should weigh their time horizon, reliance on franked dividend income, portfolio concentration in CBA relative to total equity exposure, the capital gains tax implications of selling shares with roughly 150% embedded gains, and their personal tolerance for the analyst-implied downside range of 25%-48%.