Barclays Warns of Prolonged Market Volatility Under New Fed Reality
4 mins ago

One broker has placed a sell rating on every member of Australia’s big four banks, implying downside of up to 28% on Commonwealth Bank of Australia. That is the backdrop against which income investors are attempting to determine whether Australian bank shares still belong in a yield-focused portfolio. As of late April 2026, the big four have pulled back alongside the broader ASX 200, which dropped roughly 2% over the most recent five-day trading window. ANZ fell approximately 2.6%, CBA around 3.24%, NAB roughly 1.9%, and Westpac a modest 0.8%. With the RBA cash rate sitting at approximately 4.35% and 12-month term deposit rates running at 5.00-5.10% across the majors, the yield arithmetic for bank shares is less comfortable than it has been in years. What follows maps the analyst sentiment gap between ANZ and its peers, examines what the dividend data actually says for income-oriented investors, and stress-tests the case for holding bank shares when cash is paying more.
Morgans has sell ratings on all four major banks, and the implied downside figures are not the polite, single-digit haircuts that typically accompany cautious broker calls. On CBA, the price target sits at $124.26, roughly 28% below its recent trading price of $173.66. On NAB, the target is $34.56, implying approximately 14% downside from $41.25. Westpac carries a $34.06 target, or about 12% below $38.43. ANZ rounds out the quartet at $30.72, representing just over 14% downside from $37.73.
CBA’s valuation premium is not a new phenomenon: the bank trades at a trailing price-to-earnings ratio of approximately 27.9x, roughly 66% above its 10-year median multiple of 16.8x, which contextualises why Morgans’ $124.26 target represents a reversion toward historical norms rather than an extreme bear case.
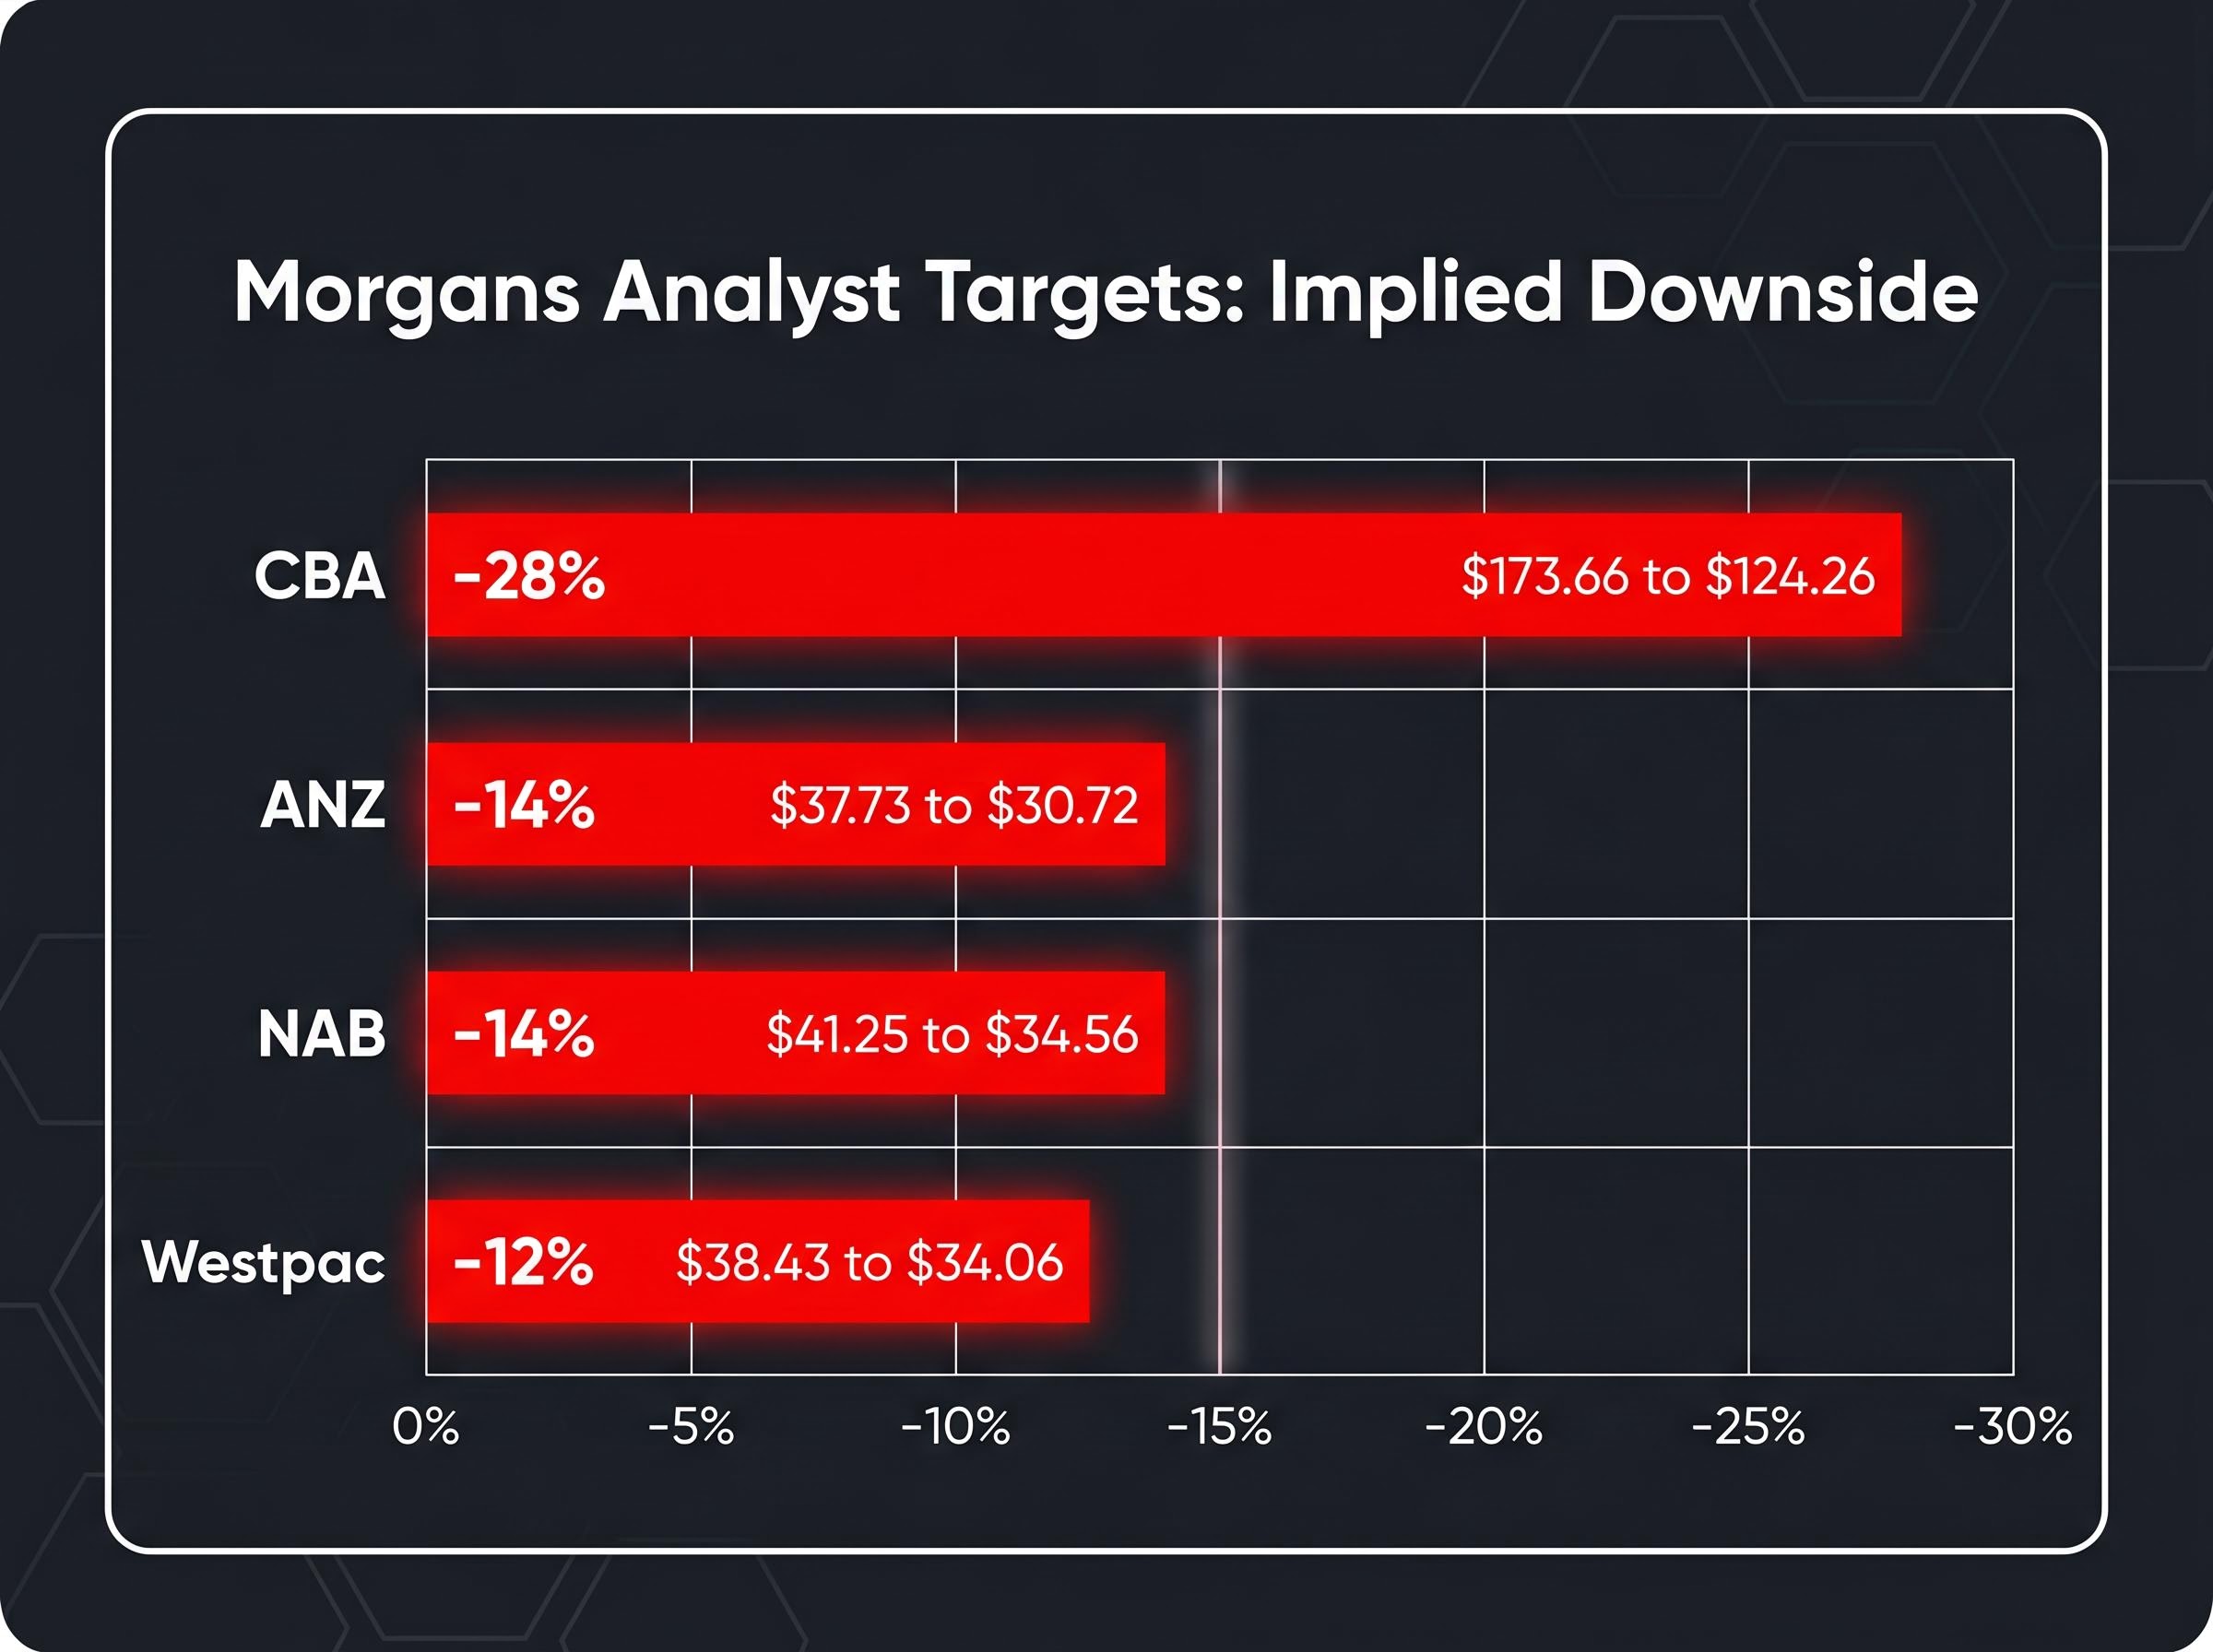
| Bank | Current Price | Morgans Target | Implied Downside |
|---|---|---|---|
| CBA | $173.66 | $124.26 | ~28% |
| ANZ | $37.73 | $30.72 | ~14% |
| NAB | $41.25 | $34.56 | ~14% |
| Westpac | $38.43 | $34.06 | ~12% |
The bearish read is not confined to a single broker. Independent commentary reinforces the caution.
Catapult Wealth’s Dylan Evans has suggested current conditions may suit profit-taking on CBA, adding a second voice to the view that the most widely held stock on the ASX is priced beyond what fundamentals support.
A sell rating is not a binary instruction to sell. But 28% implied downside on CBA, and double-digit gaps across the remaining three, warrants scrutiny before treating current weakness as a buying opportunity.
Across the big four, ANZ is the only stock still attracting meaningfully bullish coverage. That distinction matters.
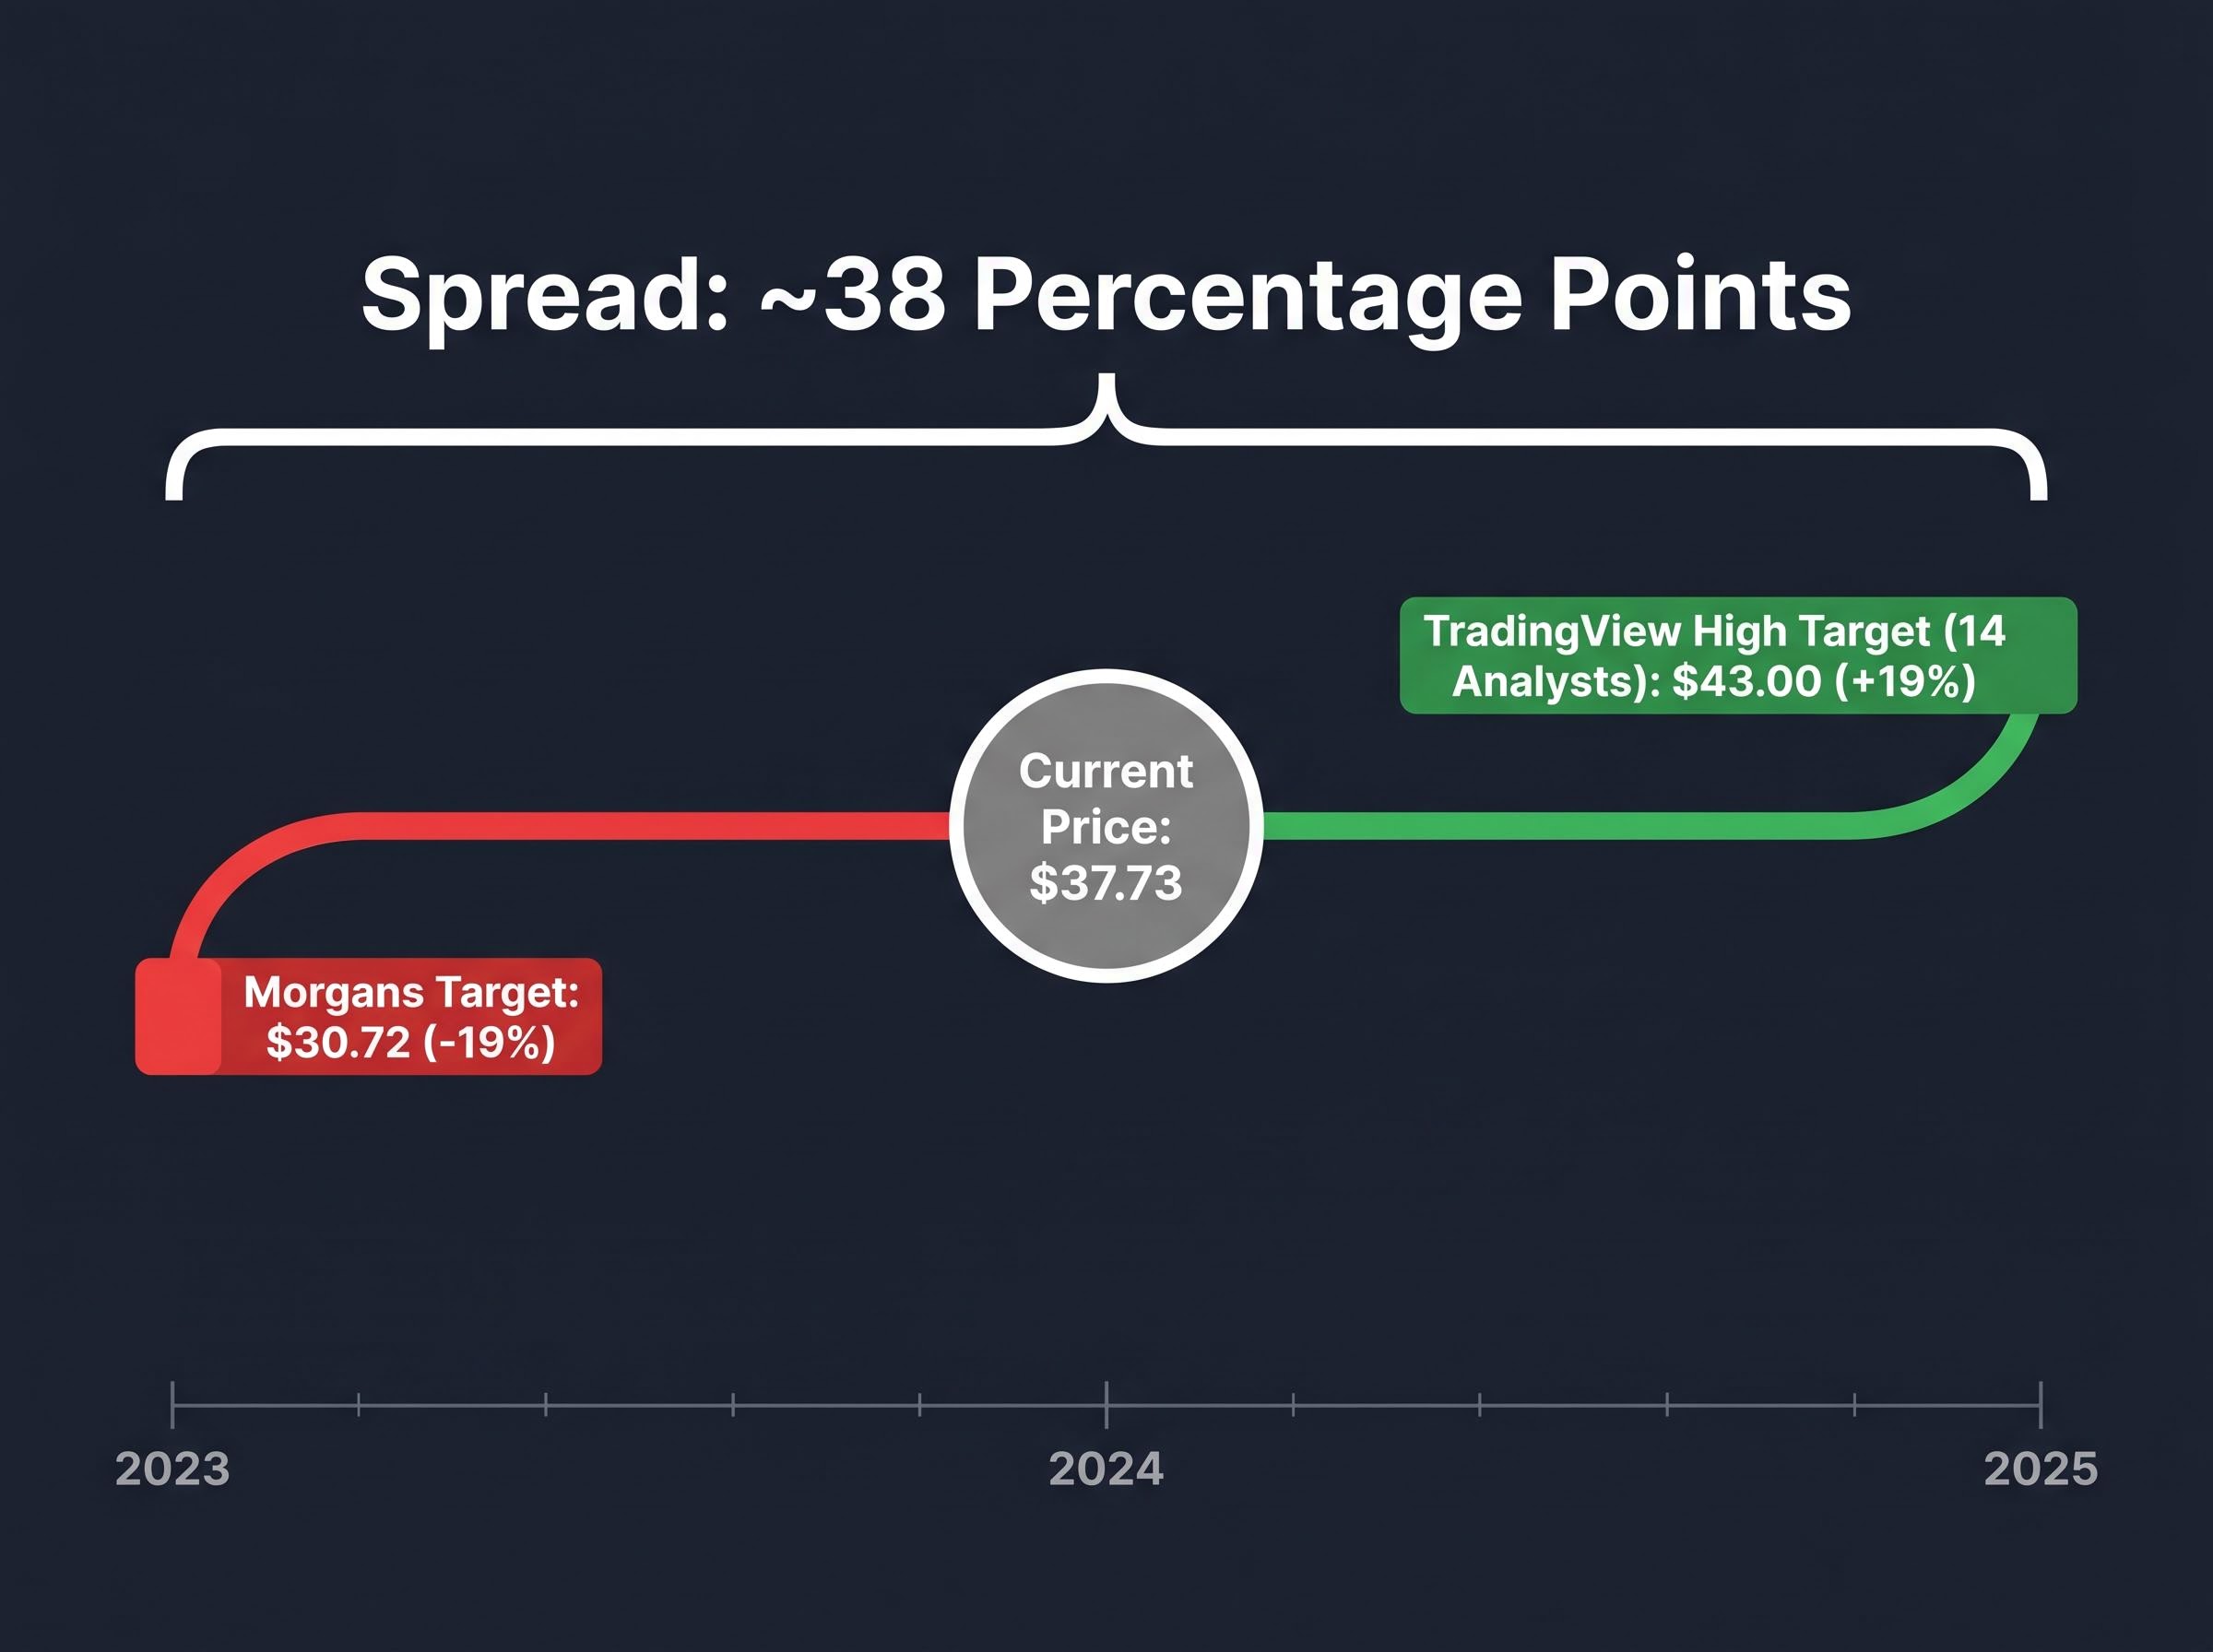
According to TradingView data from 14 covering analysts, the high price target on ANZ sits at $43 per share, representing approximately 19% upside from the current $37.73.
Set that against Morgans’ bear case of $30.72, which implies roughly 19% downside. The spread between the most optimistic and most pessimistic view on ANZ is approximately 38 percentage points. That is not noise; it is a genuine valuation disagreement among professional analysts covering the same company with the same data.
Part of the context is that ANZ has already delivered. The stock’s 12-month price return of approximately 21.17% to April 2026 means recent buyers are not underwater, and the current pullback follows a strong run rather than a prolonged decline.
ANZ’s FY25 full-year results (for the year ended 30 September 2025) showed statutory profit down 10% to $5.891 billion, while cash profit held approximately stable at $6.896 billion. The divergence between those two figures reflects non-cash items that did not impair the bank’s capacity to generate operating earnings.
The more relevant signal for income investors was the final dividend: 83 cents per share, held steady despite the statutory profit decline. Maintaining the payout in a softer earnings year was read positively for income stability, and it sets up the dividend sustainability argument that follows.
Bank dividend yields are quoted as headline figures, but for Australian taxpayers, the actual income received depends on franking credits. A franking credit represents tax already paid by the company on the profit from which the dividend is drawn. The investor receives the dividend plus a credit against their personal tax liability, which means the effective, or “grossed-up,” yield exceeds the headline number.
The ATO franking distributions guidance establishes how companies attach franking credits to dividends based on tax already paid at the corporate rate, with the credit then applied against the shareholder’s personal tax liability to produce the grossed-up return that makes partial franking on ANZ’s dividend meaningfully different in value across investor tax brackets.
ANZ’s FY25 final dividend of 83 cents per share was 70% partially franked. That partial franking means the grossed-up yield is higher than the headline, but not as high as it would be under full franking. The calculation works as follows:
The benefit varies by investor. A self-managed super fund in pension phase, paying zero tax, captures the full franking credit as a cash refund. An investor on the top marginal rate receives a tax offset. An investor on a lower marginal rate derives less benefit, which is where the comparison to term deposits becomes uncomfortable.
Franking credit compounding over multi-year holding periods can materially widen the gap between the headline price return and the true total return; a worked example across the two years to April 2026 shows CBA’s 52.5% price gain translating to an estimated 72% total return once fully franked dividends were reinvested, a differential that underscores why tax-rate context shapes how different investors should weigh the income case.
ANZ’s payout ratio of approximately 84% means the bank is distributing the vast majority of its cash earnings as dividends. That leaves limited capacity to grow payouts unless earnings expand.
The FY26 DPS forecast of approximately $1.68 implies only modest growth from the current $1.66, consistent with a constrained payout environment. For investors prioritising income stability over income growth, this is acceptable. For those seeking rising distributions, the ceiling is visible.
For income investors choosing between the two most yield-visible majors, the comparison is direct. ANZ offers a higher current yield; Westpac offers a more visible upward trajectory.
Westpac’s trailing dividend sits at $1.54 per share, producing a yield of approximately 3.85% at $38.43. The FY26 DPS forecast rises to $1.605, and the FY27 forecast to $1.64. That sequence, from $1.54 to $1.64 over two years, represents gradual but consistent payout growth.
| Metric | ANZ | Westpac |
|---|---|---|
| Current DPS | $1.66 | $1.54 |
| Trailing Yield | ~4.40% | ~3.85% |
| FY26 DPS Forecast | ~$1.68 | ~$1.605 |
| FY27 DPS Forecast | Not confirmed | ~$1.64 |
| Franking | 70% partial | Fully franked |
CBA and NAB FY26-FY27 consensus DPS figures are not confirmed in available data, which limits the scope of a full four-way comparison. Between ANZ and Westpac, the decision rests on whether a higher starting yield or a more visible growth trajectory better matches the investor’s income strategy.
For income investors weighing whether to prioritise Westpac’s growth trajectory over ANZ’s higher starting yield, our dedicated guide to Westpac’s dividend growth trajectory examines the specific risks that could derail the path from $1.53 to a projected $1.70 by FY28, including UNITE programme cost overruns, mortgage margin compression, and the credit quality assumptions embedded in each forecast year.
The arithmetic is uncomfortable. NAB and CBA are both offering 12-month term deposit rates of approximately 5.10%. Westpac sits at approximately 5.00%. These are guaranteed, capital-protected returns.
At current prices, ANZ’s headline yield of approximately 4.40% trails term deposit rates by roughly 60-70 basis points. Westpac’s trailing yield of 3.85% falls short by 115-125 basis points. The gap is real, and for many investors it is the single most relevant number in this analysis.
Bank shares can still win the income comparison, but only under specific conditions:
Investors in lower tax brackets who derive less benefit from franking credits face the most challenging version of this trade-off. For them, the yield gap to term deposits is widest, and the case for bank shares rests almost entirely on capital appreciation and dividend growth assumptions.
Investors in lower tax brackets who find the yield gap to term deposits widest may benefit from examining inflation-adjusted income alternatives more broadly; a structured approach across investment-grade bond ETFs, quality-factor global equities, and cash instruments can build a portfolio that targets positive real returns without requiring a bet on bank share capital appreciation.
The bearish broker sentiment is real. The yield-versus-cash gap is real. Neither of those facts eliminates the income case for bank shares, but they narrow the investor profile for whom that case is strongest.
Bank shares remain most compelling for:
For investors outside those profiles, particularly those in lower tax brackets or with short holding horizons, term deposits at 5.00-5.10% represent a more straightforward income proposition.
Within the group, ANZ presents the most asymmetric risk-reward profile for income investors. The Morgans downside target of $30.72 implies roughly 14% capital risk, the most modest bear case in the sector compared to CBA’s 28%. The bull case target of $43 implies 19% upside. The forward yield of approximately 4.45-4.50%, supplemented by partial franking, sits above the sector average.
ANZ is not immune to the pressures facing the sector. An 84% payout ratio constrains dividend growth, and the sell ratings from Morgans apply to all four banks without exception. But for risk-conscious income investors who want bank exposure while minimising capital risk relative to income received, the spread between ANZ’s bear and bull cases is the widest window of opportunity the big four currently offer.
This article is for informational purposes only and should not be considered financial advice. Investors should conduct their own research and consult with financial professionals before making investment decisions. Past performance does not guarantee future results. Financial projections are subject to market conditions and various risk factors.
A franking credit represents tax already paid by the company on the profit from which a dividend is drawn, allowing Australian shareholders to offset that amount against their personal tax liability and receive a higher effective yield than the headline dividend figure suggests.
Among the big four, ANZ presents the most asymmetric risk-reward profile, with Morgans' bear case implying roughly 14% downside compared to CBA's 28%, while the bull case target of $43 implies approximately 19% upside from the April 2026 price of $37.73.
Bank shares can still outperform term deposits on an after-tax basis for investors in higher marginal tax brackets who benefit most from franking credits, but investors in lower tax brackets face a real yield gap of 60 to 125 basis points in favour of term deposits at current prices.
Morgans has set a price target of $124.26 on CBA, implying approximately 28% downside from its recent price of $173.66, largely because CBA trades at a trailing price-to-earnings ratio of around 27.9x, roughly 66% above its 10-year median multiple of 16.8x.
ANZ's payout ratio of approximately 84% means the bank is distributing the vast majority of its cash earnings, leaving limited room to grow dividends unless earnings expand, with the FY26 forecast of $1.68 per share implying only modest growth from the current $1.66.