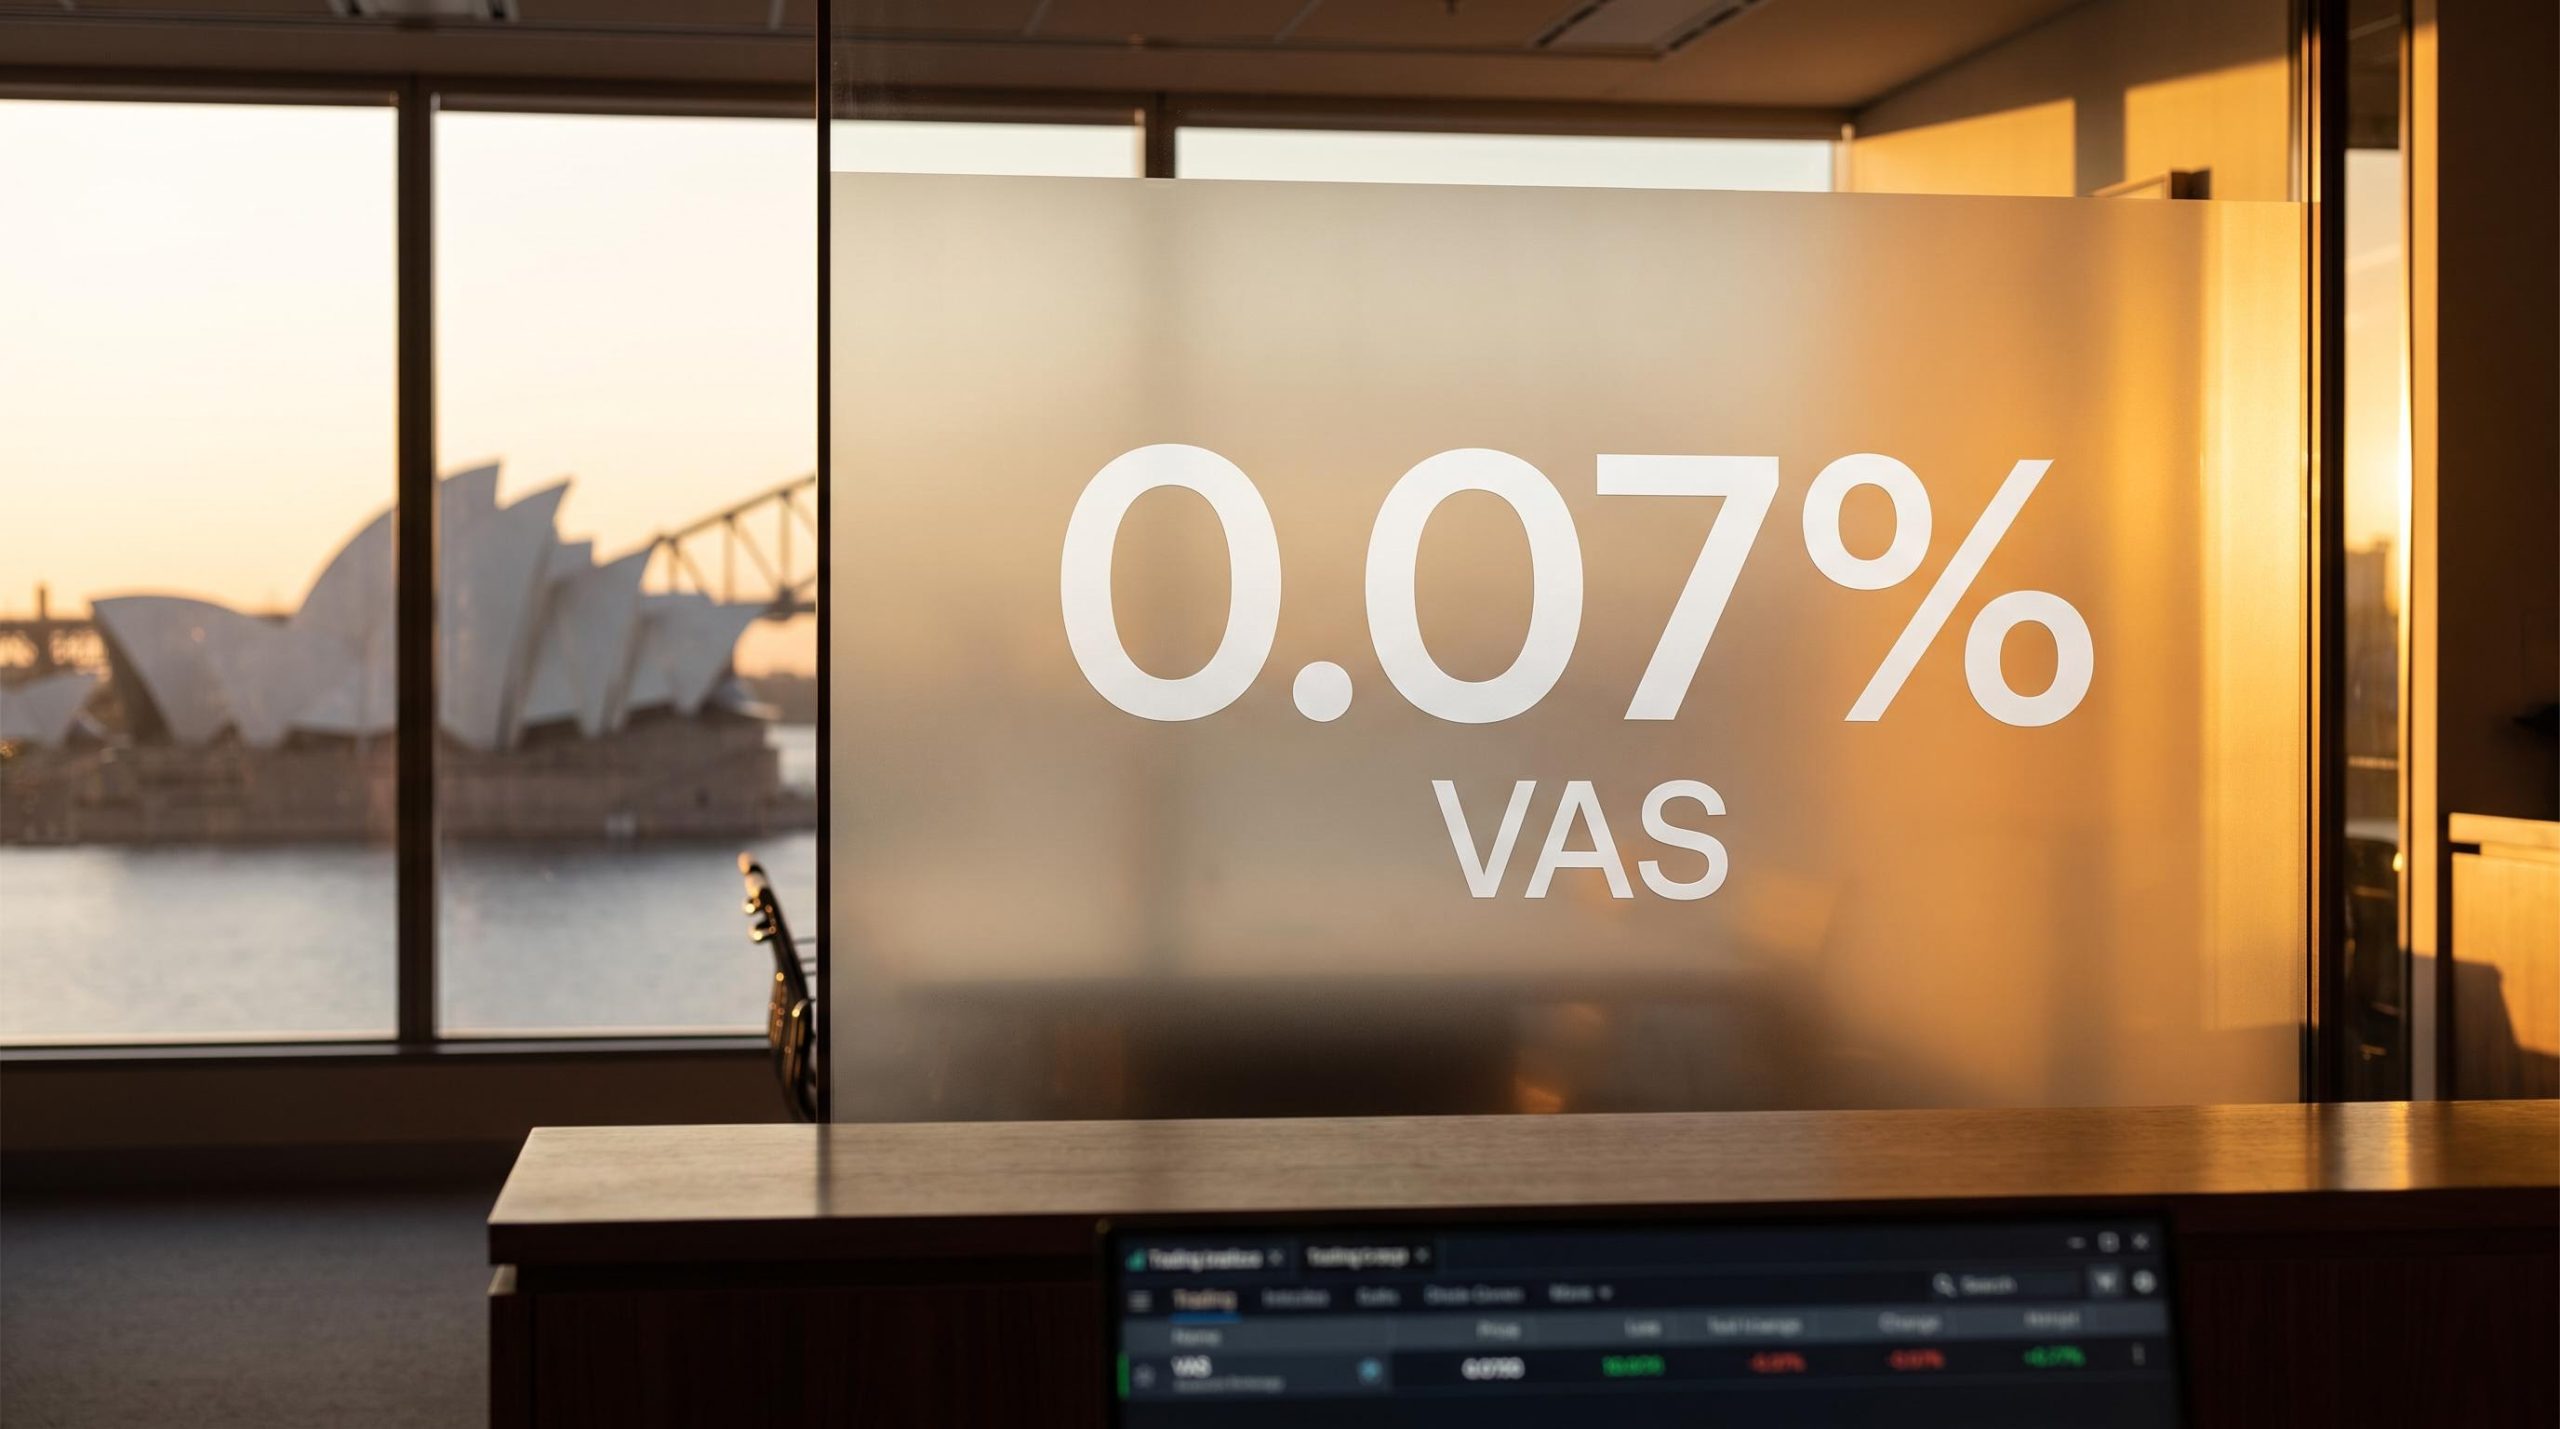
VAS charges its investors 0.07% per year. That is less than what most Australians spend on a single takeaway coffee. For that fee, a single trade buys you a proportional stake in roughly 320 listed Australian companies simultaneously.
The assumption that meaningful investing requires complexity, high fees, and constant decision-making is one of the most persistent myths in personal finance. The Vanguard Australian Shares Index ETF (ASX: VAS) is a direct challenge to that assumption. It tracks the S&P/ASX 300 Index, holds approximately $26 billion in assets under management, and has been doing so since May 2009.
Something that more than $26 billion of investor capital has chosen deserves a clear explanation, not a product pitch. Here is how VAS actually works, what it holds, where the income comes from, and how to think about whether it belongs in your portfolio, whether you are investing for the first time or reassessing a strategy you have been running for years.
What the S&P/ASX 300 Index actually is, and why it matters
You have probably heard the phrase “the index” used in market commentary without anyone stopping to explain what it means. For VAS, the index in question is the S&P/ASX 300 (ASX: XKO). It measures the performance of the 300 largest companies listed on the ASX, ranked by market capitalisation. That is the total market value of a company’s tradeable shares.
The index is market-capitalisation-weighted and float-adjusted. In plain terms, each company’s influence on the index is proportional to its investable market value rather than its total number of shares. The practical result is that a handful of very large companies carry outsized weight. If Commonwealth Bank of Australia moves 1%, it shifts the index far more than a small-cap mining company moving by the same amount.
The S&P/ASX 300 index methodology published by S&P Dow Jones Indices sets out the float-adjusted market capitalisation weighting rules, eligibility criteria, and rebalancing schedule that determine which companies enter or exit the benchmark VAS tracks.
VAS currently holds approximately 321 securities, slightly more than the 300 the index name suggests, because the benchmark includes some additional eligible securities. The fund uses physical replication, meaning it holds the actual underlying shares directly rather than relying on derivatives or synthetic instruments. Physical replication means you can verify exactly what the fund owns. There is no counterparty sitting between your money and the companies it is invested in.
The five names near the top of the holdings list tell you a lot about the fund’s character:
- BHP Group: Australia’s largest miner, with global exposure to iron ore, copper, and energy commodities
- Commonwealth Bank of Australia: the country’s largest bank by market capitalisation
- CSL: a global biotechnology company and Australia’s largest healthcare name
- NAB: one of the four major Australian banks
- Westpac: another of the big four, completing the banking dominance at the top of the fund
VAS was listed on 4 May 2009, giving it more than 15 years of live performance data. For a passive fund, a track record that long, spanning multiple market cycles, is a meaningful differentiator when evaluating reliability.
What this means for you is straightforward: your VAS investment is most heavily influenced by a small number of very large Australian companies. Understanding that concentration at the top is the first step toward evaluating whether VAS deserves a role in your portfolio.
When big ASX news breaks, our subscribers know first
Where VAS’s returns come from, including the income side most beginners miss
The first return component is the one you probably expect. As the companies in the index grow in value over time, the index level rises, and the unit price of VAS rises with it. This is long-term capital growth, and it is the component most investors focus on when they look at ETF performance charts.
The second component is the one that often surprises new investors and that experienced investors may be underutilising.
How franking credits work in the VAS context
Dividends are a core mechanism through which Australian listed companies return value to shareholders, and VAS is positioned to capture that income stream across its 320-plus holdings, channelling it to you as regular distributions. That dual role, delivering income alongside capital growth, is what sets VAS apart from a purely growth-oriented investment.
But the Australian-specific feature that changes the maths is the franking credit. A franking credit is a tax credit attached to dividends paid by Australian companies that have already paid corporate tax on their profits. Because the company has already been taxed on the income before distributing it as a dividend, the franking credit prevents you from being taxed twice on the same earnings. The benefit flows through to eligible investors, particularly those in lower tax brackets who may receive refunds, and those in accumulation-phase superannuation structures.
Individual outcomes depend on your personal tax circumstances, and this is not tax advice. But the structural point matters: a trailing gross dividend yield of approximately 3.3% sounds modest on the surface. For Australian tax residents who are eligible to use the attached franking credits, the effective after-tax return on the income component is materially higher than that headline figure suggests. That distinction changes how VAS competes against other income-generating assets in your portfolio.
| Return Component | How It Works for VAS Investors |
|---|---|
| Capital growth | As the underlying companies grow in value, the index level and VAS unit price rise over time. This is long-term wealth accumulation driven by the collective performance of approximately 320 Australian companies. |
| Dividend income with franking credits | VAS collects dividends from its holdings and distributes them to unitholders. Many of these dividends carry franking credits, which may reduce the tax payable on the income or generate refunds for eligible investors in lower tax brackets. |
Investors can also choose to reinvest their distributions automatically, buying additional VAS units without making a manual reinvestment decision each quarter. Over time, this compounding effect can materially increase the total value of your position.
VAS charges a management fee of 0.07% per annum, one of the lowest management costs available in Australian ETFs. On a $10,000 investment, that is $7 per year, leaving almost all of your return intact after costs.
The sector concentration risk that every VAS investor needs to understand
Three hundred and twenty companies sounds like thorough diversification. By company count, it is. Your outcome does not depend on any single business succeeding or failing.
But company count is not the same as sector balance, and this is where VAS demands clear-eyed understanding.
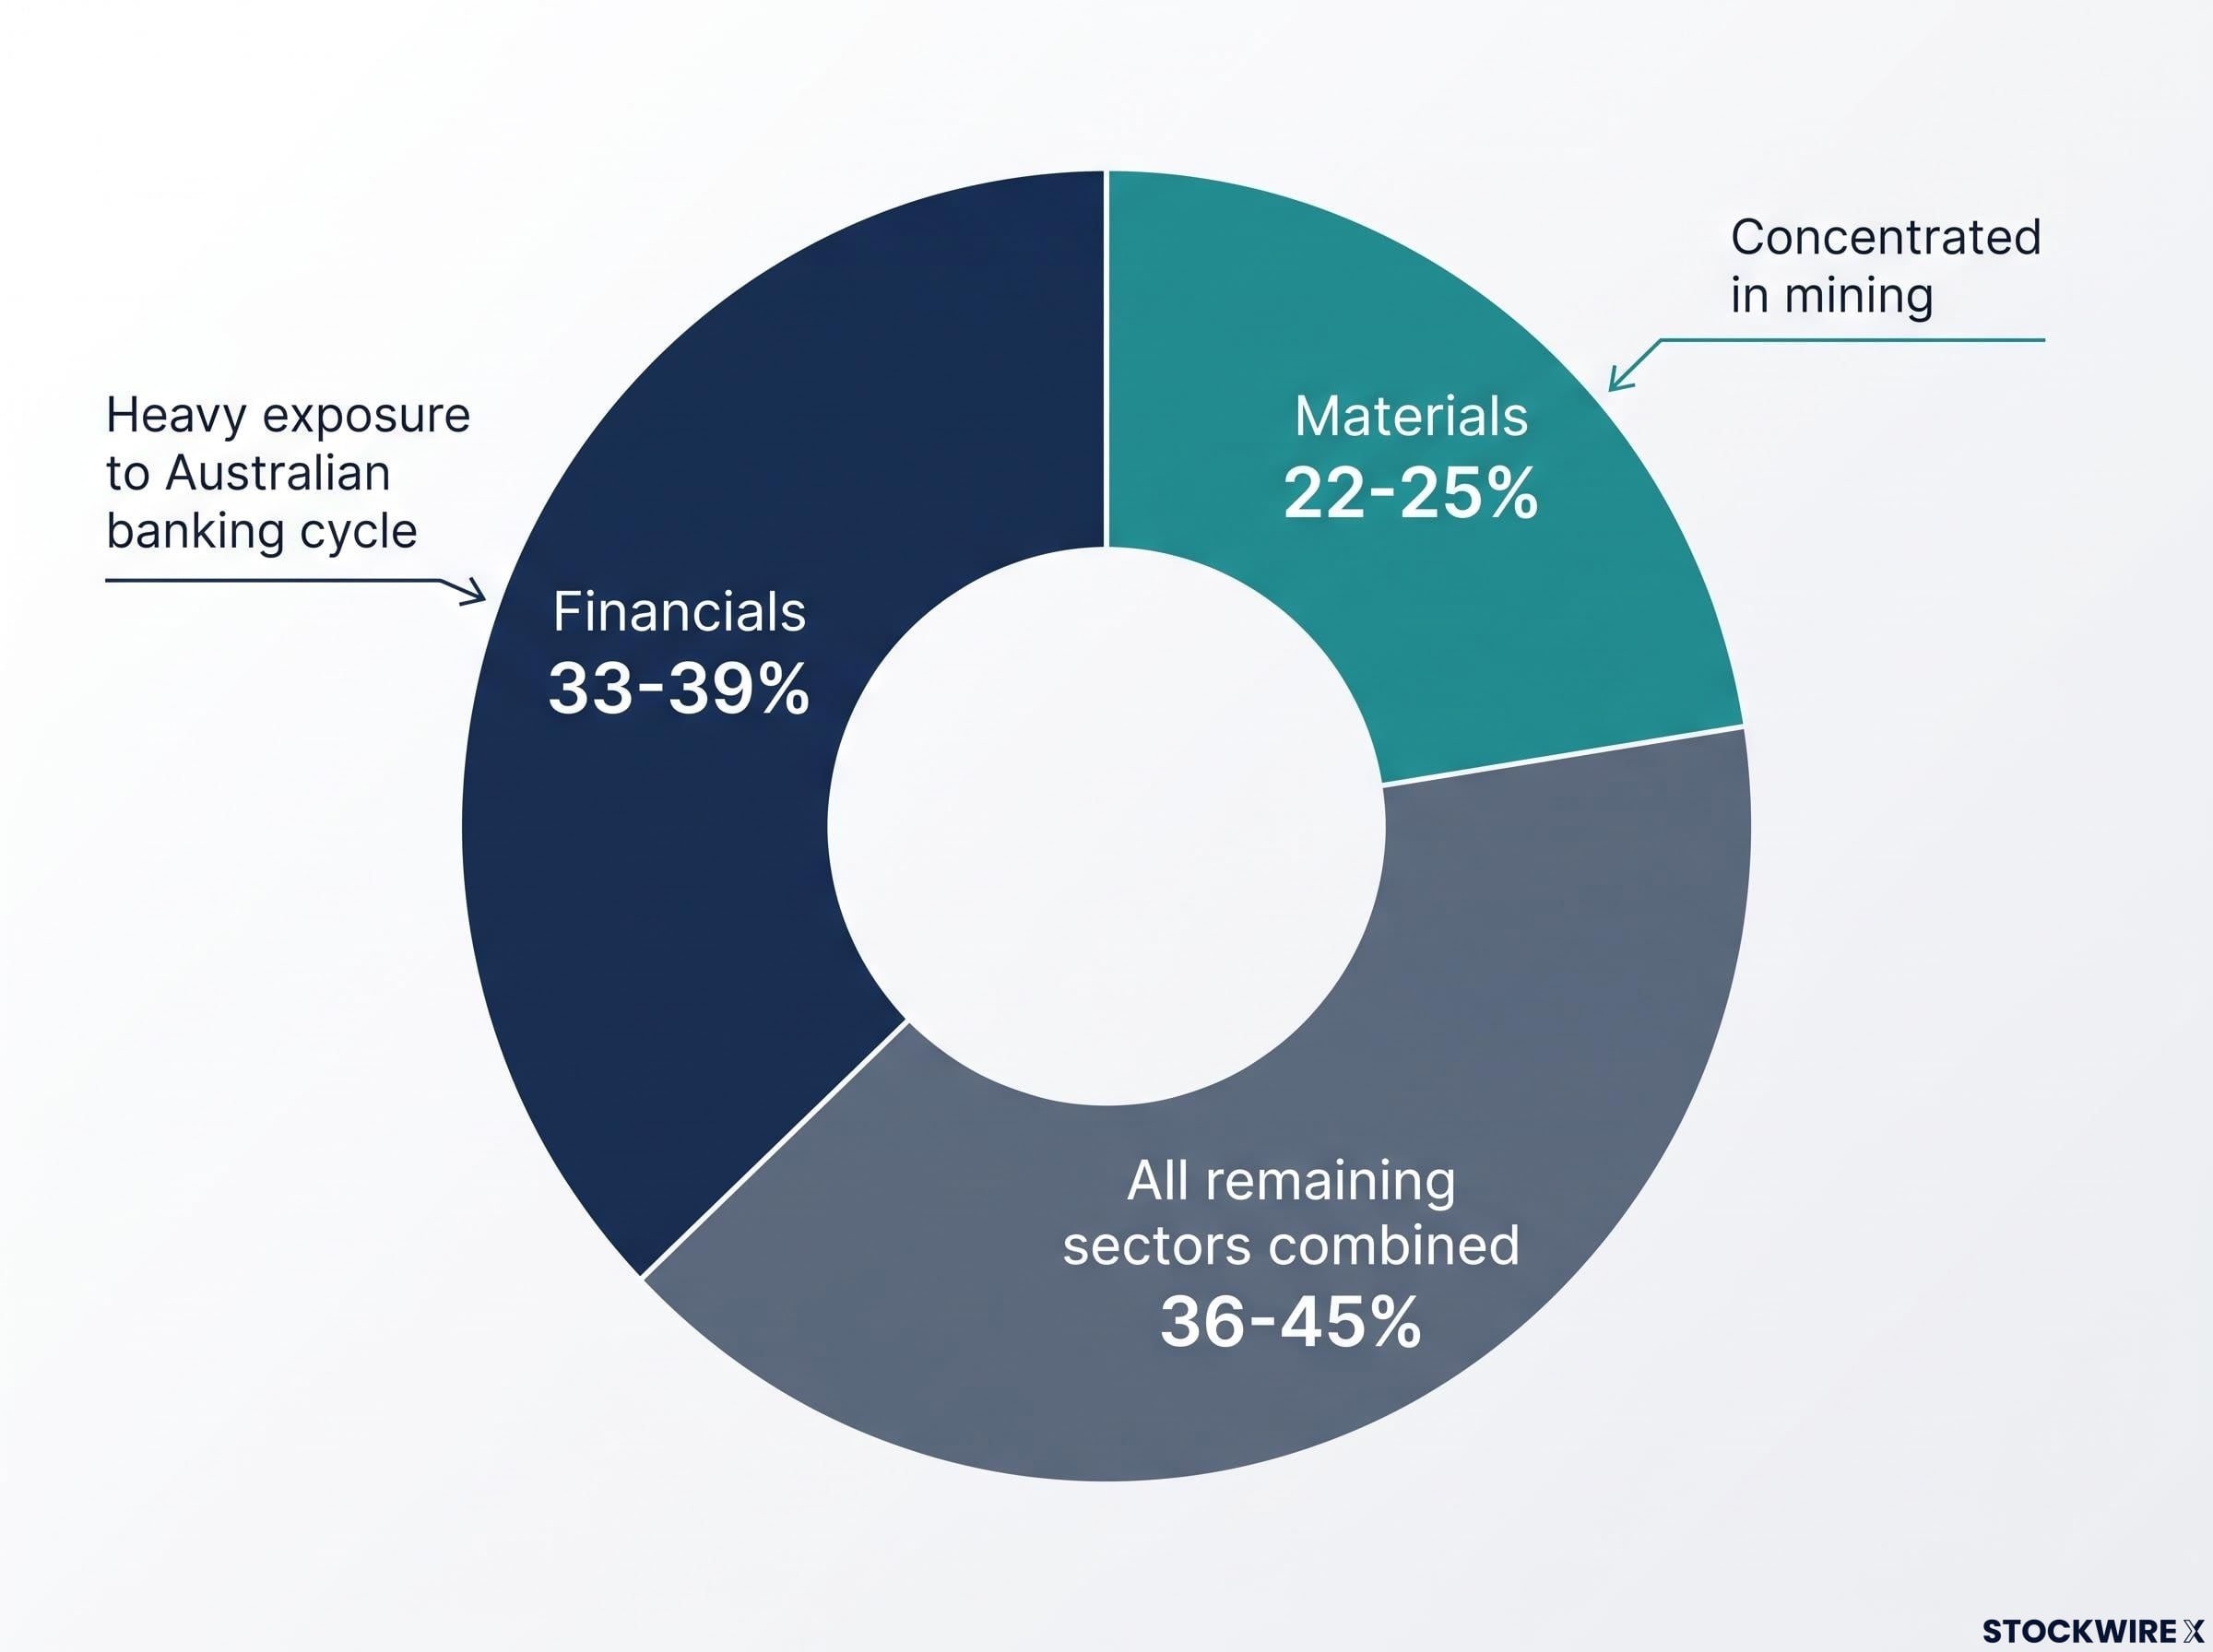
The Australian sharemarket is structurally tilted toward two sectors: banking and resources. VAS inherits that tilt in full. Financials represent approximately 33-39% of the fund. Materials, which is dominated by mining companies, represent approximately 22-25%. Combined, these two sectors account for the majority of your VAS exposure.
| Sector | Approximate Weight in VAS | Key Risk Consideration |
|---|---|---|
| Financials | 33-39% | Heavy exposure to Australian banking cycle, interest rate sensitivity, and domestic housing market conditions |
| Materials | 22-25% | Concentrated in mining; performance tied to global commodity prices, particularly iron ore and copper |
| All remaining sectors combined | Approximately 36-45% | Healthcare, consumer, industrials, technology, and property share the remaining exposure across a wide range of industries |
What VAS does not give you is equally important to understand:
- Meaningful exposure to global technology companies that have dominated international benchmark returns in recent years
- International consumer discretionary names with global revenue bases
- Non-Australian healthcare or pharmaceutical companies
- Currency diversification, since all holdings are ASX-listed and predominantly AUD-denominated
These weights shift over time as the index rebalances automatically with market movements. A rising bank sector will push the financials weight higher; a commodity downturn will compress the materials allocation. No active manager intervenes.
ASX concentration risk runs deeper than the sector weights alone suggest: VanEck research shows two stocks have historically represented approximately 22% of a typical cap-weighted Australian equity portfolio, meaning a single large-cap earnings miss can produce a measurable drag across the entire fund.
For you, building a portfolio, the concentration in financials and materials means your VAS position will behave differently from a global index fund during periods when Australian banks or miners underperform. Factoring this into your total portfolio construction, not just within VAS but across all your holdings, is where this knowledge becomes actionable.
Who VAS suits at different stages of an investing journey
The common assumption is that VAS is a “starter” investment, something you hold until you know enough to do something more sophisticated. That assumption has it backwards.
For beginner investors, VAS solves the single hardest problem you face: individual stock selection. Instead of choosing between 320 companies and hoping you pick the right ones, you buy all of them with one trade. You can start with a small amount, add to your position incrementally over time, and reinvest distributions to compound your holdings. That is a practical accumulation strategy that removes the paralysis many first-time investors experience.
VAS manages approximately $26 billion in assets, reflecting widespread adoption across both institutional and retail investor bases. That scale is not an endorsement, but it does tell you the structure has been stress-tested by a very large number of investors through multiple market cycles, including the 2020 COVID drawdown and its recovery.
VAS as a core-satellite anchor for experienced investors
If you have been investing for years, VAS still has a structural role to play. Core-satellite portfolio construction is a widely used approach where a passive, broad-market core handles the bulk of your market exposure, and targeted satellite positions are where you concentrate your active decisions and high-conviction ideas.
VAS as the core means the broad Australian market is covered passively. Your attention and decision-making energy can then focus on the satellite positions where your experience and conviction genuinely add value. This structure is not a concession to simplicity. It is a deliberate allocation decision used by professional and sophisticated retail investors precisely because it improves capital efficiency.
Core-satellite portfolio construction divides holdings into a broadly diversified, low-cost core covering 70-90% of the portfolio and a smaller set of deliberate, thesis-driven satellite positions, a framework that disciplines how investors evaluate whether any new position genuinely complements VAS or simply duplicates its existing sector exposure.
Complexity for its own sake is not a virtue in portfolio construction, and the data does not bear out the idea that sophistication should grow in lockstep with experience. Keeping a meaningful portion of your portfolio in a straightforward core holding can lower the volume of ongoing decisions you need to make, help you stay committed to your strategy when markets turn difficult, and ensure that any additional complexity you layer into satellite positions is earning its place rather than simply adding noise.
| Investor Type | How VAS Fits | Key Consideration |
|---|---|---|
| Beginner | Single-trade entry point providing diversified Australian market exposure; build incrementally, reinvest distributions | Reduces stock-selection burden but still carries full Australian sharemarket risk including downturns |
| Experienced (core-satellite) | Passive core covering broad Australian equities, freeing attention for high-conviction satellite positions | Satellite positions should complement, not duplicate, the sector exposure VAS already provides |
| Experienced (simplicity-first) | Maintained as a deliberate low-complexity allocation to reduce ongoing decisions and support strategy adherence | Simplicity is a feature, not a limitation; reduced decision volume improves long-term behavioural outcomes |
The argument for VAS actually strengthens with experience rather than weakening. That runs counter to what many investors expect, but it is one of the more useful insights in portfolio construction.
What VAS does well, where it has limits, and how to read the fund before investing
VAS earns its place in the conversation because it does several things well simultaneously. The management fee of 0.07% per annum is among the lowest in the Australian ETF market. Physical replication means you can verify the fund’s holdings directly. More than 15 years of live performance data, spanning multiple market cycles, gives you a basis for evaluating how the fund behaves in practice rather than relying on back-tested projections. Regular income distributions with franking credits add a tax-advantaged income layer. And the fund is accessible to investors at any stage, from a first trade through to a mature portfolio.
The structural limits deserve equal clarity. VAS provides no global diversification. It is concentrated in Australian financials and materials. It will decline in value during broad market downturns in Australian shares, and it will not defensively reposition during those periods because it is passively managed. If the Australian banking sector enters a sustained downturn, your VAS position will feel it.
VAS and A200 share identical top-ten holdings accounting for around 45-48% of total portfolio weight, and the primary decision between them reduces to a 0.03 percentage point fee gap and roughly 100 additional small-cap holdings that only matter if you hold a deliberate view on small-cap outperformance.
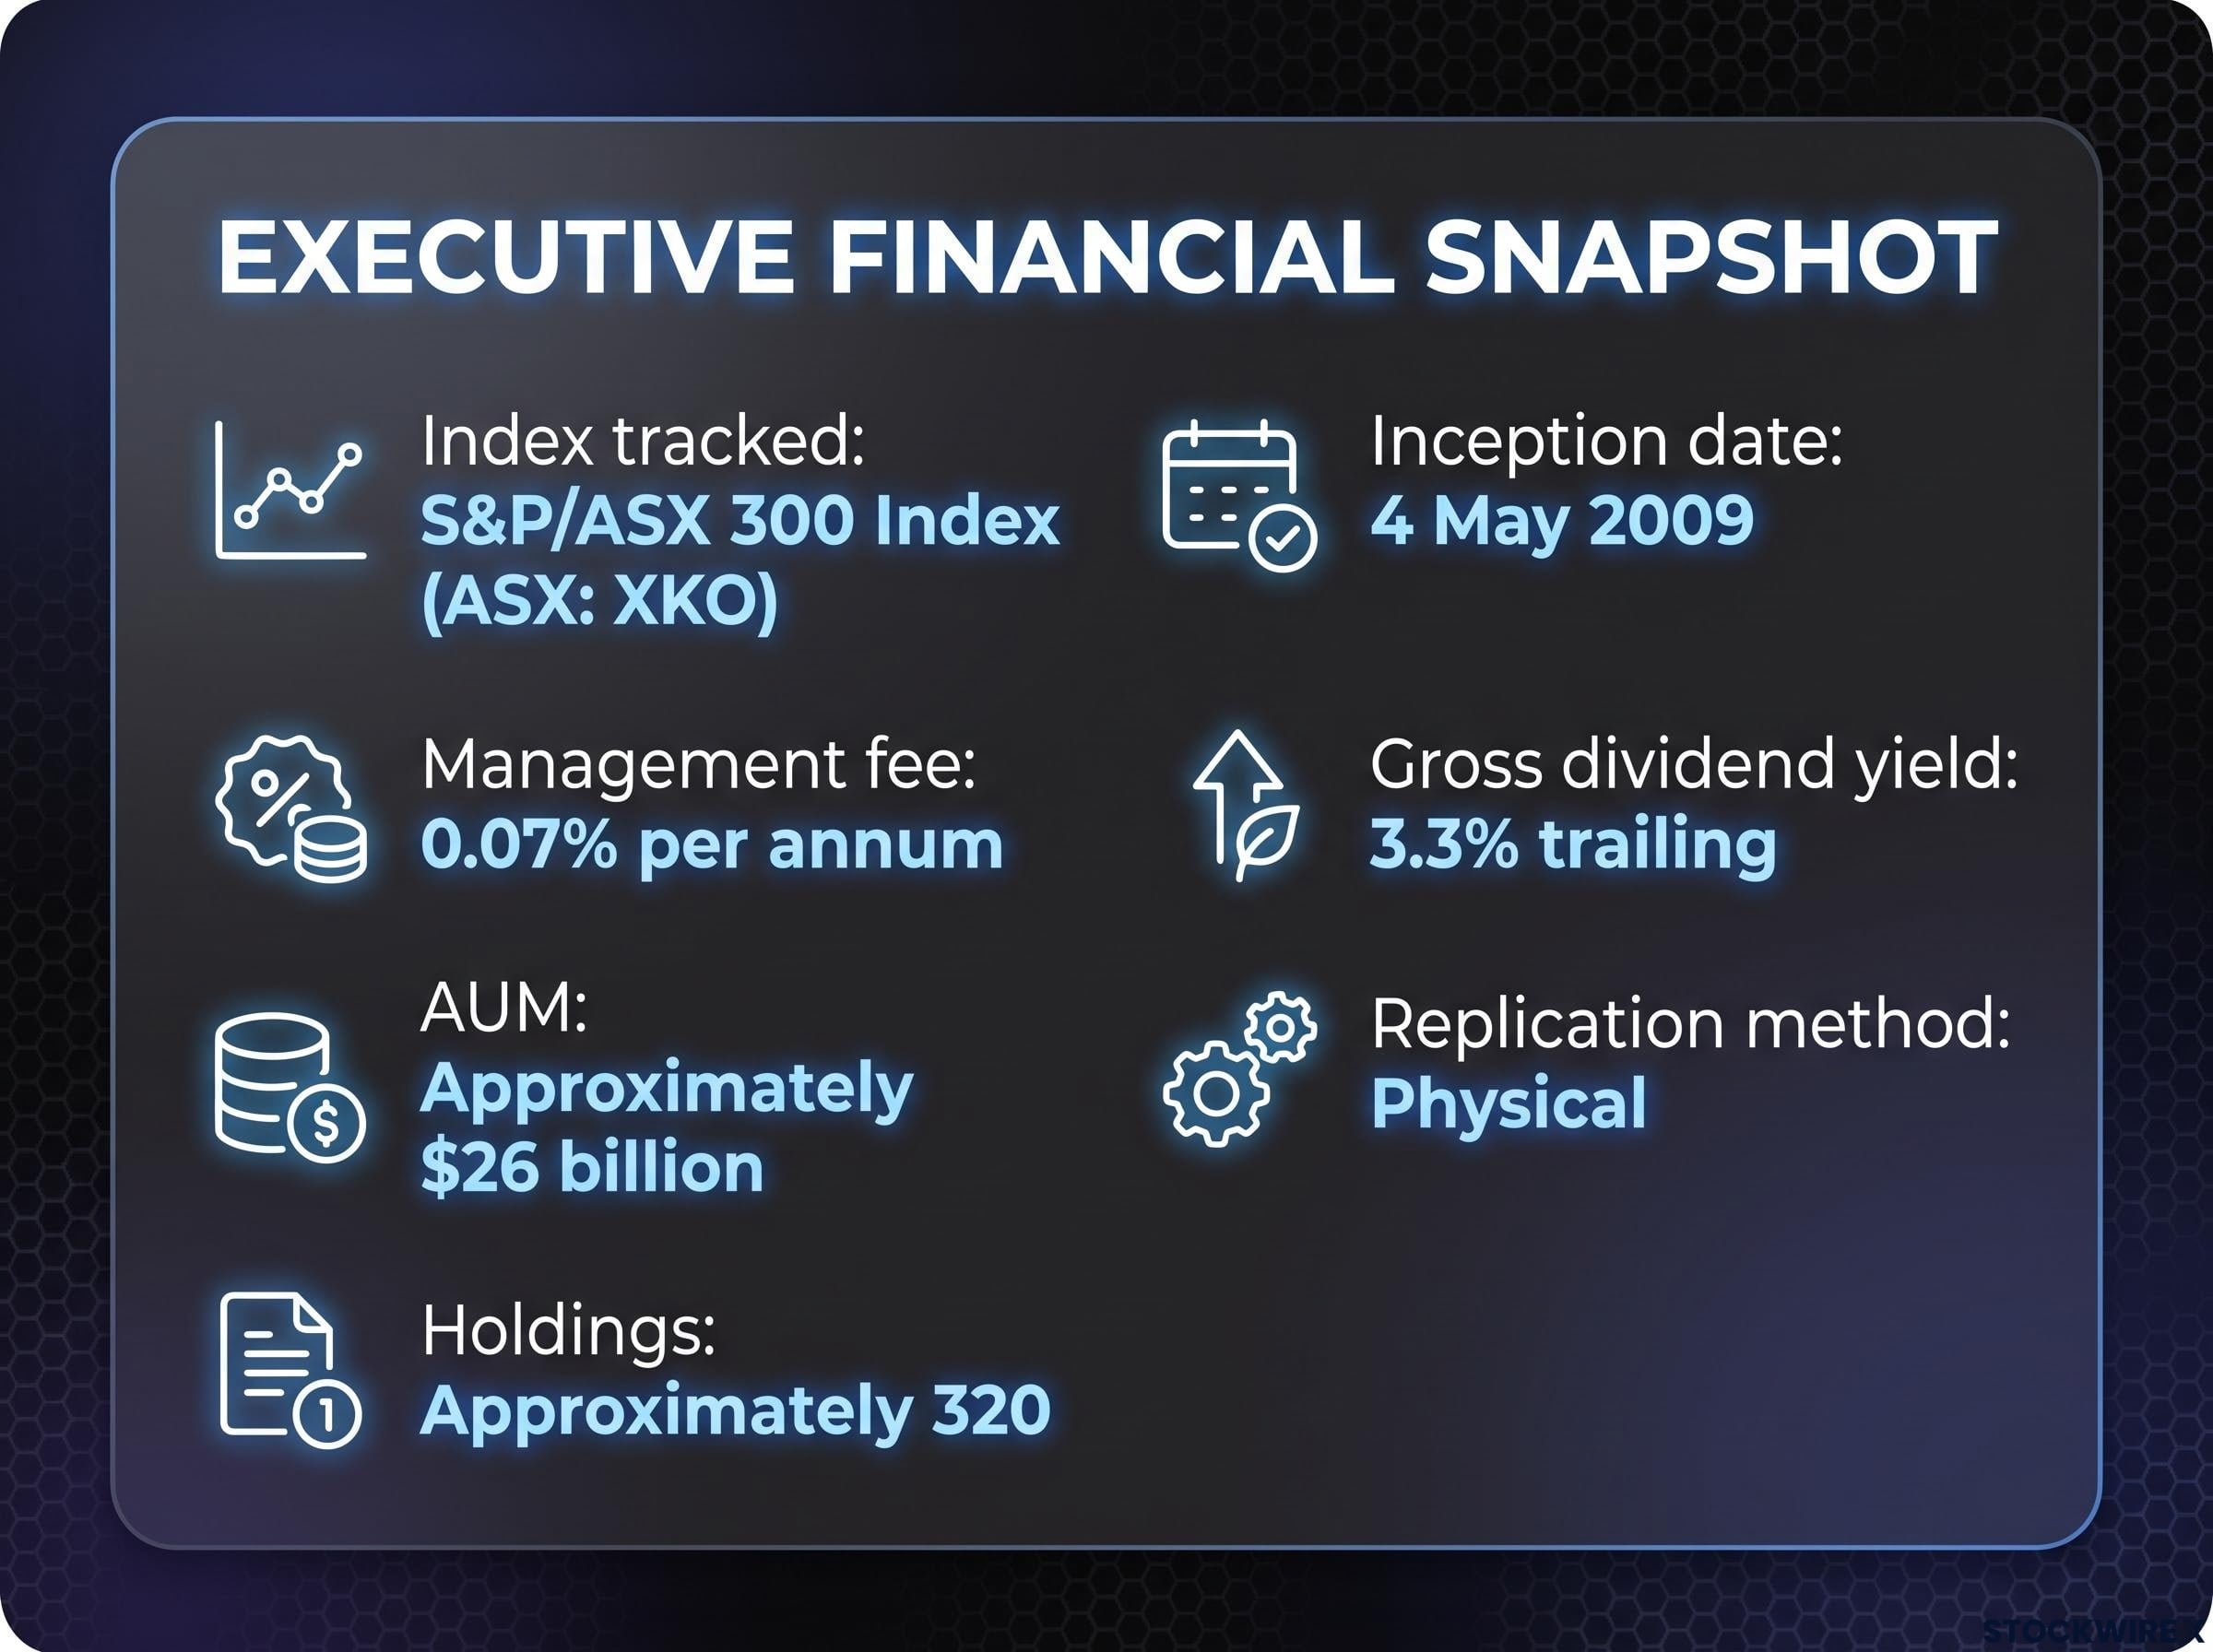
| Metric | Detail |
|---|---|
| Index tracked | S&P/ASX 300 Index (ASX: XKO) |
| Management fee | 0.07% per annum |
| AUM | Approximately $26 billion |
| Number of holdings | Approximately 320 |
| Inception date | 4 May 2009 |
| Gross dividend yield | Approximately 3.3% trailing |
| Financials sector weight | Approximately 33-39% |
| Materials sector weight | Approximately 22-25% |
| Replication method | Physical (holds underlying shares) |
| Management style | Passive |
The limits you should keep front of mind:
- No exposure to global markets, including the large technology companies that have driven international benchmark returns
- Sector concentration in financials and materials, which means your returns are more cyclically sensitive than a globally diversified alternative
- No defensive repositioning during downturns; VAS tracks the index in both directions
Figures in this article are drawn from the Vanguard fact sheet dated 31 July 2026 and are subject to market movements. You should verify current figures from the latest Vanguard fact sheet before making any decisions.
This article is for informational purposes only and should not be considered financial advice. Investors should conduct their own research and consult with financial professionals before making investment decisions. Past performance does not guarantee future results.
Making an informed call on VAS for your own portfolio
If you have worked through this explainer, you now understand VAS well enough to form a genuine, informed opinion about it. The fund’s simplicity is a feature, not a limitation. Its low cost, broad Australian market exposure, physical replication, long track record, and franking-credit-enhanced income make it a defensible core holding for a wide range of investor situations.
The remaining questions are yours to answer, and they are the right ones to sit with:
- What proportion of your portfolio should be Australian versus global? VAS covers the domestic side only, and the sector tilt means that balance matters.
- Is income or growth your primary objective? VAS delivers both, but the relative importance shapes how much weight it should carry.
- Is VAS serving as a standalone holding, or as the passive core alongside satellite positions where you hold specific conviction?
International diversification addresses the specific gap VAS cannot fill: VGS at 0.18% per annum and IVV at 0.04% per annum are the two dominant ETF options Australian investors use to access the technology, healthcare, and consumer sectors the ASX structurally under-represents.
Your next practical step is straightforward. Verify the current figures from the Vanguard fact sheet before acting, because AUM, yield, and sector weights shift with market movements. If your personal financial circumstances are complex, independent financial advice is appropriate before making allocation decisions.
VAS is not the answer to every portfolio question. But if you understand what it holds, how it generates returns, and where its limits sit, you are in a position to decide clearly whether it belongs in yours.
—