How to Build a Core-Satellite ETF Portfolio for Dividend Income
4 hrs ago
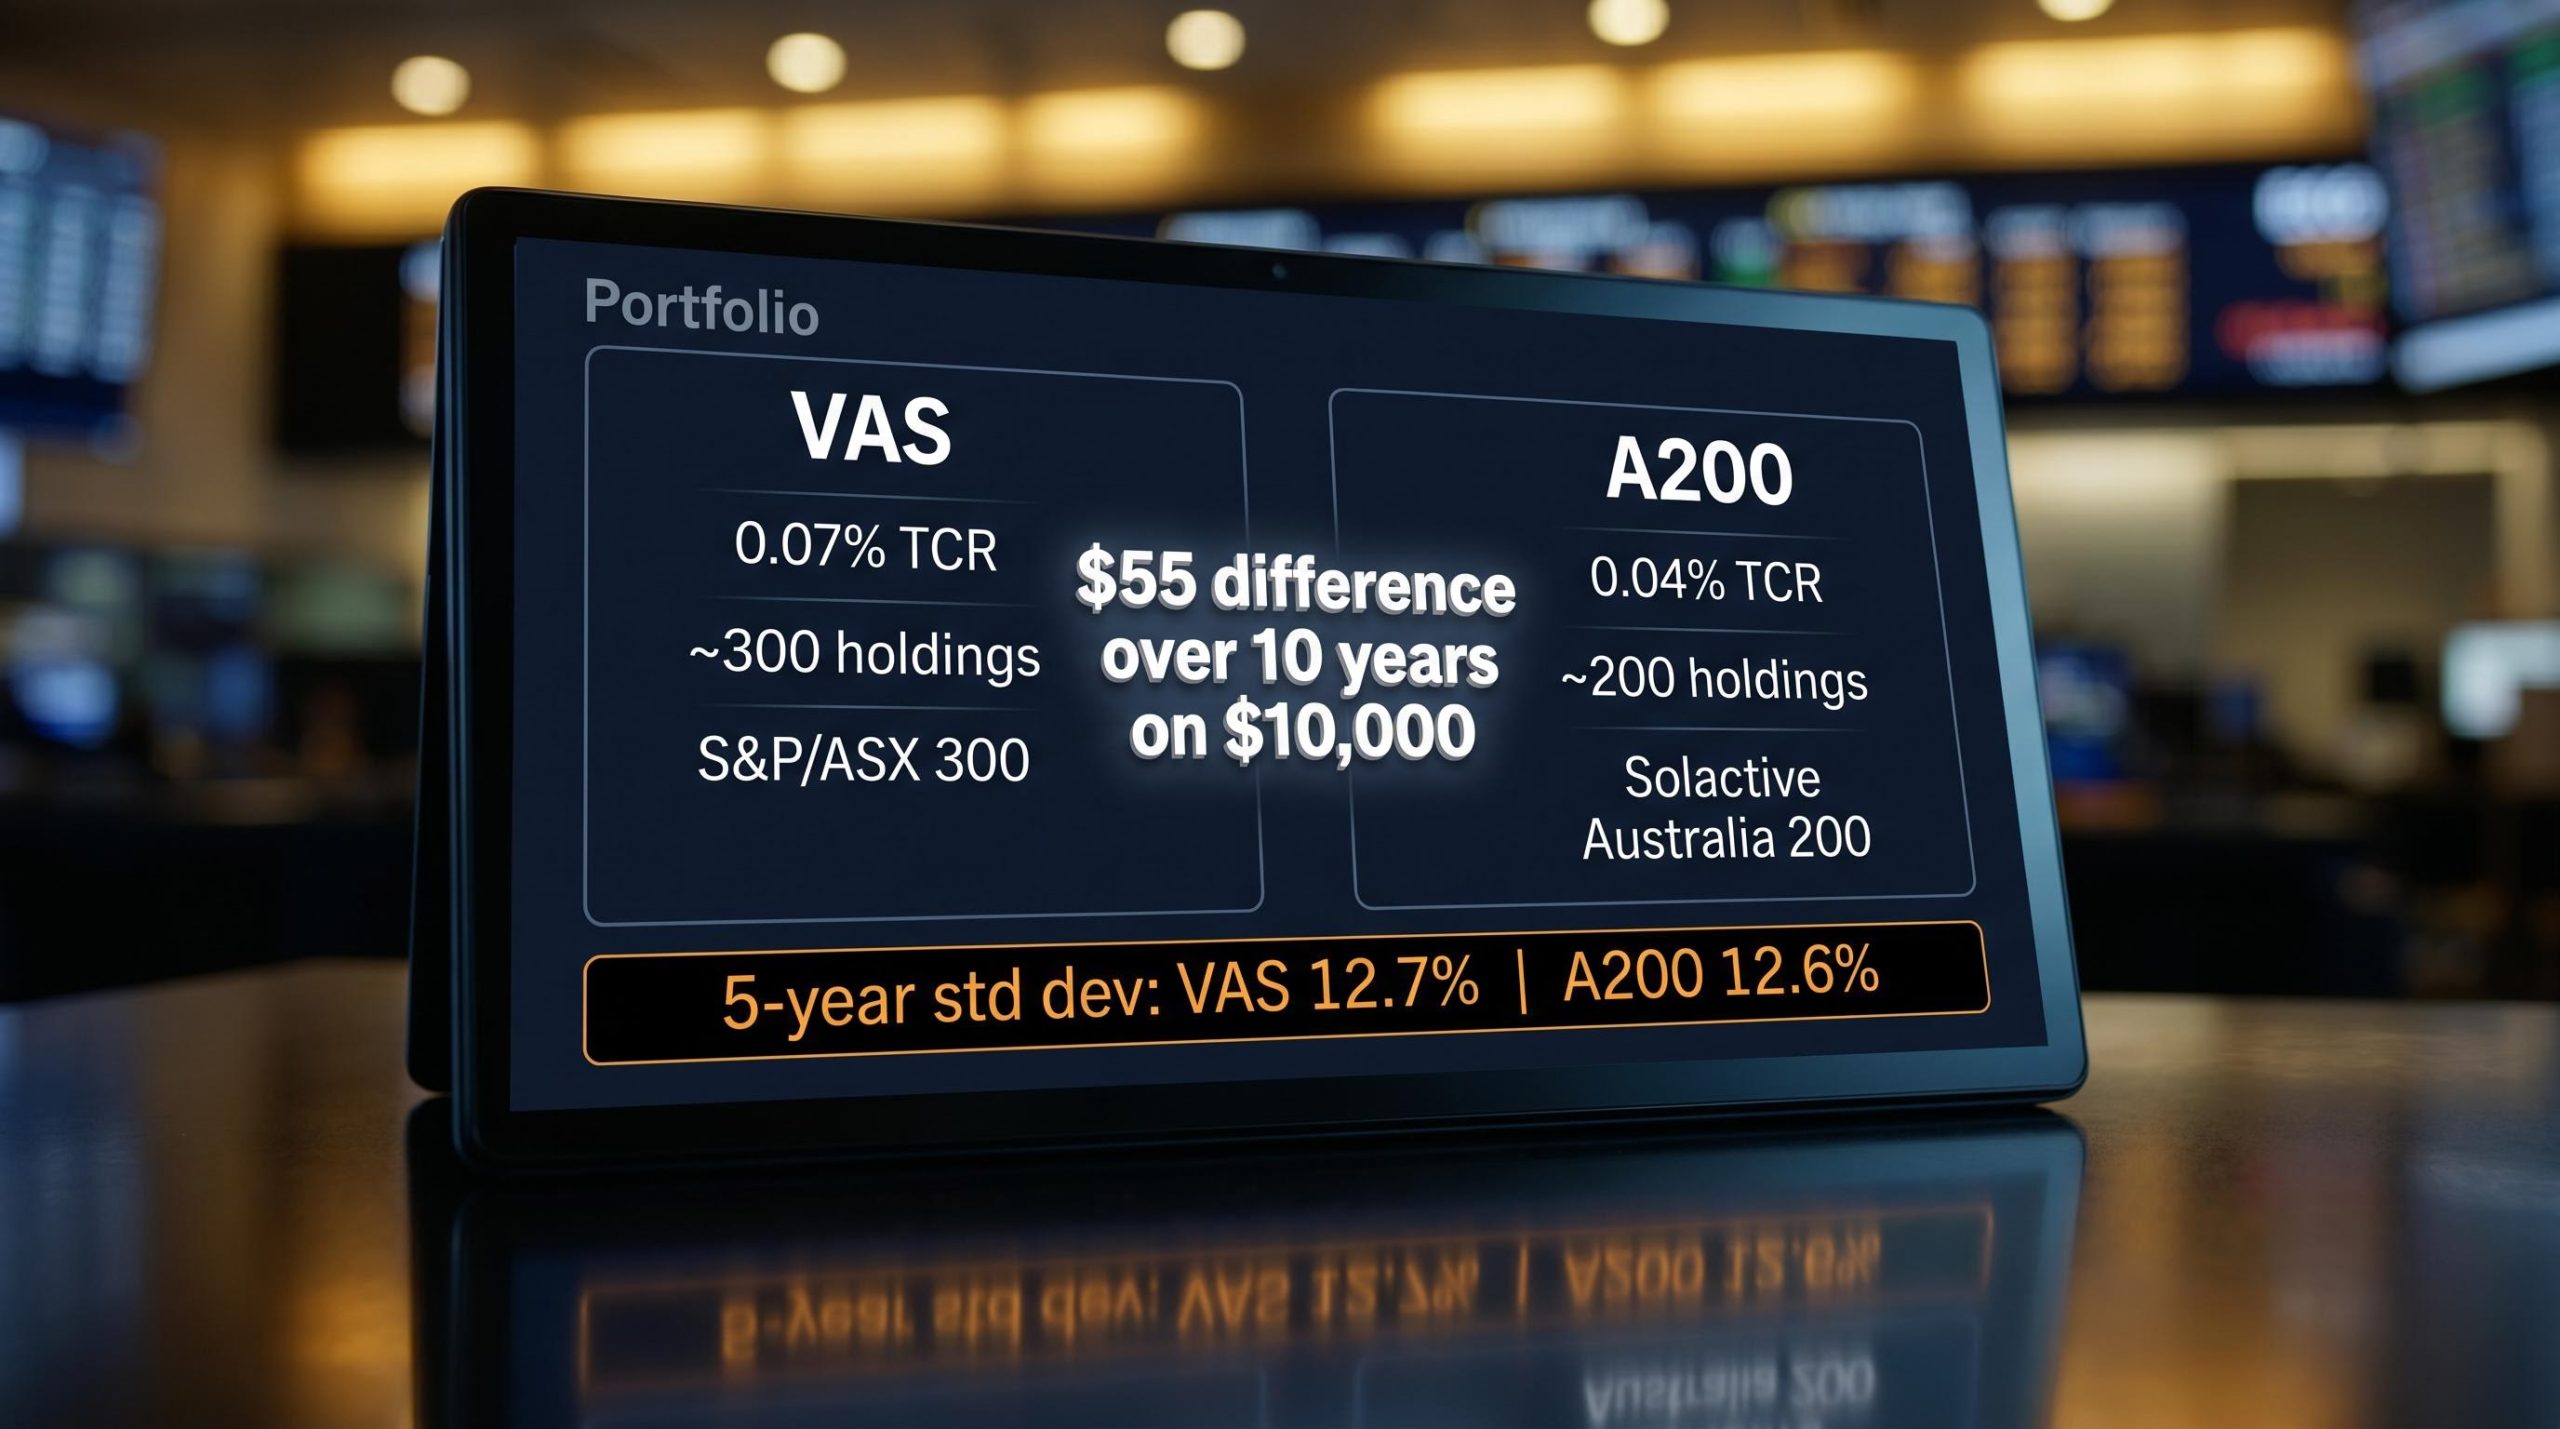
For most Australian investors weighing VAS against A200, the answer is closer than they expect. Two nearly identical portfolios, a fee gap of 0.03 percentage points, and a ten-year cost difference of roughly $55 on a $10,000 investment. The smallness of that number reframes the entire decision.
This is not a niche comparison. According to Vanguard data, Australian investors poured over $11 billion into ASX-listed ETFs across the first quarter of 2025, with VAS and A200 each ranking among the top domestic equity ETFs by net inflows over that period. If you are an Australian investor building a core equity position for the first time, you are almost certainly weighing these two funds against each other right now.
Here is what you need to walk away with: exactly which of the two small differences between these funds, cost versus breadth, applies to your strategy, and a concrete framework for making the call and committing to it. This piece ends at a decision point, not a list of considerations.
VAS tracks the S&P/ASX 300 Index. A200 tracks the Solactive Australia 200 Index. Both use market-capitalisation-weighted construction, meaning the biggest companies carry the most weight in each portfolio, and both cover the same banks, miners, and blue-chip names that dominate the Australian market.
According to Vanguard data, Australian investors poured over $11 billion into ASX-listed ETFs across the first quarter of 2025, with VAS and A200 each ranking among the top domestic equity ETFs by net inflows over that period.
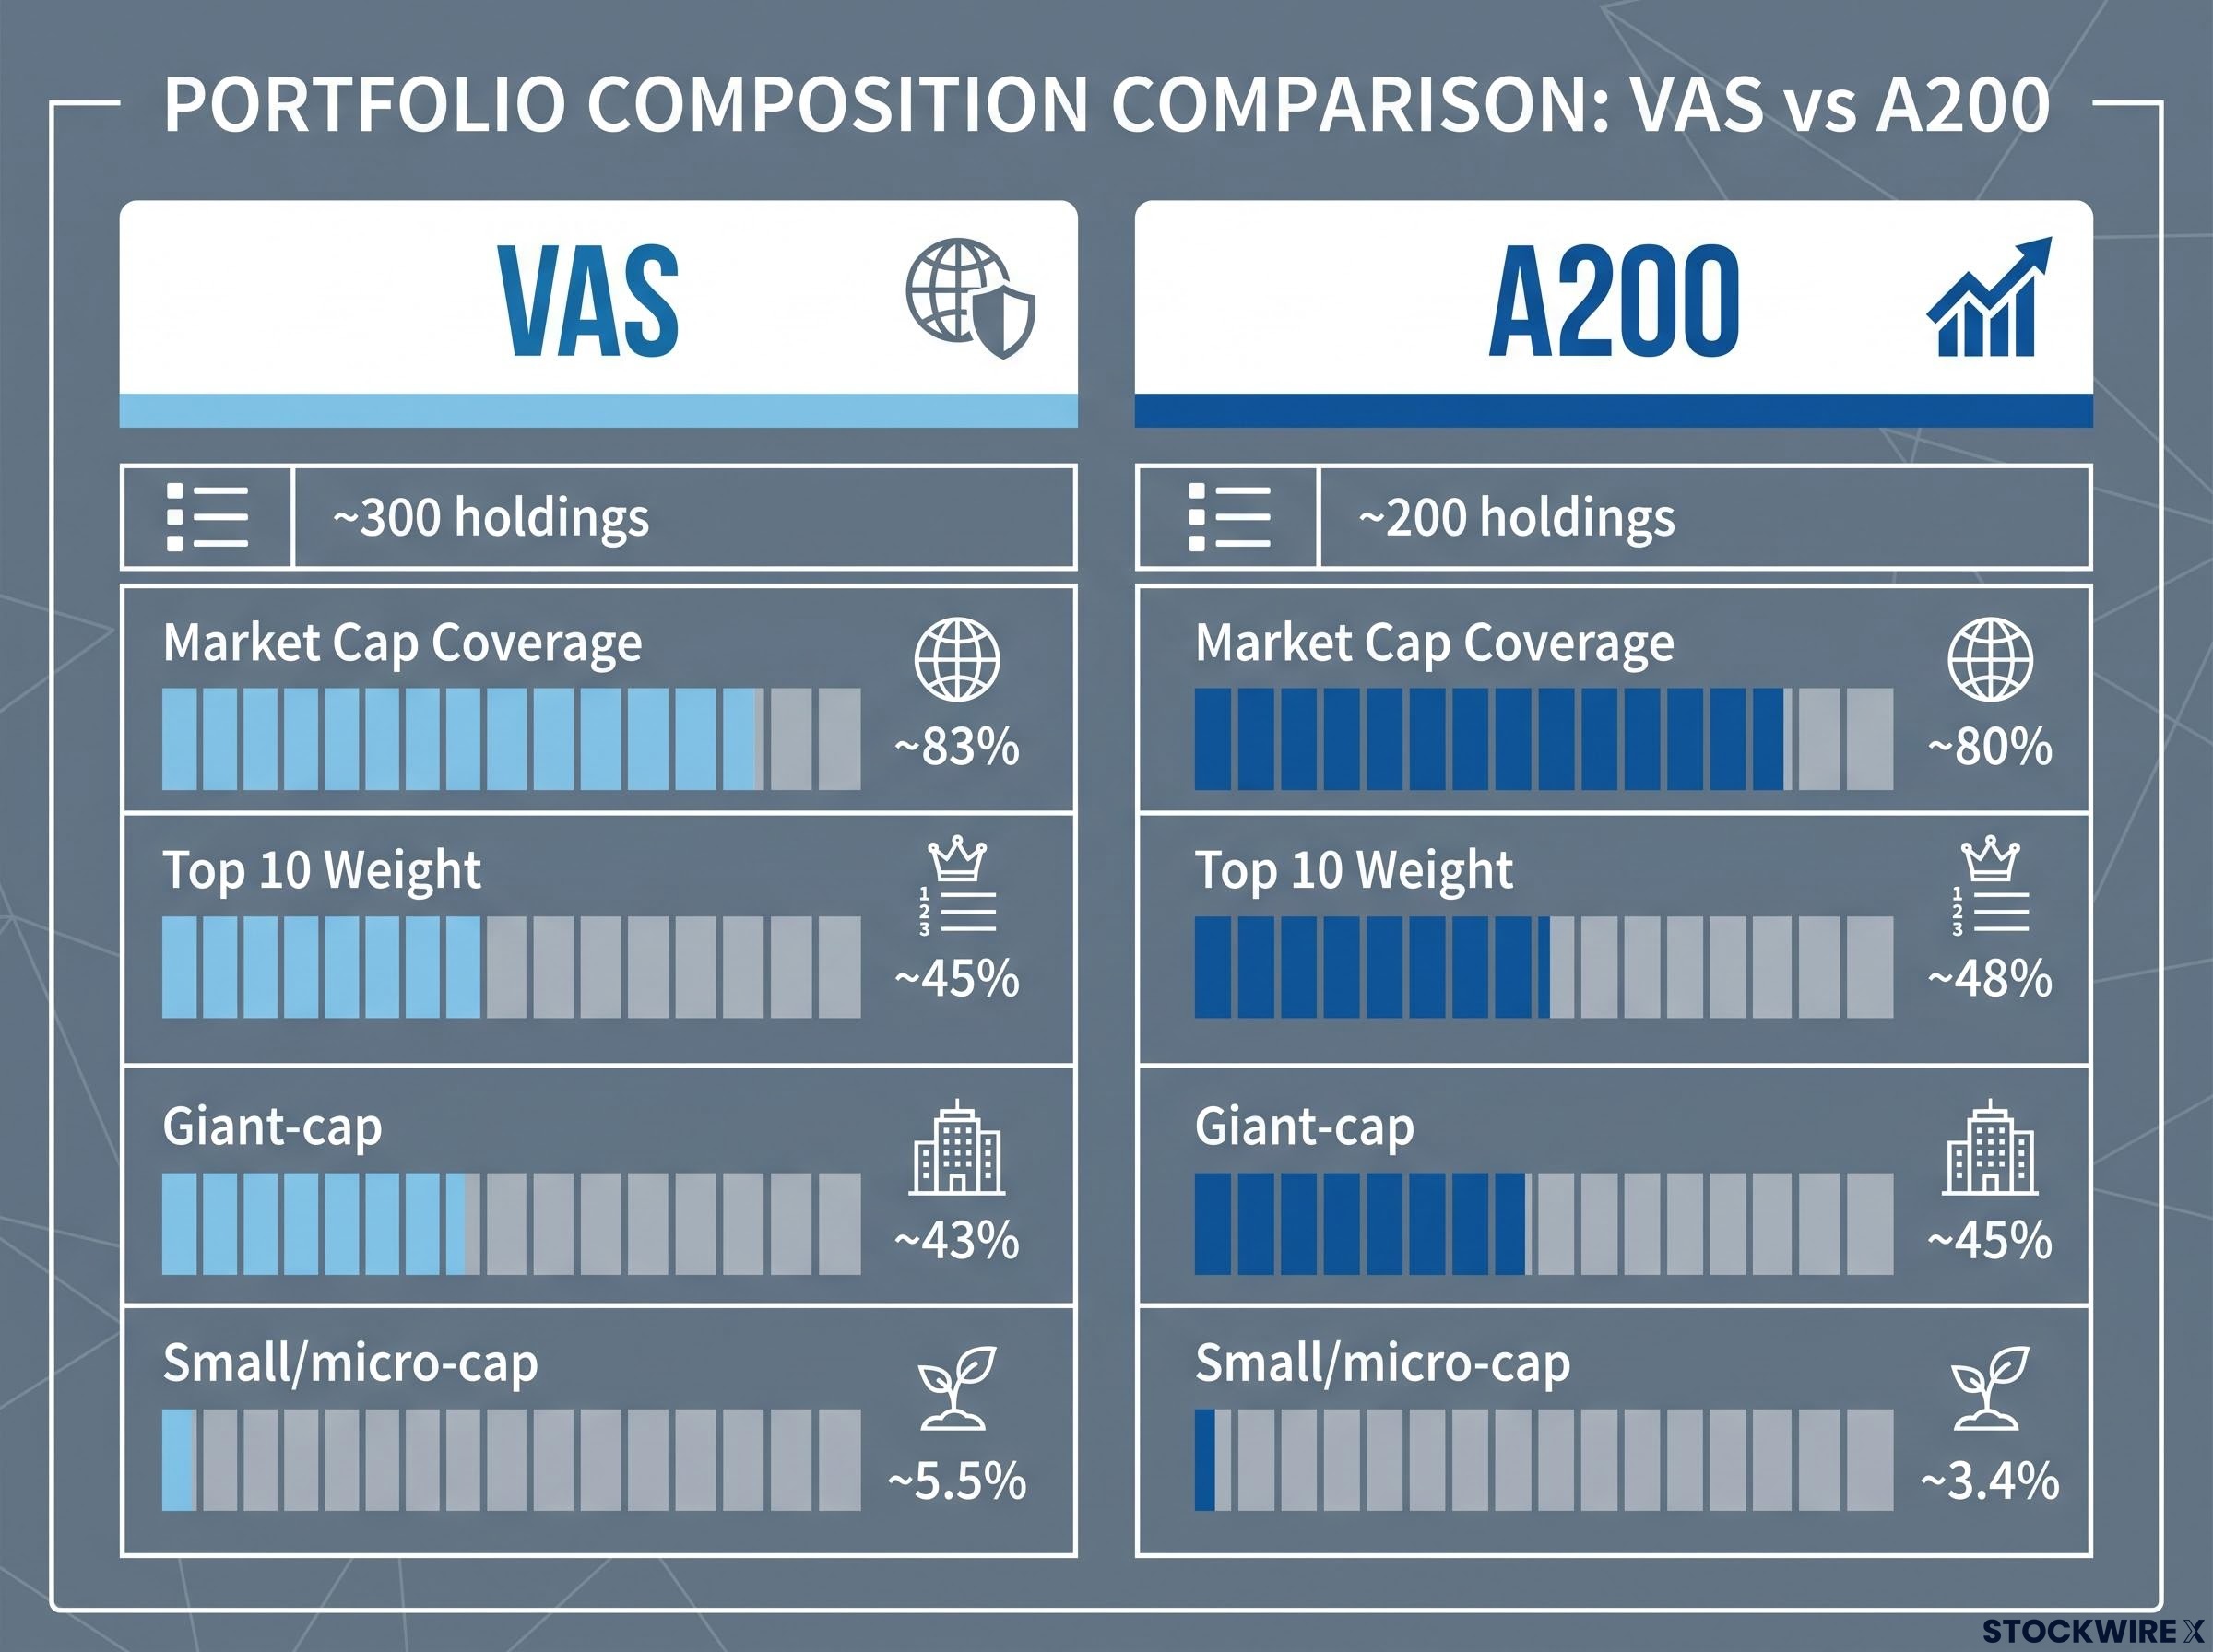
The overlap between these two funds is striking. Both share the same ten largest holdings, with those names accounting for around 48% of A200’s total weight and around 45% of VAS’s, based on data as of 31 August 2025. Both funds hold a Bronze Medalist Rating from Morningstar, which signals that Morningstar analysts expect each fund to generate positive alpha against category peers over the long run, once fees and risk adjustments are applied.
The structural difference comes down to one thing: VAS holds approximately 300 companies, while A200 holds approximately 200. That extra ~100 names sit at the smaller end of the market. Everything else, the core of what you own, is the same.
| Feature | VAS | A200 |
|---|---|---|
| Index tracked | S&P/ASX 300 | Solactive Australia 200 |
| Number of holdings | ~300 | ~200 |
| Market cap coverage | ~83% | ~80% |
| Top 10 weight | ~45% | ~48% |
| Morningstar Medalist Rating | Bronze | Bronze |
The Solactive Australia 200 is a lesser-known benchmark than the S&P/ASX 300, but its composition and behaviour closely resemble the more familiar ASX 200. If you have not heard of Solactive, that is normal, and it should not concern you. Both indices use free-float-adjusted, market-capitalisation-weighted construction, so the methodology is equivalent. The practical effect on your returns is negligible.
Your portfolio will feel and behave almost identically regardless of which fund you choose. The real decision is being made at the margin, not at the core, and it comes down to two specific points of divergence: fees and the breadth of those extra ~100 holdings.
A200 charges a Total Cost Ratio (TCR) of 0.04% per annum, the lowest of any broad Australian equity ETF on the ASX. The TCR captures the full annual expense of holding a fund, combining management and administration charges along with any other recurring costs attributable to the investor. VAS charges 0.07% per annum. The gap is 0.03 percentage points.
Here is what that looks like in dollars. Modelling a $10,000 starting investment at a gross annual return of 7% over a decade, A200 would accumulate around $55 more than VAS, a gap explained entirely by the difference in annual fees. It scales linearly: on $100,000, the difference is roughly $550 over the same period.
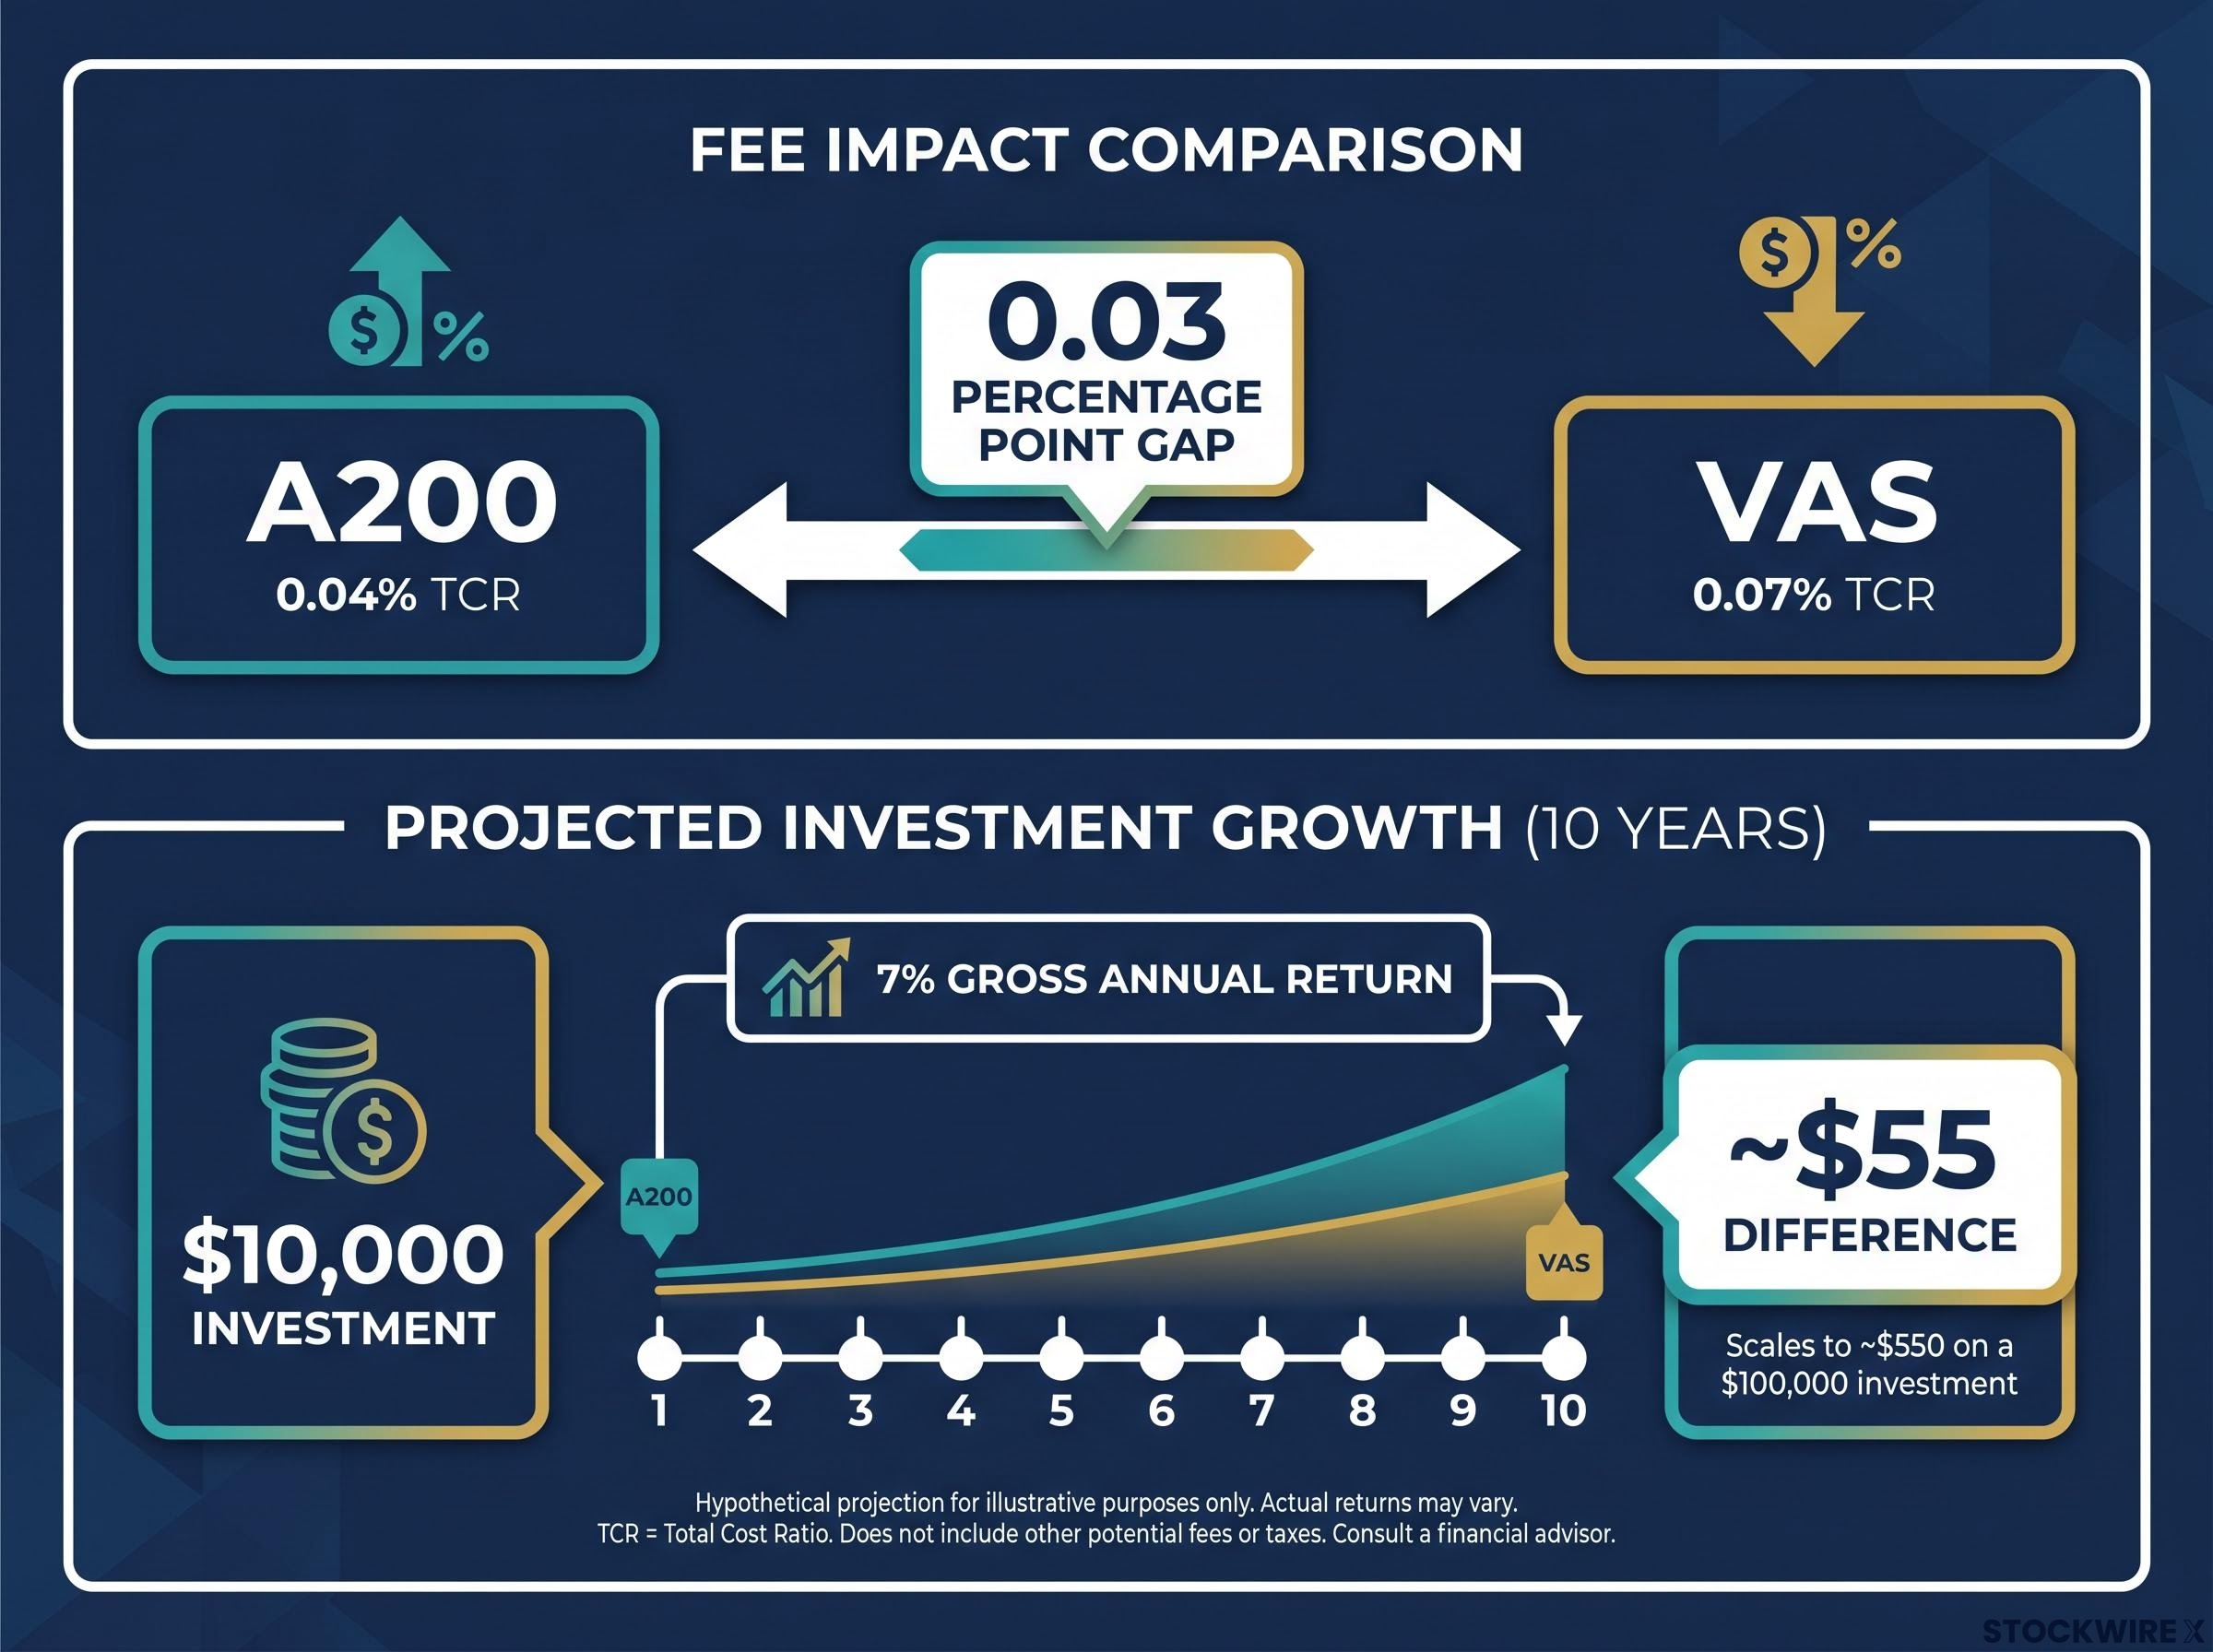
Assuming a 7% gross annual return on a $10,000 investment held for 10 years, the fee gap between A200 and VAS translates to a difference of roughly $55 in final portfolio value. The gap grows in proportion to the amount invested.
Three things to hold onto here:
For most investors, $55 over ten years on a $10,000 holding is not large enough to override a genuine preference for VAS on other grounds. But if you have no strong preference either way, A200’s fee advantage is the most durable and reliable edge available. Fees are the one guaranteed difference between these two funds; everything else, returns, volatility, valuation, can shift.
The idea that 300 holdings is meaningfully more diversified than 200 holdings is intuitive, but the weighting mechanics tell a more specific story. The additional ~100 companies in VAS are small and micro-cap Australian equities, companies sitting below the top 200 by market capitalisation. Their individual positions in the fund are extremely small, with each contributing only a tiny fraction of the overall portfolio weight.
Within that small-cap segment, VAS directs around 5.5% of assets toward small and micro-cap stocks, while A200 puts roughly 3.4% there, a spread of 2.1 percentage points. Looking at the other end of the size spectrum, A200 carries around 45% in giant-cap equities compared to roughly 43% for VAS, meaning A200 sits slightly heavier at the top of the market.
| Feature | VAS | A200 |
|---|---|---|
| Giant-cap allocation | ~43% | ~45% |
| Small/micro-cap allocation | ~5.5% | ~3.4% |
| Top 10 weight | ~45% | ~48% |
| Total market cap coverage | ~83% | ~80% |
The practical diversification conclusions are straightforward:
Both VAS and A200 inherit the structural ASX concentration in banks and miners that makes the domestic index so different from a globally diversified equity portfolio; financials and materials alone account for approximately 52% of the S&P/ASX 200, which both funds substantially replicate.
VAS gives you a marginally broader slice of the Australian economy. But that breadth sits at the very edge of the portfolio, not at its centre. The 3% gap in total market capitalisation coverage (83% versus 80%) is unlikely to drive a material difference in outcomes unless the smaller companies in VAS move significantly relative to the rest of the market over your holding period, and whether that happens is a judgment call that most investors cannot reliably make in advance.
Comparing trailing price returns over the five years to 31 August 2025, A200 came out slightly ahead of VAS. The gap is narrow, and VAS’s relatively modest showing may partly reflect its somewhat higher weighting toward small-cap companies, a segment that underperformed larger-cap stocks during this period based on Morningstar data.
When measured by five-year standard deviation, the two funds were almost indistinguishable, with VAS at 12.7% and A200 at 12.6%, a spread so small it carries no practical significance for portfolio planning.
One honest limitation: A200’s listing history is shorter than VAS’s, so comparable ten-year return data does not yet exist for that fund, leaving investors with less historical evidence when assessing its long-run behaviour.
The valuation picture is where this gets more actionable for you if you are considering entering today. Morningstar’s weighted price-to-fair-value ratios place both funds above 1.2, which means both were trading above estimated fair value as of August 2025. A price-to-fair-value ratio above 1.0 means the market price exceeds what Morningstar’s equity research analysts estimate the underlying holdings are worth.
As of November 2023, both VAS and A200 have continuously traded above Morningstar’s fair value estimates, with neither fund returning to fair value or below in the period since.
What this means for you depends on how you invest. If you are putting a lump sum in at today’s prices, tempered forward return expectations are reasonable. If you are dollar-cost averaging over years or decades, point-in-time valuation matters considerably less because you are buying at many different prices over time, smoothing out any single entry point.
Past performance does not guarantee future results. Financial projections are subject to market conditions and various risk factors.
The comparison data narrows to two decision axes: fee priority versus diversification preference. Here is how to use them.
Choose A200 if you:
Choose VAS if you:
If neither set of criteria resonates more strongly than the other, A200’s lower cost is the most reliable tiebreaker. It is the one advantage that is guaranteed, does not depend on market conditions, and compounds every year you hold the fund. VAS is perfectly defensible for investors who value breadth and Vanguard’s platform, but that preference needs to be active, not passive.
For investors ready to move beyond the VAS vs A200 decision and into full portfolio construction, our dedicated guide to structuring an ETF portfolio covers asset allocation frameworks, cap-weighting mechanics, and the case for keeping total fund count below six to minimise fee drag and tax complexity.
How much you invest, how consistently you invest, and how long you stay invested will have a greater influence on your long-term wealth than the product choice between VAS and A200. The difference in outcomes between these two funds over a lifetime will be modest. The difference between investing consistently and not investing at all will be enormous.
The full comparison comes down to three verdicts:
Both funds carry a Bronze Morningstar Medalist Rating. Both give you exposure to the core of the Australian equity market. Both ranked among the highest ASX ETF net flow recipients when more than $11 billion flowed into ASX-listed ETFs in the first quarter of 2025. These are validated instruments with track records that justify confidence.
The decision between VAS and A200 is one worth making once, confidently, and then moving on from. The highest-return action available to you right now is not choosing the marginally better fund. It is choosing either one and starting.
This article is for informational purposes only and should not be considered financial advice. Investors should conduct their own research and consult with financial professionals before making investment decisions.
VAS tracks the S&P/ASX 300 Index and holds approximately 300 companies, while A200 tracks the Solactive Australia 200 Index and holds approximately 200 companies. The two funds share the same ten largest holdings, with the main differences being A200's lower fee of 0.04% versus VAS's 0.07%, and VAS's slightly broader small-cap exposure of around 5.5% versus A200's 3.4%.
A200 has a lower Total Cost Ratio of 0.04% per annum, compared to VAS at 0.07%, making A200 the cheapest broad Australian equity ETF on the ASX. On a $10,000 investment held for ten years at a 7% gross annual return, that fee gap translates to approximately $55 more in A200's favour.
VAS offers marginally broader diversification by holding around 100 additional small and micro-cap Australian companies, giving it approximately 5.5% in small and micro-cap exposure compared to A200's 3.4%. However, both funds are overwhelmingly driven by the same large-cap names, and the extra holdings make almost no practical difference to day-to-day portfolio behaviour unless small-cap stocks significantly outperform.
Over the five years to 31 August 2025, A200 came out marginally ahead of VAS on trailing price returns, with VAS's relatively modest showing partly attributed to its higher small-cap weighting during a period when smaller companies underperformed. Both funds recorded nearly identical five-year standard deviations of 12.7% for VAS and 12.6% for A200, meaning their risk profiles are essentially the same.
As of August 2025, Morningstar's weighted price-to-fair-value ratios placed VAS at 1.24 and A200 at 1.25, meaning both funds were trading above Morningstar's estimated fair value for their underlying holdings. Both funds have traded continuously above fair value estimates since at least November 2023, which suggests tempered forward return expectations for investors entering at current prices.