The S&P/ASX 200 assigns roughly half its weight to two sectors. Financials account for 27.9% and materials for 24.0% as of March 2025, according to S&P Dow Jones Indices factsheets. An investor who believes they own “the market” through a domestic index fund is, in practice, largely owning Australian banks and miners.
Australia’s ETF market has grown to nearly $195 billion in total funds under management, expanding 27% year on year to March 2025. Yet the question of whether investors are building genuinely diversified portfolios, or inadvertently compounding a domestic concentration problem, deserves closer examination. The structure of the ASX itself creates this risk, and it persists across time rather than reflecting a temporary aberration.
What follows is a diagnosis of the concentration embedded in the ASX, the mechanics that entrench it, an evaluation of the broad-market international ETFs most commonly used to offset it, and an assessment of where thematic ETFs fit in a portfolio construction framework.
Half the index, two sectors: the ASX’s structural problem
Financials represented 28.2% of the S&P/ASX 200 in December 2024 and 27.9% in March 2025. Materials stood at 23.2% and 24.0% over the same two snapshots. The broader All Ordinaries told a similar story: financials at 25.7% and materials at 24.5% as of December 2024.
Combined, financials and materials accounted for approximately 52% of the S&P/ASX 200 by market capitalisation as of March 2025.
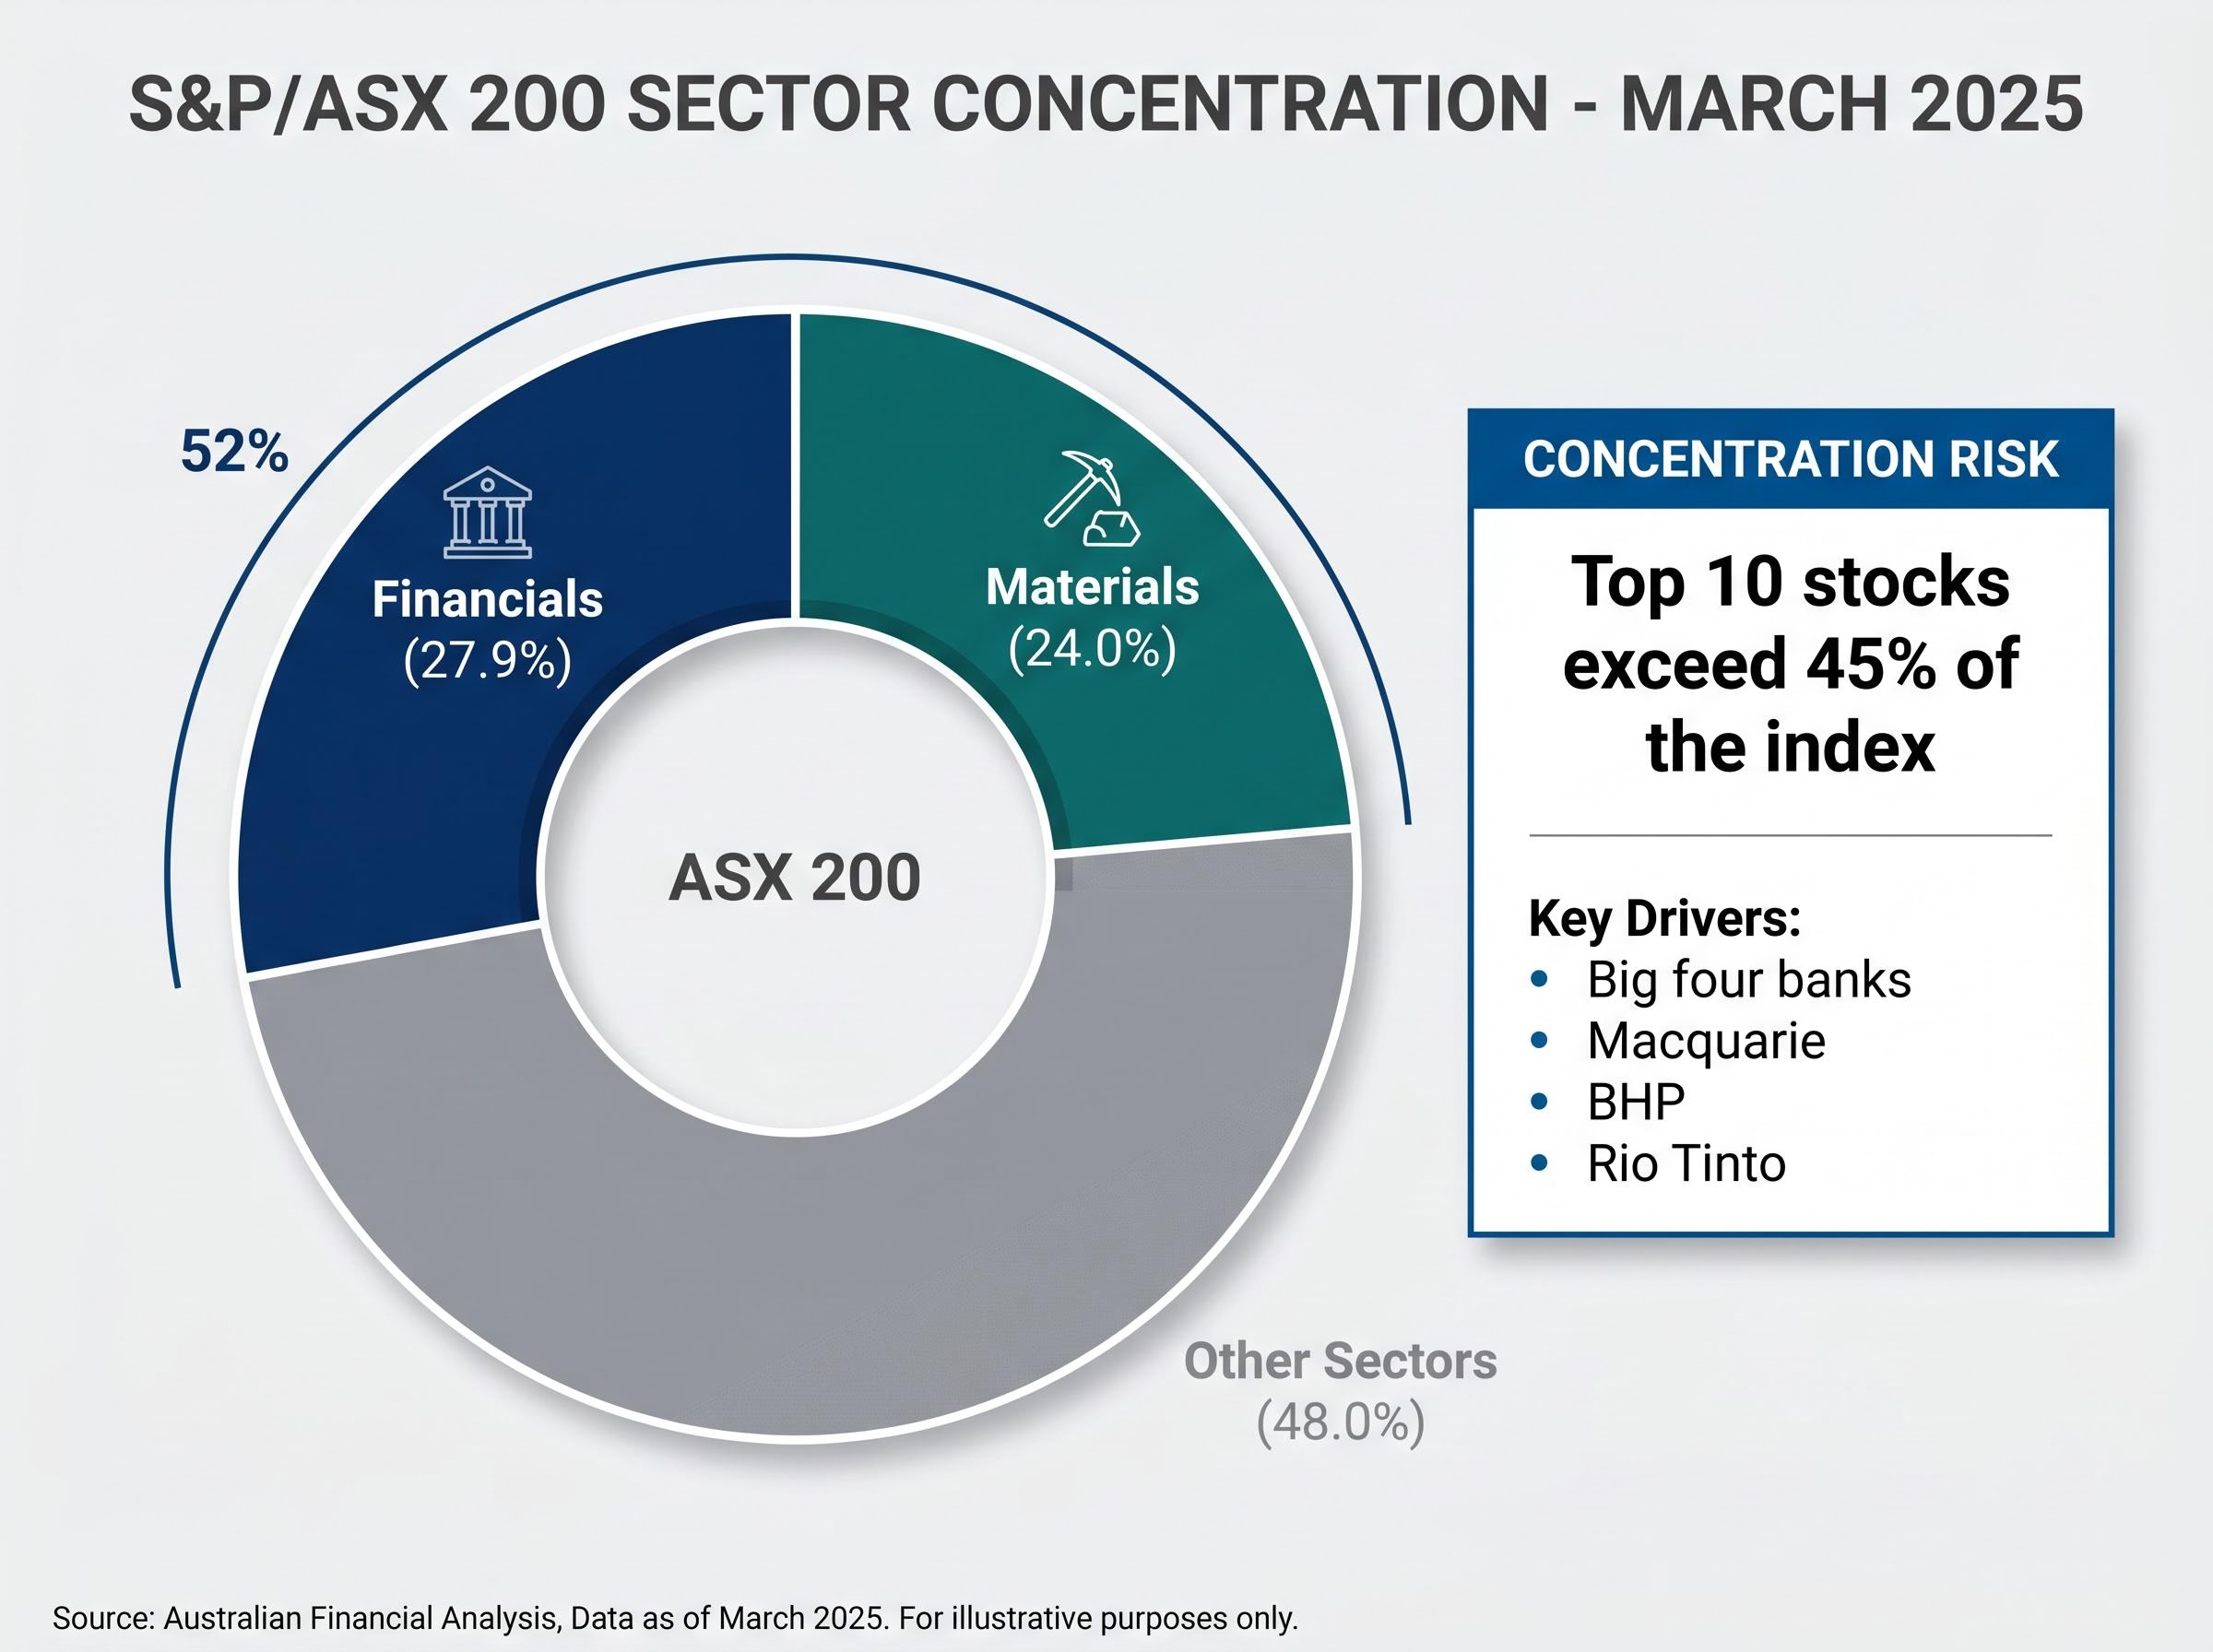
The names driving this weight are few. The big four banks and Macquarie dominate the financials column. BHP and Rio Tinto anchor materials. The numbers barely shifted across two separate S&P Dow Jones Indices snapshot dates, confirming a structural feature of the index rather than a cyclical artefact.
The dynamics of wealth concentration in large-cap ASX stocks make the diversification case even starker: Morningstar’s analysis found that only around 36% of large-cap ASX companies outperformed the ASX 300 index over a 15-year period, meaning a cap-weighted domestic index captures the rare outlier compounders while individual stock selection is structurally disadvantaged.
| Sector | December 2024 | March 2025 |
|---|---|---|
| Financials | 28.2% | 27.9% |
| Materials | 23.2% | 24.0% |
| Combined | ~51.4% | ~51.9% |
Source: S&P Dow Jones Indices factsheets, data as of 31 December 2024 and 31 March 2025.
What the ASX is missing
Technology and healthcare are materially under-represented in the ASX relative to their weights in the MSCI World or S&P 500 benchmarks. These are the sectors that have driven the majority of global equity returns over the past decade. Their near-absence from the domestic index is not cosmetic; it represents a structural gap in growth exposure for any investor whose equities allocation begins and ends with the ASX.
When big ASX news breaks, our subscribers know first
Why Australian investors keep concentrating anyway
The concentration is visible. The persistence, however, requires explanation. Three factors compound the structural tilt.
- Behavioural home bias: Vanguard Australia, in a March 2024 insight piece, described the tendency of Australians to overweight domestic equities relative to the global opportunity set. The ASX represents roughly 2% of global market capitalisation, yet domestic holdings dominate many retail portfolios.
- Franking credit incentives: As Graham Hand noted in Firstlinks in March 2024, franking credits create a specific gravitational pull toward bank and resource stocks, particularly for retirees and self-managed super funds (SMSFs). The tax efficiency of fully franked dividends encourages concentration in precisely the sectors already dominating the index.
- SMSF and retiree tax optimisation: Estimates suggest retail portfolios are often 60-80% in local shares, according to financial planners quoted in the Australian Financial Review in April 2024. For investors optimising at the individual holding level for after-tax income, the portfolio-level consequence is an amplified bet on domestic credit cycles and commodity prices.
Australian home bias carries a measurable return cost that compounds quietly over time; over the 10 years to June 2025, the ASX 200 delivered annualised returns of 11.1% including franking credits, trailing the MSCI World at 12.5% and the S&P 500 at 15.5%, with Morningstar confirming that franking credits alone do not close the gap for growth-oriented investors.
Vanguard Australia has described home bias as a factor that “could be holding back Australian investors,” arguing it increases portfolio risk and reduces diversification.
The result is a feedback loop. Investors optimising rationally for tax efficiency at the holding level are inadvertently concentrating portfolio-level risk. Recognising that home bias has structural causes, not just behavioural ones, helps explain why diversification requires an active decision rather than a passive drift.
What sector concentration actually means for a portfolio
Concentration risk, in practical terms, means exposure to correlated drawdowns when a single sector faces a shock. It also means reduced capacity to benefit from growth in sectors absent from the index. For a portfolio weighted toward banks and miners, the specific risk vectors are identifiable.
- Credit cycle exposure: Australian bank earnings are tightly linked to domestic mortgage growth and credit quality
- Commodity price sensitivity: Materials stocks move with global commodity demand, particularly iron ore and lithium cycles
- Housing market linkage: Bank valuations carry embedded exposure to Australian residential property prices
- Regulatory risk: The banking sector faces periodic regulatory interventions that can compress margins across the big four simultaneously
BetaShares has estimated that the top 10 stocks exceed 45% of the ASX 200 by market capitalisation. When a handful of names carry that much weight, a sector-specific shock propagates rapidly through the index.
The persistence of this concentration across multiple S&P Dow Jones snapshot dates reinforces that these risk vectors are permanent features of the domestic equity market, not temporary conditions awaiting correction.
The sectors the ASX barely touches
The comparative under-weight in technology and healthcare versus the MSCI World means that an ASX-only investor misses the sectors that have generated the strongest returns globally over the past decade. The cost of concentration is not limited to risk; it includes forgone exposure to the growth engines of the global economy.
The broad-market ETF case: VGS, IVV, and the diversification argument
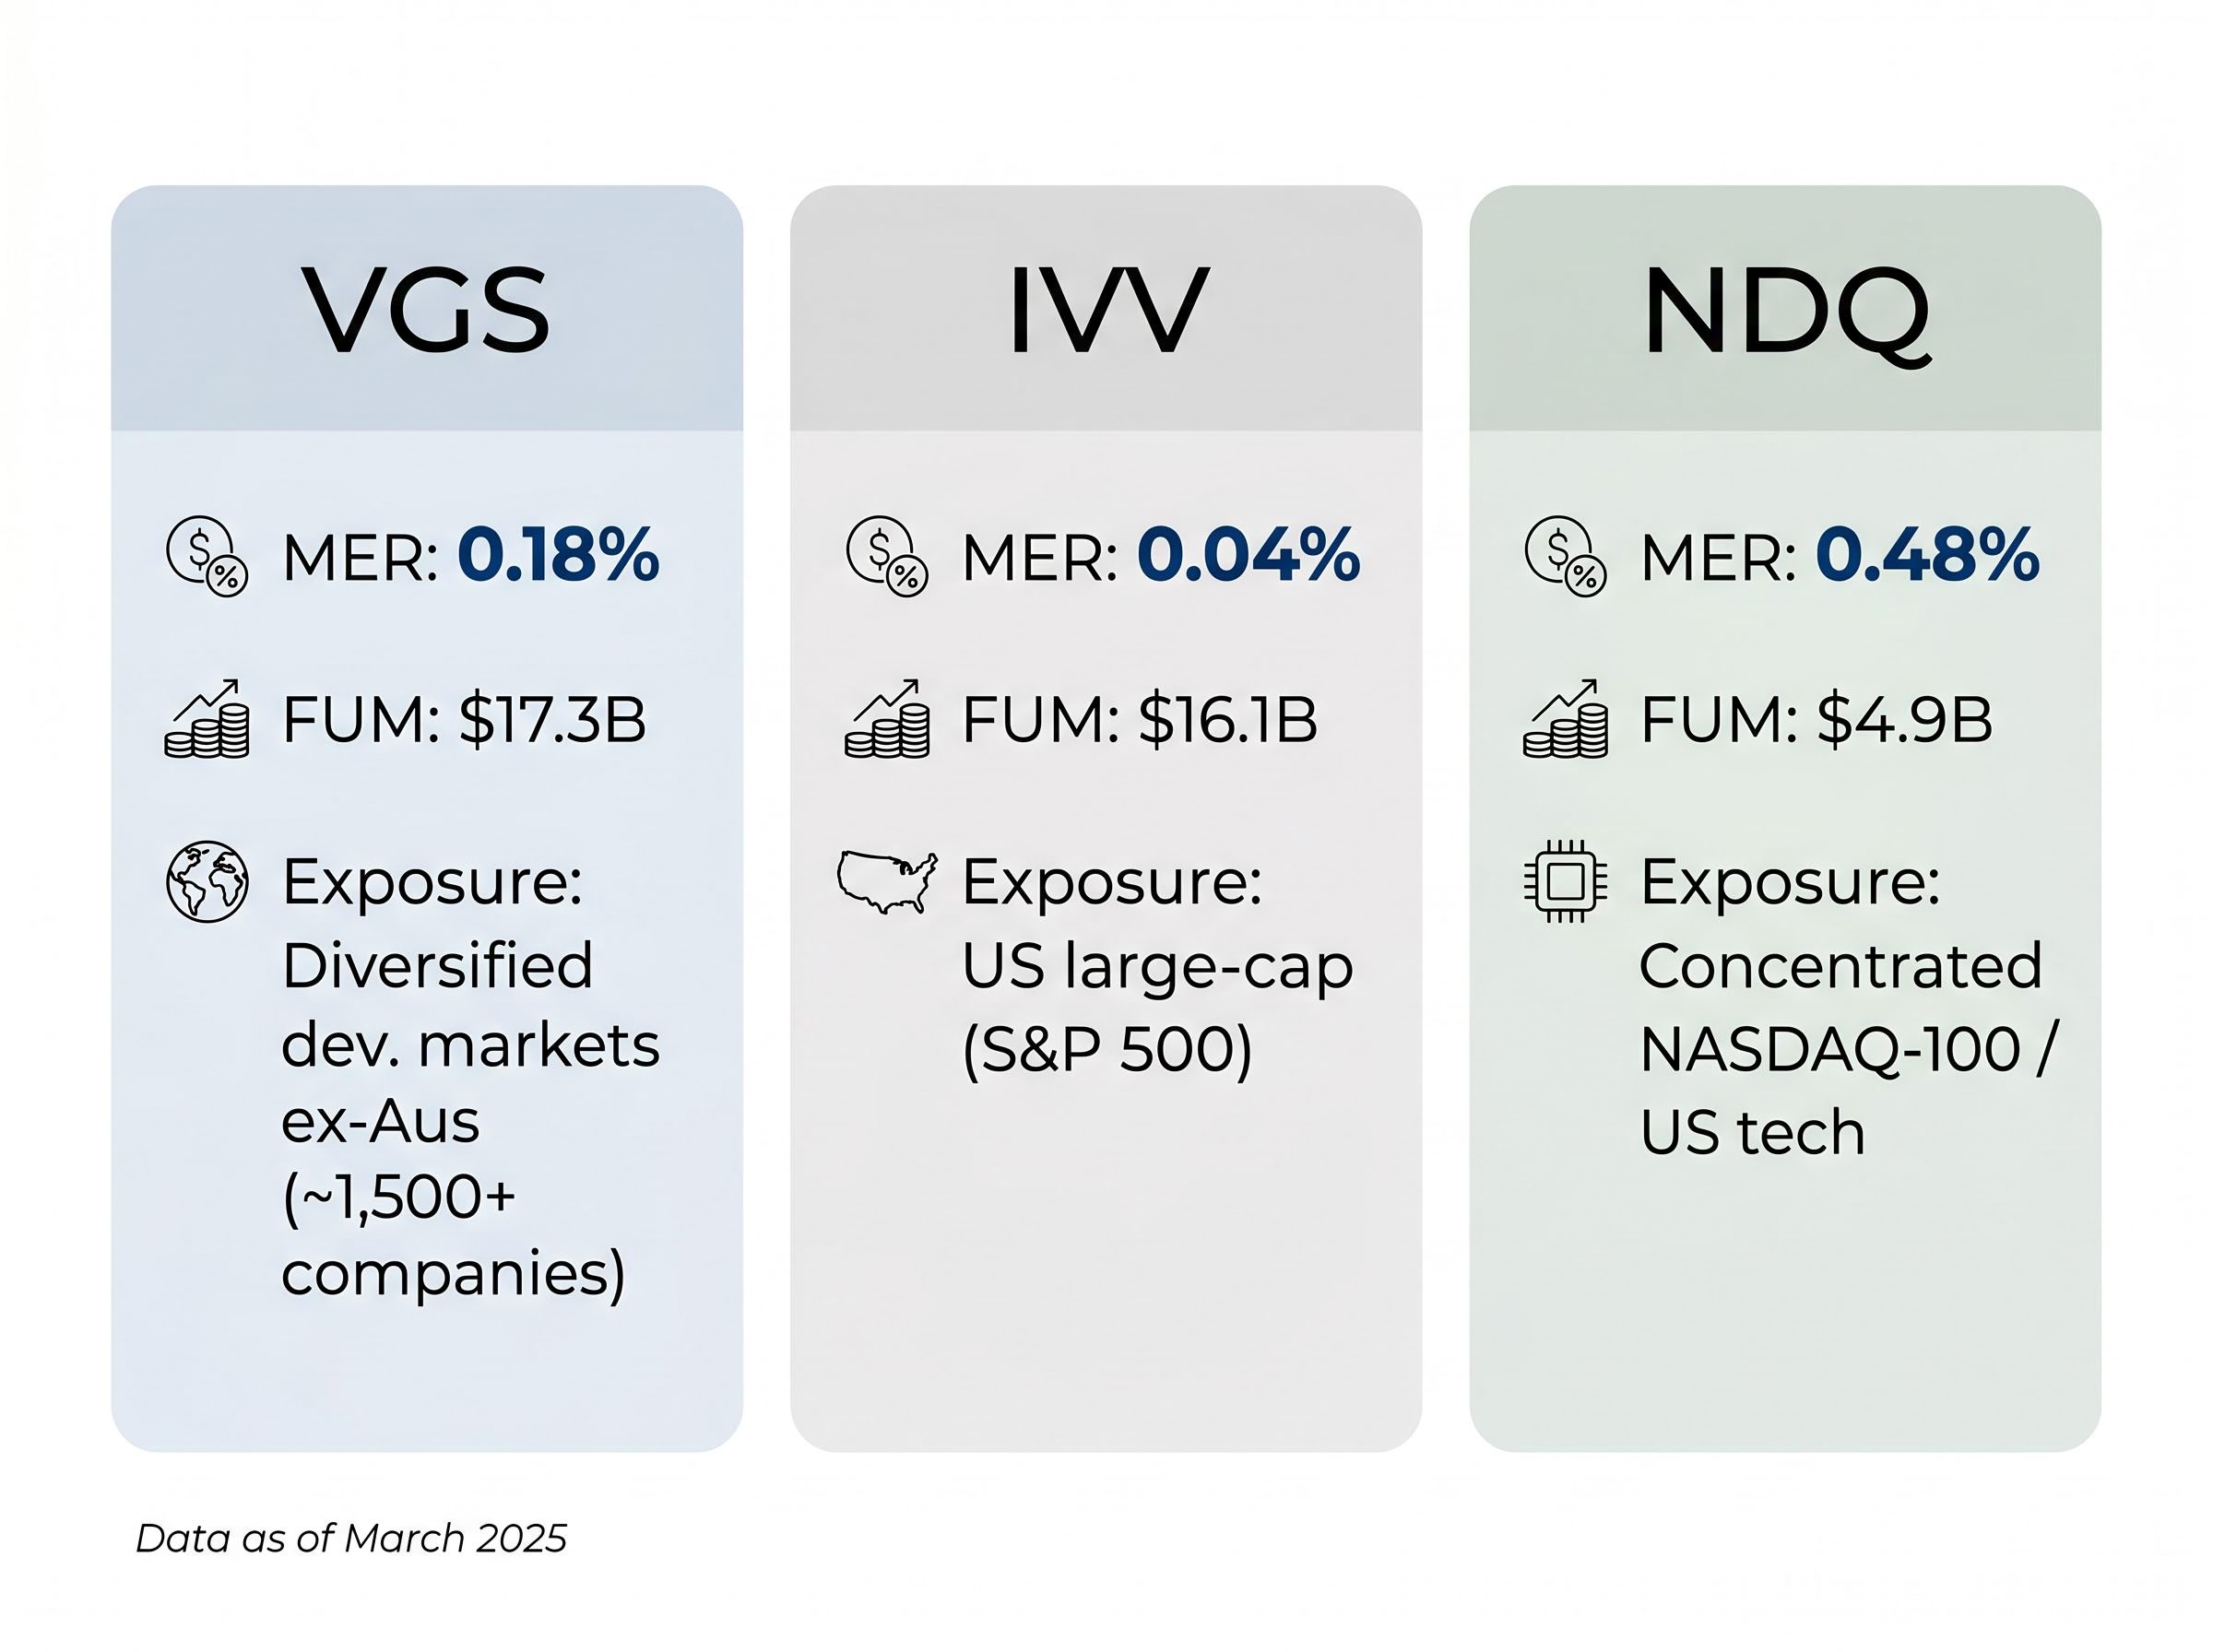
Three international ETFs dominate the ASX-listed landscape by funds under management, each offering a distinct approach to the concentration problem.
| ETF | MER | FUM (March 2025) | Exposure |
|---|---|---|---|
| VGS | 0.18% p.a. | $17.3 billion | Diversified developed markets ex-Australia (~1,500+ companies) |
| IVV | 0.04% p.a. | $16.1 billion | US large-cap (S&P 500) |
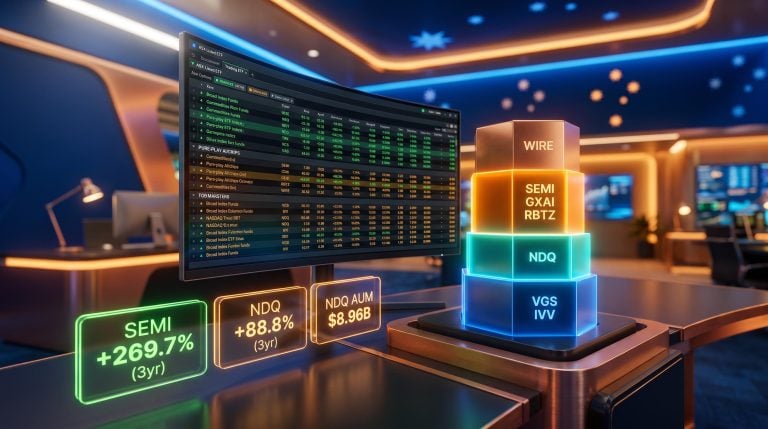
| NDQ | 0.48% p.a. | $4.9 billion | Concentrated NASDAQ-100 / US tech |
Source: Vanguard, BlackRock, and BetaShares product factsheets, data as at 31 March 2025.
IVV charges a management expense ratio of just 0.04%, a reference point for how low fees have fallen in the broad-market space.
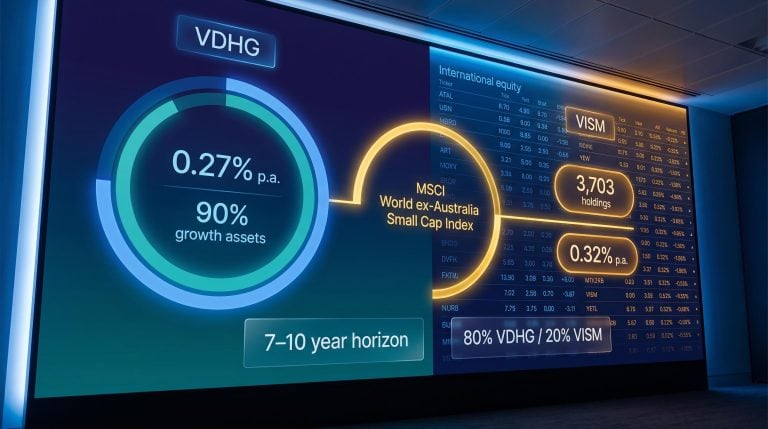
VGS provides the broadest remedy. Its MSCI World ex-Australia mandate specifically excludes Australian equities, offering exposure to technology, healthcare, and consumer sectors that the ASX under-represents. Morningstar Australia, in an August 2024 analysis, identified VGS as the preferred broad global equity exposure for Australian investors seeking to diversify away from domestic concentration.
IVV delivers pure US large-cap exposure at the lowest cost of the three but concentrates entirely on one market. NDQ doubles down on technology through the NASDAQ-100 at a materially higher fee, adding concentration rather than reducing it.
The total Australian ETF market reached $195.0 billion by March 2025, with 27% year-on-year growth, according to the BetaShares ETF Review. Broad-market global equities remained the largest inflow category, confirming most ETF investors are already using diversified products as core holdings.
The BetaShares ETF Review for March 2025 recorded total Australian ETF industry funds under management at approximately $195 billion, with 27% year-on-year growth, confirming that broad-market global equities remained the dominant inflow category across the period.
Thematic ETFs: AI, cybersecurity, and the satellite question
The appeal is genuine. Global technology and AI-related funds were among the strongest performing ETFs over the 12 months to March 2025, according to BetaShares. Morningstar reported in May 2024 that AI and technology-linked thematics outperformed broad-market benchmarks over trailing one-to-three-year periods. Livewire Markets found similar results over the one year to August 2024.
The pattern, however, is consistent across every source reviewed: that short-term outperformance comes with materially higher volatility and larger drawdowns. Livewire noted that AI and technology thematics underperformed VGS and IVV over the three-year period, despite their one-year lead. Firstlinks, in October 2024, observed that some AI thematic funds are effectively leveraged technology bets concentrated in a handful of US mega-cap names.
Three specific risk factors emerge in sequence:
- Higher volatility and drawdowns: Thematic ETFs experience larger peak-to-trough declines than diversified global indices, making them harder to hold through corrections
- Pro-cyclical flow timing risk: Investors tend to buy thematic ETFs after strong performance, often near peak valuations, amplifying the probability of poor entry points
- Hidden concentration within the thematic itself: Narrow mandates can result in outsized exposure to a small number of stocks, reducing the diversification benefit the investor may assume they are receiving
The behaviour gap in thematic ETFs, where the time-weighted return reported by a fund and the money-weighted return actually experienced by investors can diverge by hundreds of percentage points, is the most underappreciated risk in the thematic allocation decision; the ARK Innovation ETF illustrates this precisely, reporting a 233% cumulative gain while the typical investor experienced approximately negative 35% due to capital flowing in near peak valuations.
BetaShares has characterised thematic ETFs as “best considered as satellites around a diversified core exposure.”
Some advisers recommend capping thematic allocations at 5-10% of total equities exposure, according to portfolio managers quoted in the Australian Financial Review in June 2024. The consensus across Morningstar, Livewire, the AFR, and Firstlinks converges on a single position: thematics complement a diversified core but should not substitute for one.
The next major ASX story will hit our subscribers first
Building from the outside in: what a genuinely diversified Australian portfolio looks like
The analytical thread across each section points toward a consistent framework. The core-satellite model provides the practical synthesis: a diversified global core to offset ASX concentration, with any thematic or sector-specific ETFs serving as deliberate, sized satellite positions.
The practical principles are straightforward:
- Establish a diversified global core first, using broad-market products such as VGS or IVV that directly address the ASX’s structural gaps
- Size domestic holdings consciously rather than by default, acknowledging the franking credit argument as one input in portfolio construction rather than a reason to concentrate
- Treat thematic ETFs as deliberate satellite positions with defined allocation limits, not as core substitutes
Building a core global position via IVV at 0.04% or VGS at 0.18% is materially cheaper than almost any active alternative. The cost barrier that once made global exposure impractical has largely disappeared.
For investors ready to move from framework to implementation, our comprehensive walkthrough of building an ASX ETF portfolio covers specific allocation splits across VAS, VGS, and NDQ, the tax implications of each fund for Australian resident investors, and the mechanics of placing an order on the ASX, including how to rebalance as technology sector drift pushes NDQ above its intended weight.
What the flow data tells us
BetaShares flow data confirms that broad-market global equities captured the majority of $21.2 billion in calendar-year 2024 net inflows, with the pattern continuing into 2025. The market’s collective verdict on how to use ASX-listed ETFs is already skewing toward diversified foundations. Most investors are building in this direction; the question is whether the allocation is deliberate and sized appropriately, or simply following the path of least resistance.
The concentration problem is not going away, but the tools to manage it are better than ever
The ASX’s financials and materials concentration is structural. It was approximately 51% combined in December 2024 and approximately 52% in March 2025. There is no mechanism within the domestic market that will self-correct this weighting.
What has changed is the cost and accessibility of the remedy. Low-cost, large-scale international ETFs now make genuine global diversification available to any investor. VGS at 0.18% and IVV at 0.04% provide exposure to the sectors and geographies the ASX structurally under-represents, at fees that would have been unimaginable a decade ago.
The question for Australian investors is no longer whether to diversify globally. It is how deliberately to do it, how to size domestic holdings with full awareness of the concentration they carry, and what role, if any, thematic satellites should play atop that foundation.
This article is for informational purposes only and should not be considered financial advice. Investors should conduct their own research and consult with financial professionals before making investment decisions. Past performance does not guarantee future results.