Most new traders watch price move and assume they are seeing the whole story. They are not. Price without volume is a rumour without a source, a move that could reflect genuine institutional conviction or nothing more than a handful of orders crossing a thin book. Volume data sits on every charting platform, yet it remains one of the most consistently misread indicators among newer market participants. Real examples from June 2026, spanning stocks including Palantir Technologies, Guardant Health, AST SpaceMobile, and Astera Labs, show these principles playing out in current markets. What follows is a structured, scenario-by-scenario framework for reading trading volume alongside price and RSI, illustrated with specific chart examples and backed by a practical checklist to apply before every trade.
Volume’s role as a confirmation tool (and where it falls short)
The first step in learning to read volume is understanding what it actually does, and what it does not do. A simple three-part model separates the core chart indicators into distinct, non-interchangeable roles:
- Price gives direction: up, down, or sideways
- RSI and momentum give strength: how fast and how forcefully a move is occurring
- Volume gives commitment: how many participants are backing the move with real capital
None of these roles substitute for another. Volume does not predict future direction on its own. Its power lies in strengthening or weakening signals already generated by price structure and momentum. A stock can break above a resistance level on a clean candle with RSI accelerating above 50, but if volume on that bar is well below average, the broader market has not endorsed the new level.
The Blume, Easley, and O’Hara research on volume and price sequences established formally that volume carries information about the quality of price signals that cannot be extracted from price alone, and that traders who incorporate volume into their analysis consistently outperform those who rely on price exclusively.
That failure mode is the single most common cause of false breakouts. Price advances, the chart looks right, and a trader enters, only to watch the move reverse within days because insufficient participation backed it. Understanding this hierarchy prevents a large category of losing trades driven by moves the market never confirmed.
Volume’s role as a confirmation tool makes more intuitive sense once you understand the price discovery mechanics that govern how orders actually move prices: passive limit orders sitting in the book contribute roughly 45% of price formation, meaning a thin order book can be shifted by surprisingly little capital, which is precisely why low-volume price moves deserve skepticism.
“Price tells you where it’s going. Volume tells you whether anyone else is coming with you.”
When big ASX news breaks, our subscribers know first
How healthy trends look on a volume chart
Reading volume starts with recognising the four core price-volume pairings. Each combination carries a distinct meaning, and building an intuitive vocabulary for these patterns matters more than memorising rules.
| Price Action | Volume Behaviour | Interpretation |
|---|---|---|
| Rising price | Rising volume | Confirmed uptrend; buyers are active and committed |
| Falling price | Rising volume | Confirmed downtrend; sellers are in control with strong pressure |
| Falling price | Falling volume | Weakening downtrend; selling pressure is fading |
| Rising price | Falling volume | Caution; advance lacks participation and risks stalling or reversing |
Each of these pairings is visible in recent markets. Peabody Energy (BTU) advanced from the mid-teens to the low $30s between August and October 2025 with above-average volume on up days, a volume-confirmed uptrend. Bread Financial Holdings (BFH) declined from approximately the low $60s during February through April 2025 while volume reached multi-month highs, confirming aggressive selling pressure.
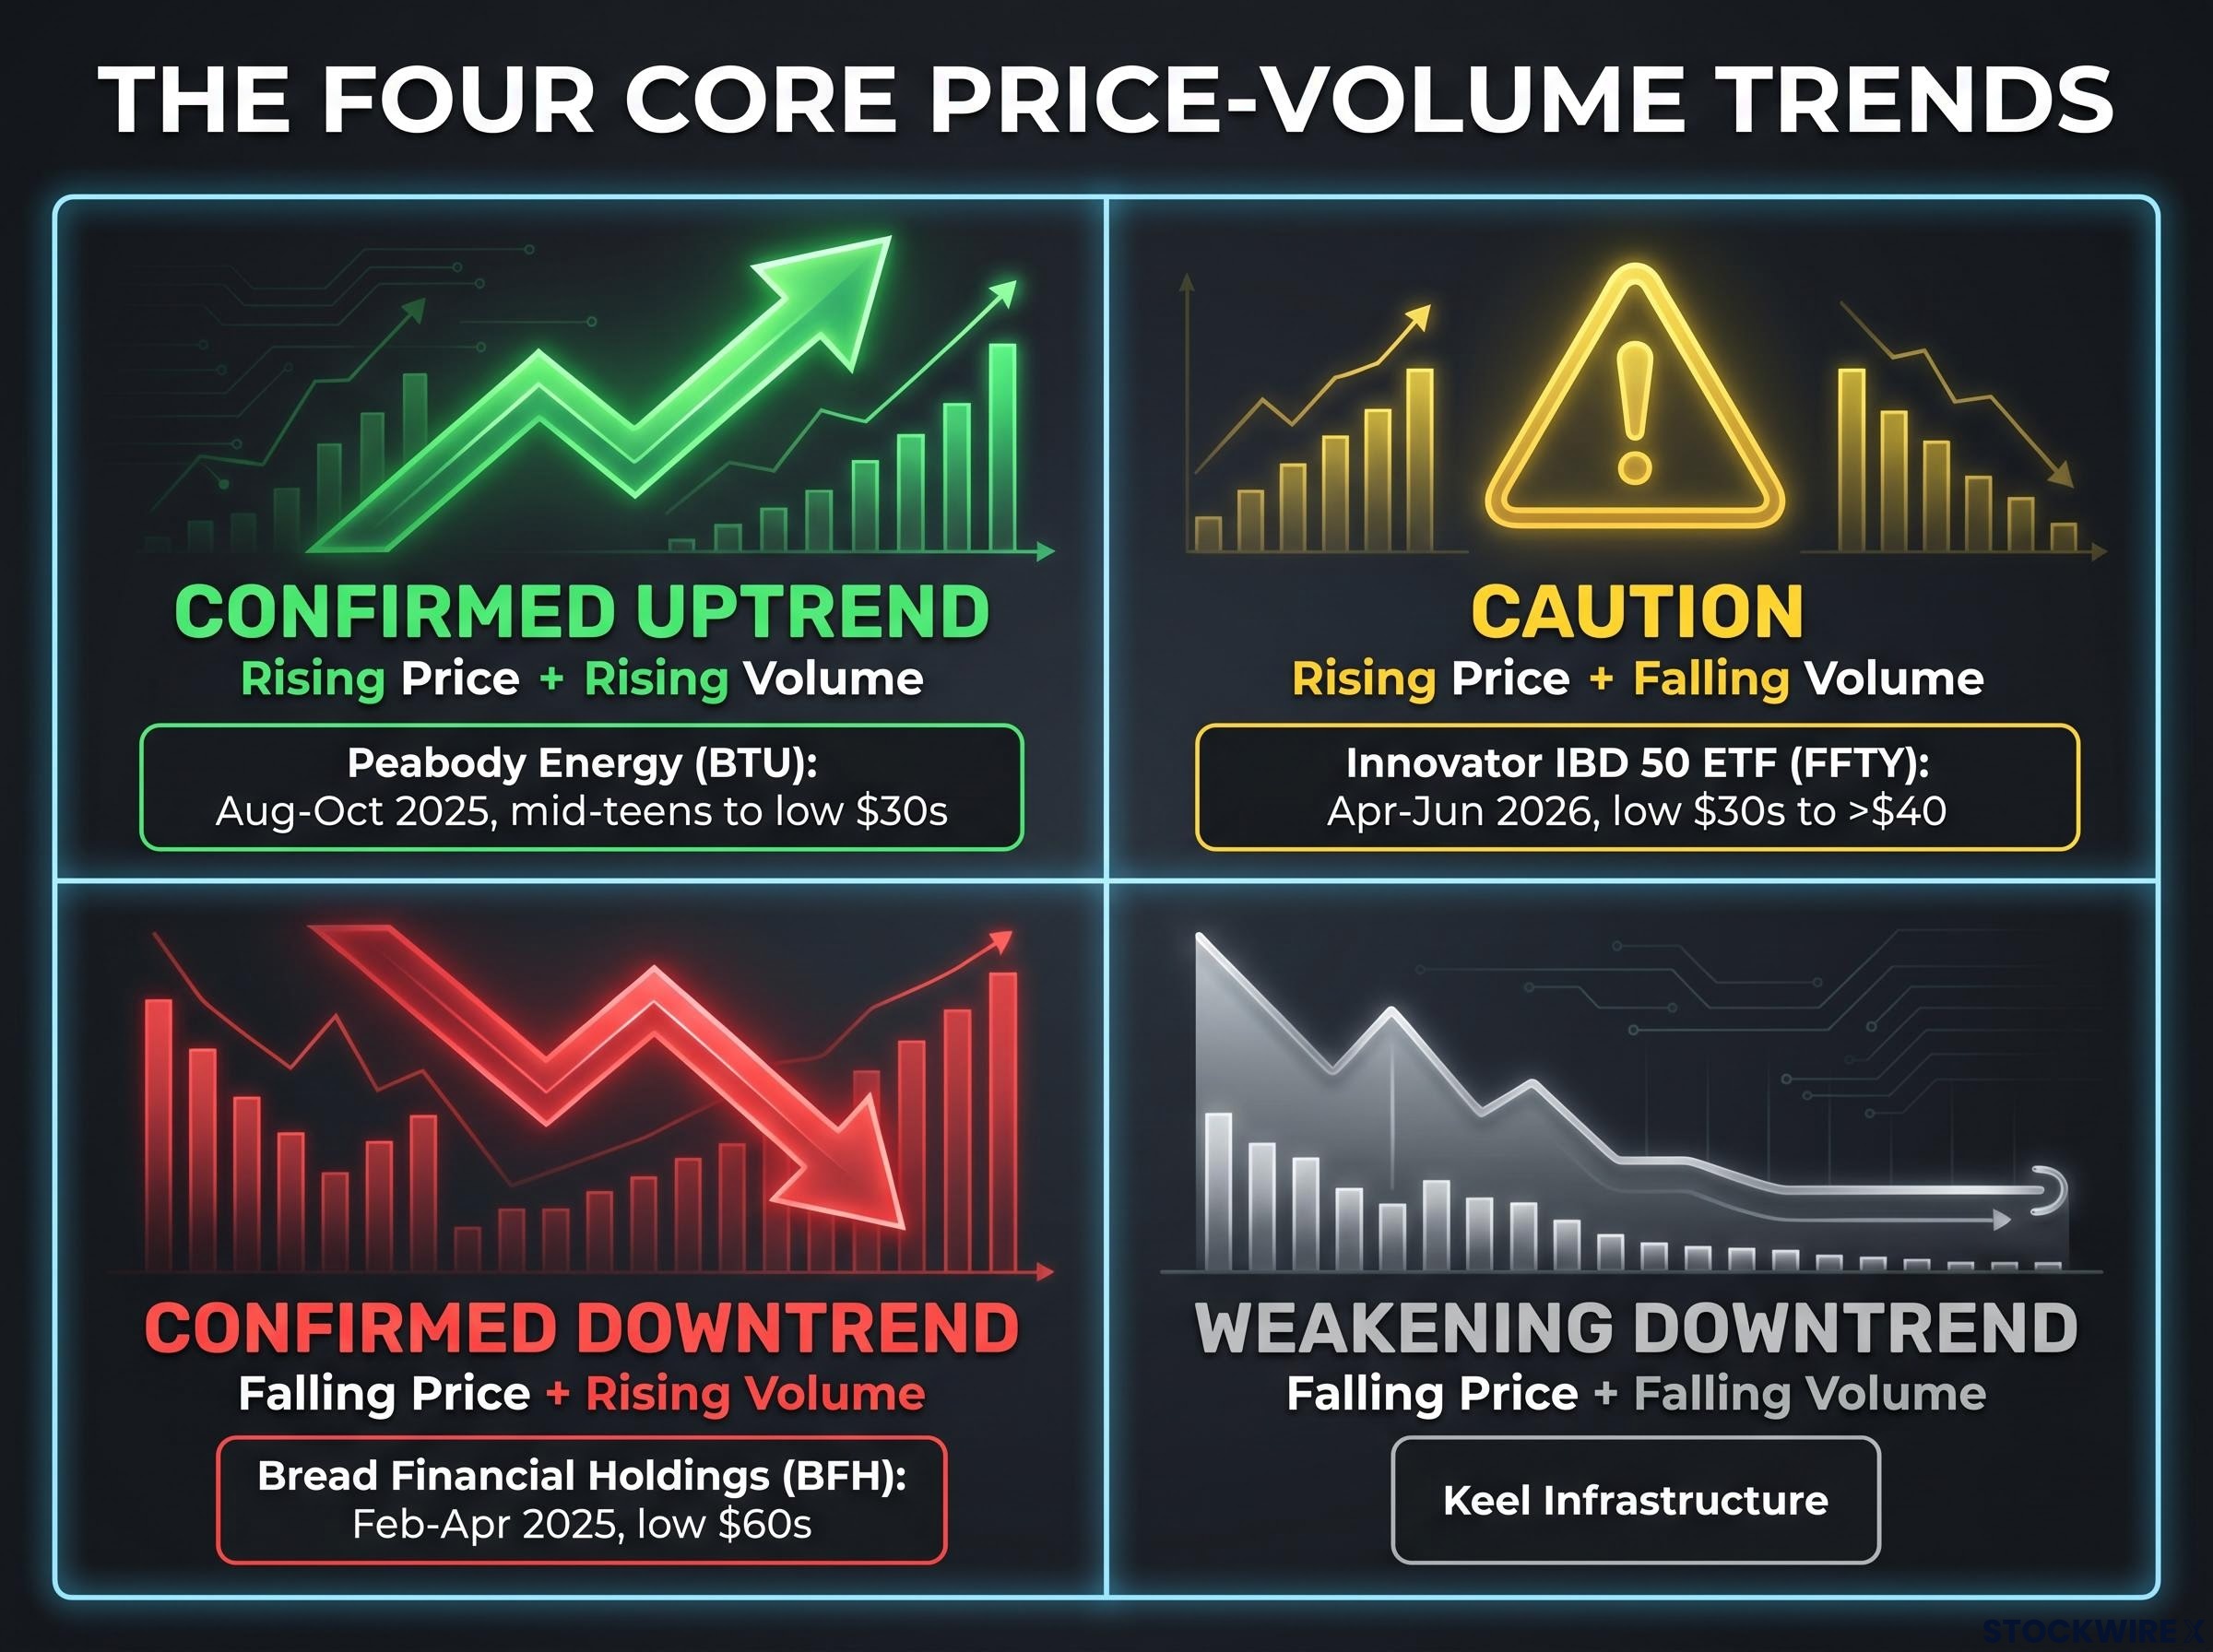
On the deterioration side, Keel Infrastructure fell while both volume and its moving average contracted, a downtrend losing participation rather than gaining it. And the Innovator IBD 50 ETF (FFTY) advanced from the low $30s to above $40 between April and June 2026 while the volume histogram and its moving average simultaneously declined, a divergence warning that the rally’s support was thinning.
Index-level confirmation failures follow the same participation logic as single-stock volume divergences; when the Dow Theory’s industrial and transportation averages fail to confirm each other’s highs, the structural reasoning is identical to a stock breaking resistance while volume stays flat, and a single distorted component can make the whole signal misleading.
Practical trend checklist using volume
For any uptrend, three volume conditions should hold:
- Up days show largely above-average volume
- Pullbacks show below-average volume
- The volume moving average is flat or rising
For a downtrend, the mirror applies:
- Down days carry above-average volume
- Bounces occur on lighter volume
One additional note: declining volume during a sideways range typically signals a pause rather than a reversal. The market is waiting, not turning.
Why volume is the most reliable breakout filter
Breakouts are inherently high-risk events. A stock pushes through a level that has contained it, and the trader must decide in real time whether the move is genuine or a trap. Volume is the primary filter that separates the two.
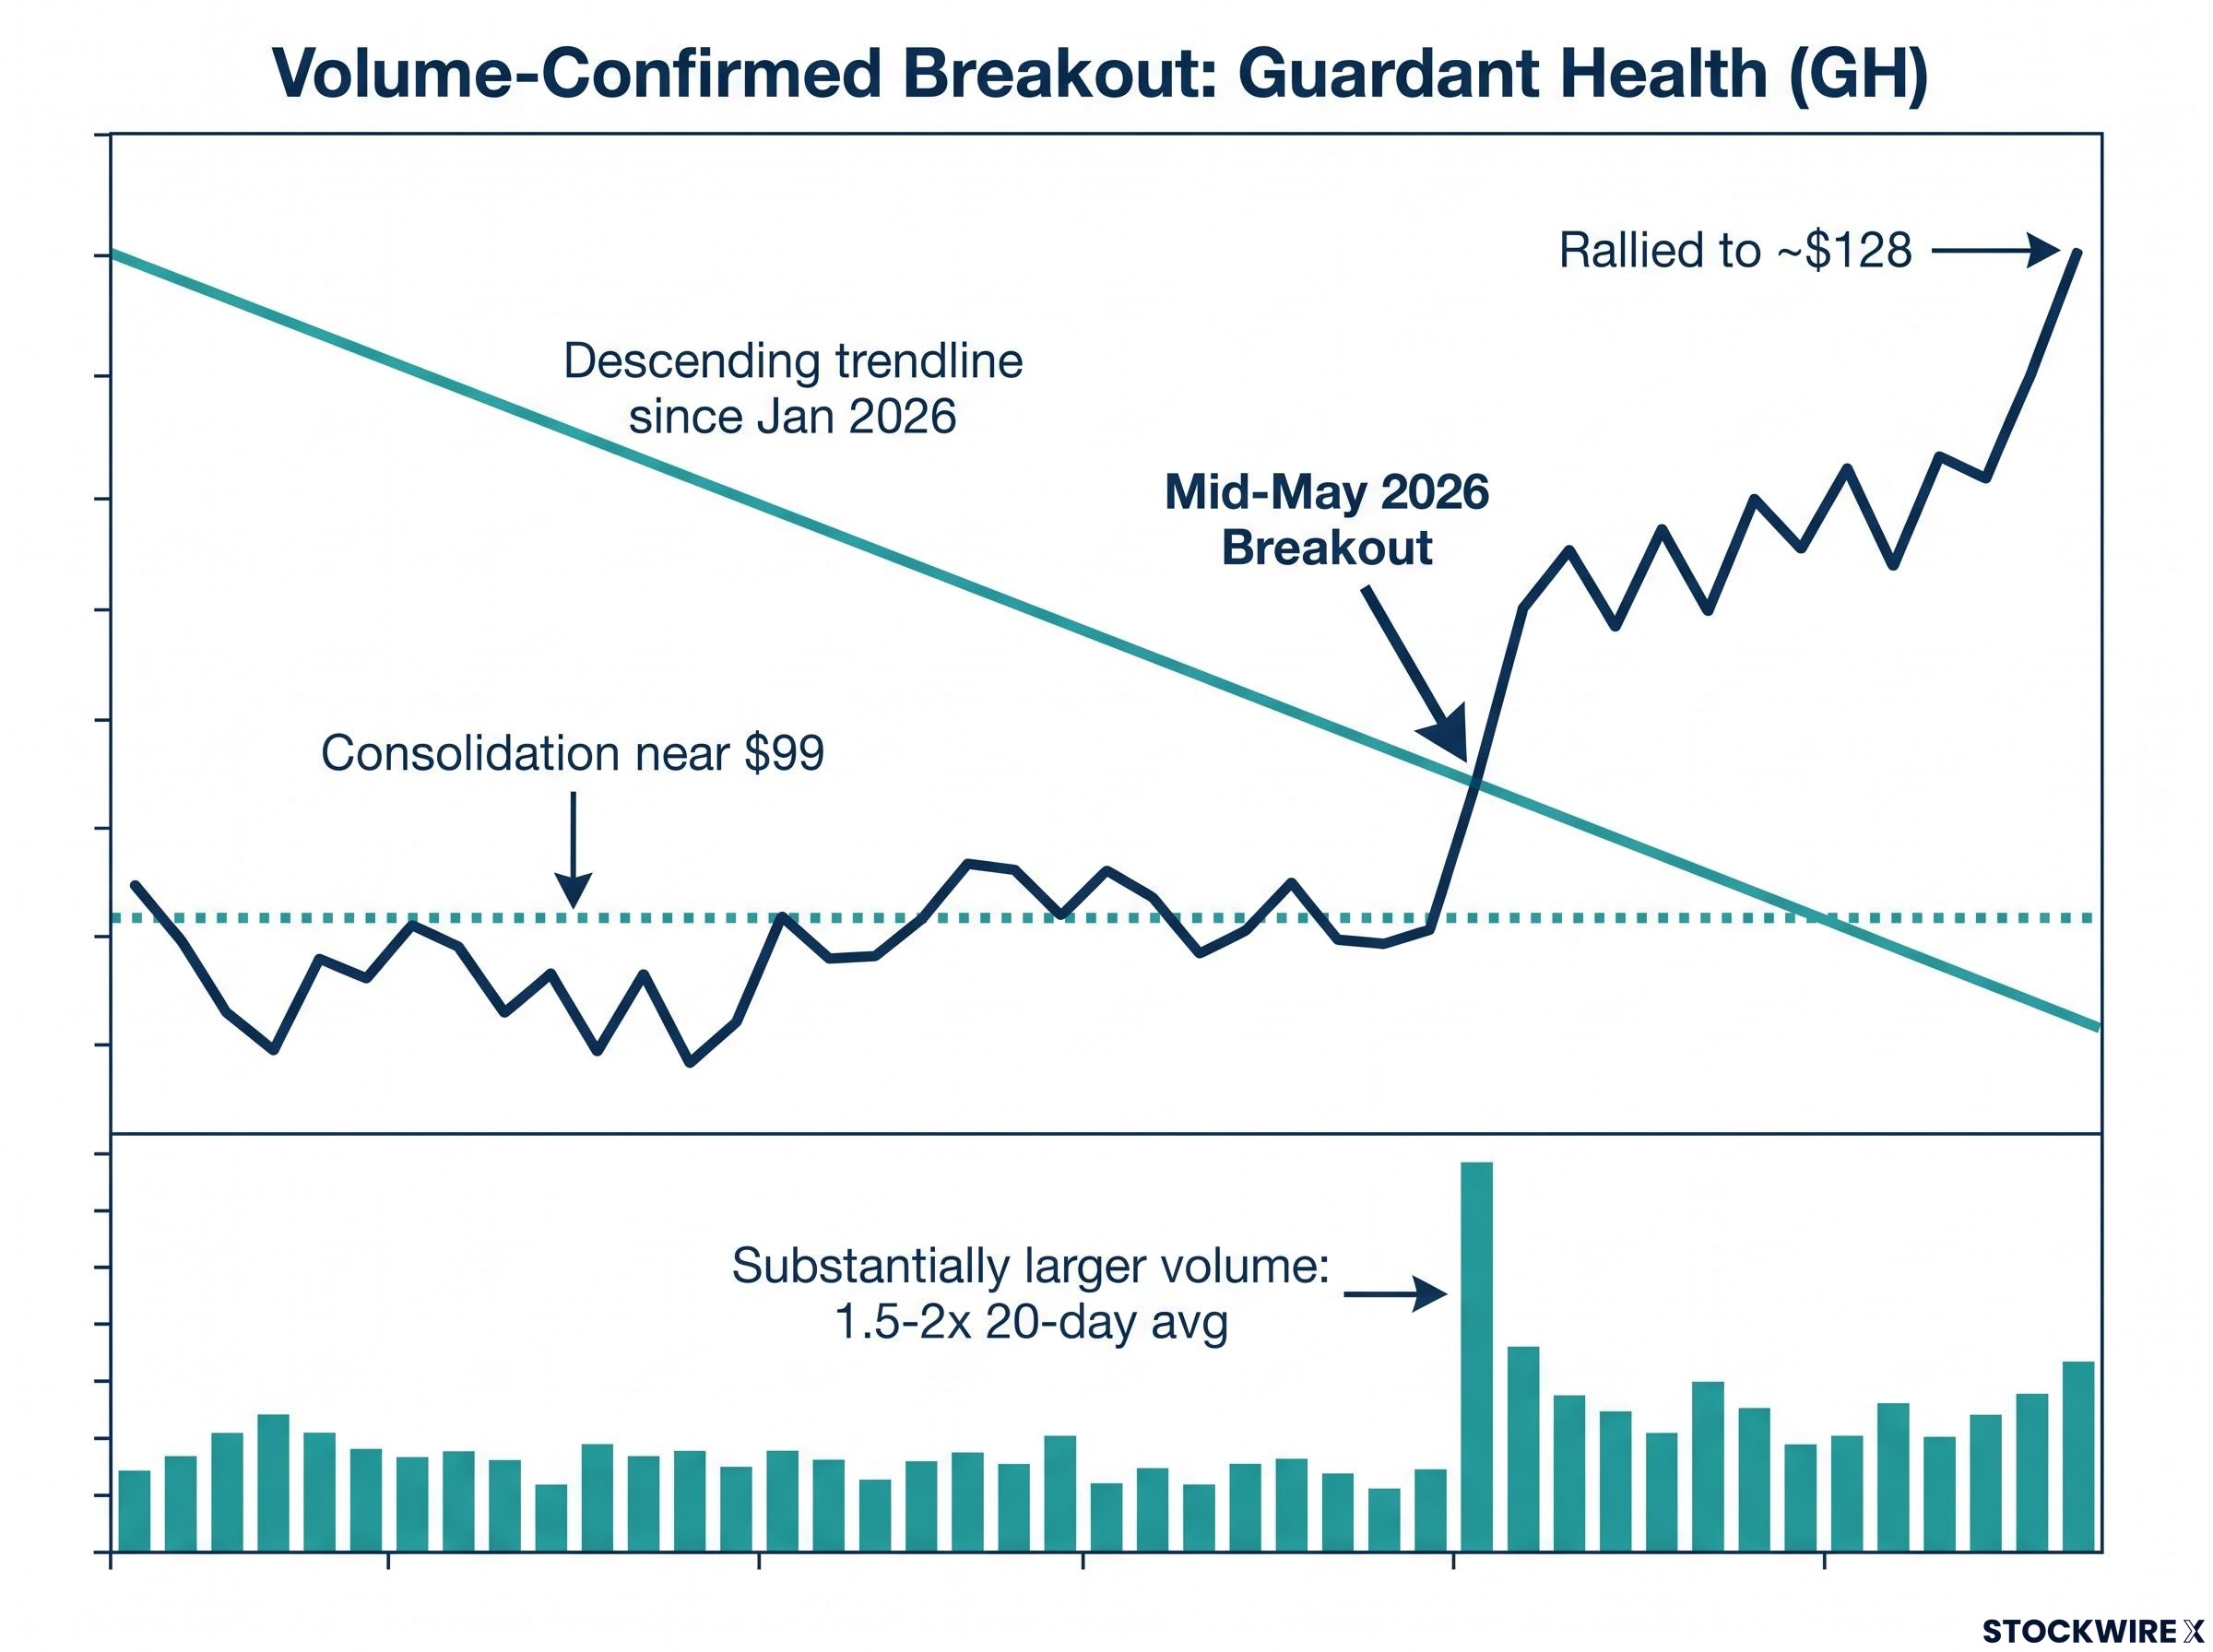
A practical threshold: look for breakout volume of at least 1.5-2x the 20-day average volume. Some traders seek approximately 3x for especially strong setups.
The logic is straightforward. High relative volume on a breakout bar means broad participation; many market participants have endorsed the new price level simultaneously. Low-volume breakouts lack that endorsement, and the move is far more likely to fail.
The same low-liquidity conditions that produce false breakouts on thin volume also create the environment most exploited by bad actors; manipulated volume signals in thinly traded stocks share a visual profile with genuine breakouts, making the ability to distinguish real participation from synthetic activity a practical protection against schemes that cost retail traders millions each year.
Guardant Health (GH) demonstrated this principle clearly. After consolidating near $99 and repeatedly testing a descending trendline since January 2026, price broke above that trendline in mid-May 2026 on a volume bar substantially larger than any seen in the preceding weeks. The stock subsequently rallied to approximately $128. The volume bar was the confirmation; the price break alone would have been ambiguous.
Agnico Eagle (AEM) offered a two-sided illustration. Price broke above horizontal resistance near $187.50 in January 2026 on rising volume, confirming the initial bullish breakout. When price then pulled back during April and May 2026, volume expanded on the decline, confirming bearish intent on the retest.
Before trading any breakout, four questions deserve answers:
- Is the level meaningful? Clear horizontal support or resistance, a trendline, or a well-defined pattern boundary.
- Is today’s volume meaningfully above the recent average? Preferably 1.5-2x the 20-day average or more.
- What happens on the first pullback? Declining volume on the retest is constructive. Rising volume against the breakout direction is a caution signal.
- Is price holding the broken level after that first test? If yes, with light volume on the retest, the odds of continuation improve materially.
How volume behaves at trend extremes: tops, bottoms, and the signals in between
Volume does its most dramatic work not in the middle of trends, but at their extremes. This is where emotional participation peaks, and the visual signature is remarkably consistent.
Exhaustion follows a recognisable pattern. An extended trend produces a near-vertical price move, and then an outsized volume spike appears. At a high, the spike represents the last wave of late buyers; once they are in, upside fuel is depleted. At a low, the spike represents the last wave of panicked sellers; once they are out, downside pressure eases.
Palantir Technologies (PLTR) illustrates the pattern across multiple instances. Between July 2025 and May 2026, according to analysis by Bruce Powers at FXEmpire, nearly every significant local price high and low was accompanied by a volume spike, a consistent visual signature of emotional participation clustering at turning points.
Capitulation versus continuation: telling them apart
Capitulation is the downtrend-specific variant of exhaustion. Remaining holders exit simultaneously in a final burst of panic selling. The visual is distinctive: a sharp plunge to new lows, often gap-like, accompanied by a massive volume spike that may be the largest in months. After that burst, sellers are effectively depleted.
Avista Corporation (AVA) showed this pattern multiple times during the second half of 2025 into early 2026. In each instance, price broke to new lows while volume spiked to several times normal levels, and in each case, price began recovering on subsequent bars.
A volume spike alone, however, cannot distinguish exhaustion from a high-energy continuation leg. The distinction emerges from what price does next. Confirmation signals to watch after a capitulation spike include:
- Declining range on subsequent bars (the selling is losing force)
- A higher low forming after the spike bar
- RSI improving and reverting toward the 50 midline
- Stronger volume on up bars than on down bars in the days that follow
If instead, large bars continue in the prior trend direction with sustained volume, the spike was energy, not exhaustion. The combination of subsequent price structure, RSI, and volume behaviour is what converts a volume spike from an ambiguous signal into an actionable one.
Quiet periods, compressed ranges, and the volume surge that follows
Quiet, range-bound markets with shrinking volume bars tend to repel attention. Most traders want action, and a stock drifting sideways on thin participation looks like nothing is happening. That perception is wrong. What is actually happening is energy storage.
The contraction signature has three components:
- Price trades in a tightening range (volatility compresses)
- The volume moving average trends downward
- Neither buyers nor sellers are pressing aggressively; participation is low
The expansion signature is its opposite:
- Price breaks out of the contraction range
- Volume surges sharply above average
- Bars grow larger and momentum (RSI) accelerates
Astera Labs (ALAB) illustrated this dynamic precisely. Between November 2025 and early February 2026, price moved sideways in a range bounded by approximately $134 and $190 while volume gradually tapered. In early February 2026, price broke down sharply from the range and volume surged dramatically. The stored energy of weeks of quiet consolidation converted into a decisive directional move.
The more pronounced the prior contraction (tighter range plus lower volume), the more attention the setup deserves. The trade is not the range itself. The trade is the break from the range with confirming volume.
When price, volume, and RSI point in the same direction
The highest-quality setups are not about any single indicator. They occur when price, RSI, and volume all tell the same story simultaneously. This triple confirmation does not guarantee success, but it meaningfully tilts the statistical odds by confirming that direction, momentum, and participation are all pointed the same way.
Bullish alignment, step by step:
- Price breaks above resistance or completes a bullish pattern, with higher lows in place
- RSI crosses above 50 or is trending higher, with no bearish divergence at entry
- Volume on the breakout bar is meaningfully above average, and pullbacks show lighter volume
AST SpaceMobile (ASTS) followed this template in early June 2025. Price broke above $29 resistance; volume in subsequent sessions was the largest recorded over the prior two months; RSI crossed above the 50 midline. The stock advanced from approximately $29 to nearly $60 over the following weeks.
Bearish alignment, step by step:
- Price breaks below support or completes a bearish pattern such as a rising wedge
- RSI drops below 50 or is crossing down through it, with no bullish divergence
- Breakdown days show elevated or rising volume, and rallies occur on subdued volume
Palantir Technologies (PLTR) matched this template in mid-February 2025. Price broke down from a rising wedge through a support level on rising volume. RSI dropped below 50. The stock subsequently lost approximately 40% before finding a bottom.
Reversal alignment, step by step:
- An extended trend reaches a significant support or resistance zone, and a volume spike signals potential exhaustion
- RSI stops making new extremes and starts reverting toward 50
- Price holds a higher low (for a bottom) or lower high (for a top), and moves in the new direction show stronger volume than counter-moves
Airbnb (ABNB) demonstrated reversal alignment in August 2024. After a multi-month downtrend, price reached support near $113 with an exhaustion volume spike. RSI improved. Volume expanded on bullish sessions. Price formed a higher low and broke above $119, trading near $137 by October 2024.
Trades that look technically sound on price alone but lack volume support are lower-probability setups and should be sized more conservatively. The table below summarises the volume behaviour to look for in each scenario.
| Scenario | Ideal Volume Behaviour | RSI Context |
|---|---|---|
| Healthy uptrend | Rising on up days, easing on pullbacks | Above 50 and trending higher |
| Healthy downtrend | Rising on down days, lighter on bounces | Below 50 and trending lower |
| Breakout | Clear expansion above average (1.5-2x or more) | Crossing above 50 or accelerating |
| Potential top | Spike after extended advance, or rising price with falling volume | Overbought or showing bearish divergence |
| Potential bottom | Capitulation spike, then better volume on bounces | Oversold and beginning to improve |
| Consolidation | Gradually declining as range tightens; watch for surge on exit | Near 50, neutral |
| High-conviction setup | Price, RSI, and volume all point in the same direction | Confirming directional bias without divergence |
Volume is the habit that separates reactive traders from prepared ones
Every scenario covered in this guide, from trend health to breakouts to exhaustion spikes to contraction-expansion cycles, returns to the same hierarchy. Volume confirms or denies what price and RSI are suggesting. No single scenario is complete without it.
Three habits make volume analysis consistent rather than occasional:
- Keep a volume histogram and a 20-day volume moving average on every chart, without exception
- Before every entry, ask one question: does volume confirm, contradict, or say nothing about this trade idea?
- When volume is neutral or conflicting, treat it as a signal to reduce position size or wait for cleaner confirmation
Over time, consistent volume reading builds something that no single trade can provide: the ability to filter weak setups before they cost capital, confirm strong ones before they get away, and spot potential reversals before they become obvious to the broader market.
For traders wanting to apply noise-reduction principles beyond standard volume analysis, our comprehensive walkthrough of Renko chart strategy construction covers ATR-based brick sizing, five distinct construction methods, and backtested results across 23 years of S&P 500 data, including where this approach outperforms time-based charts and where its limitations become costly.
“Price tells you where it’s going. Volume tells you whether anyone else is coming with you.”
This article is for informational purposes only and should not be considered financial advice. Investors should conduct their own research and consult with financial professionals before making investment decisions.
—