Two of the sharpest equity selloffs in recent memory happened in the same year, for completely different reasons, and both of them punished investors who acted on the headlines rather than the probabilities.
The Liberation Day tariff shock of 2025 and the US-Iran conflict of early 2026 look nothing alike on the surface. One was a trade policy earthquake; the other was a geopolitical flashpoint with oil markets at the centre. But from the perspective of a retail investor watching a portfolio fall, both felt identical: urgent, credible, and like the beginning of something much worse. In both cases, that feeling was wrong in roughly the same way, and at roughly the same cost to those who acted on it.
Here is what the structural pattern beneath both crises reveals about how markets actually process fear, why the instinct to sell before things get worse is systematically self-defeating, and what you can do before the next sharp decline to make sure the decision is yours, not your anxiety’s.
Why market selloffs feel different from the inside
Fear-driven selloffs feel fundamentally different from ordinary volatility, and not because the numbers are bigger. The difference is the narrative. When markets drop on a tariff announcement or a military escalation, the story explaining the decline is vivid, credible, and escalating. Every headline confirms the direction of travel. Every data point reinforces the worst-case reading. That combination of plausibility and momentum is what makes the urge to sell feel rational rather than reactive.
How markets actually price a crisis
But markets do not price headlines. They price the probability of future states. When a crisis is at its most frightening, the worst-case scenario is already reflected in prices. What the market is waiting for is not resolution; it is a shift in the probability that the worst case will actually happen. That distinction, between how bad things feel and how bad they are likely to turn out, is the gap where panic selling does its damage.
The mechanism is straightforward. When the worst-case scenario feels plausible, you sell to avoid an outcome that is possible but not probable. The act of selling at that moment is the permanent damage, not the selloff itself.
Long-run equity return studies consistently show that a disproportionate share of total returns is concentrated in a small number of rebound days that cluster near market lows, precisely when the news still looks grim. Missing those days by sitting in cash can materially reduce long-term returns, even if you successfully avoid some of the downside.
Your instinct to wait for clarity before re-entering is structurally self-defeating, because the recovery does not wait for clarity either. It begins the moment the probability of catastrophe starts to recede, which is almost always before the crisis is visibly over.
When big ASX news breaks, our subscribers know first
Liberation Day 2025: how a trade shock became a sentiment overshoot
The sequence of events tells the story more honestly than any summary can.
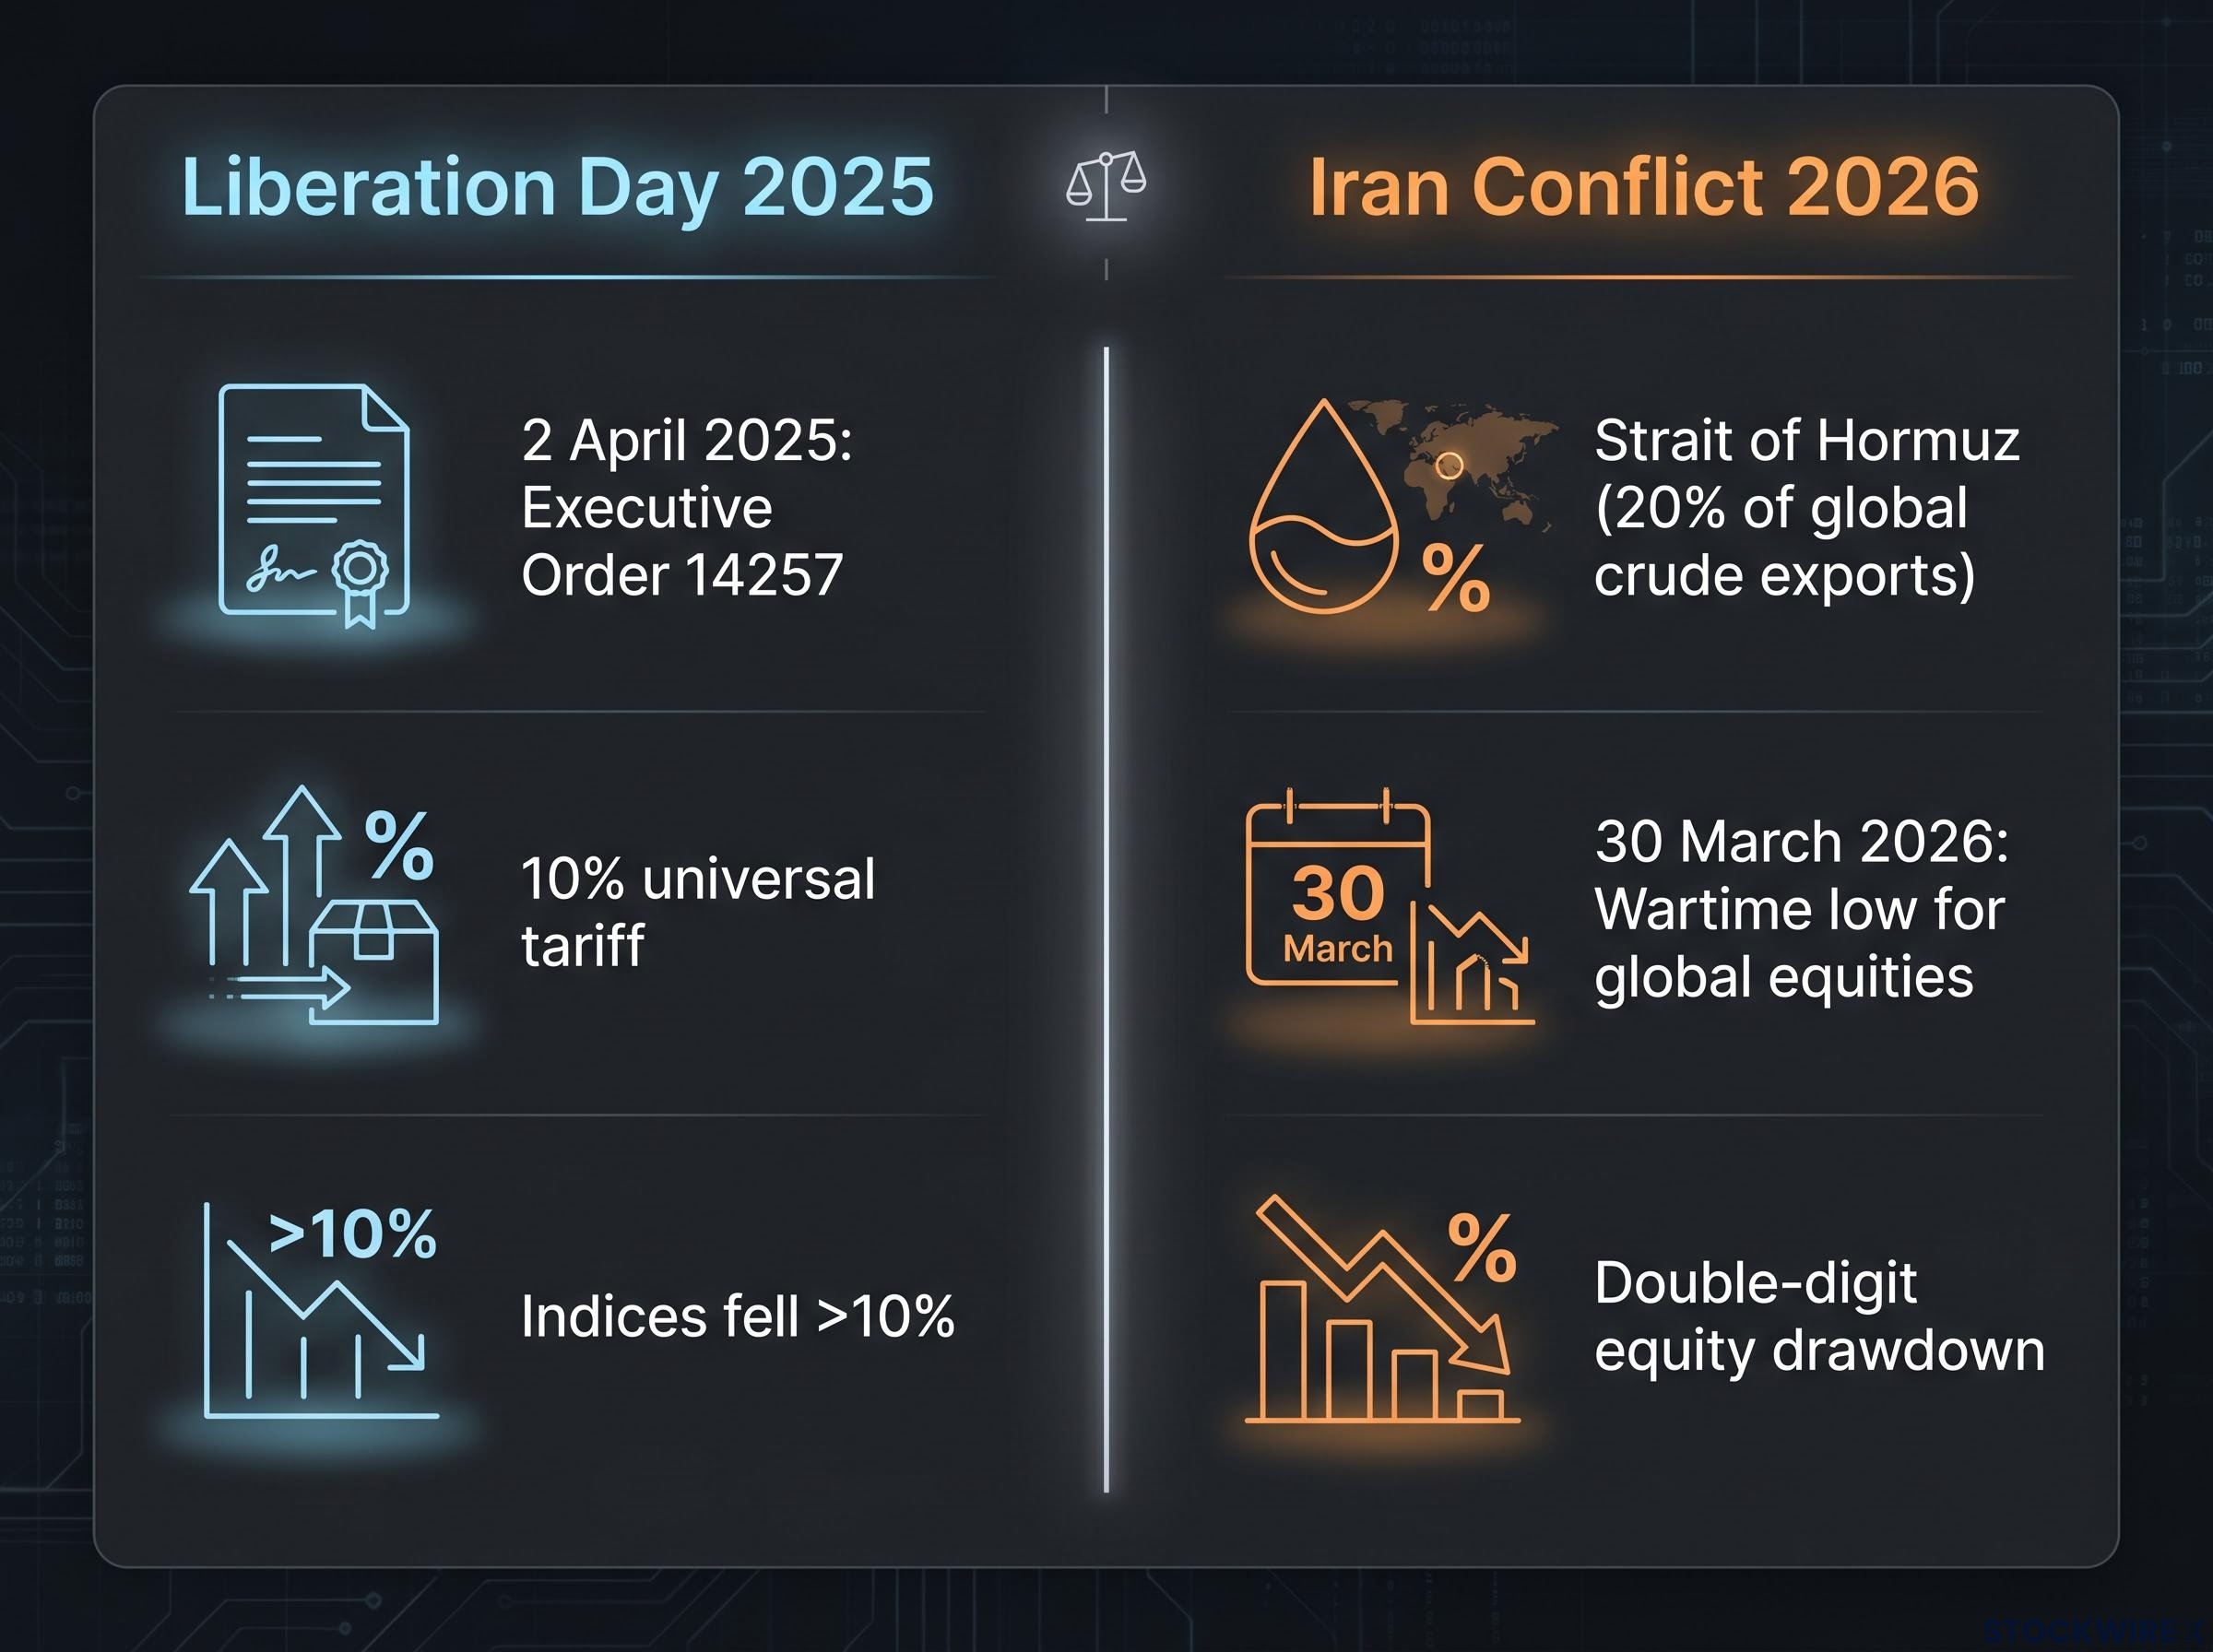
- 2 April 2025: President Trump proclaimed “Liberation Day” and signed Executive Order 14257, invoking emergency powers to impose sweeping tariffs on most US trading partners. A universal 10% tariff on nearly all imports took effect on 5 April, with reciprocal tariffs of up to 50% on dozens of countries scheduled for 9 April.
- Within days: Major indices fell more than 10%. The average effective US tariff rate was pushed to levels not seen since the early 20th century.
- Within roughly a week: The administration partially reversed course, pausing many of the scheduled increases and leaving a smaller across-the-board tariff plus sharply higher rates on China.
- Recovery onset: Equity markets began stabilising and recovering before conditions visibly improved or resolution appeared imminent.
What investors were pricing during the drop was a worst-case scenario: full-scale, sustained trade conflict causing material damage to global economic output. That scenario was possible. It was not, however, the base case. And the moment the probability of that extreme outcome began to recede, through even partial and conditional policy reversal, markets started to recover.
Markets turned before any resolution was in sight. It took only early indications that the most extreme escalation path was becoming less probable to set the rebound in motion.
The investor who sold after a 10% drop was not avoiding risk. They were locking in a loss at the precise moment the probability distribution was already beginning to shift. The crisis was still in the headlines. The fundamentals were still uncertain. But the market had already started the work of repricing, and it did not wait for permission.
The Iran conflict of 2026: the same pattern, different fear
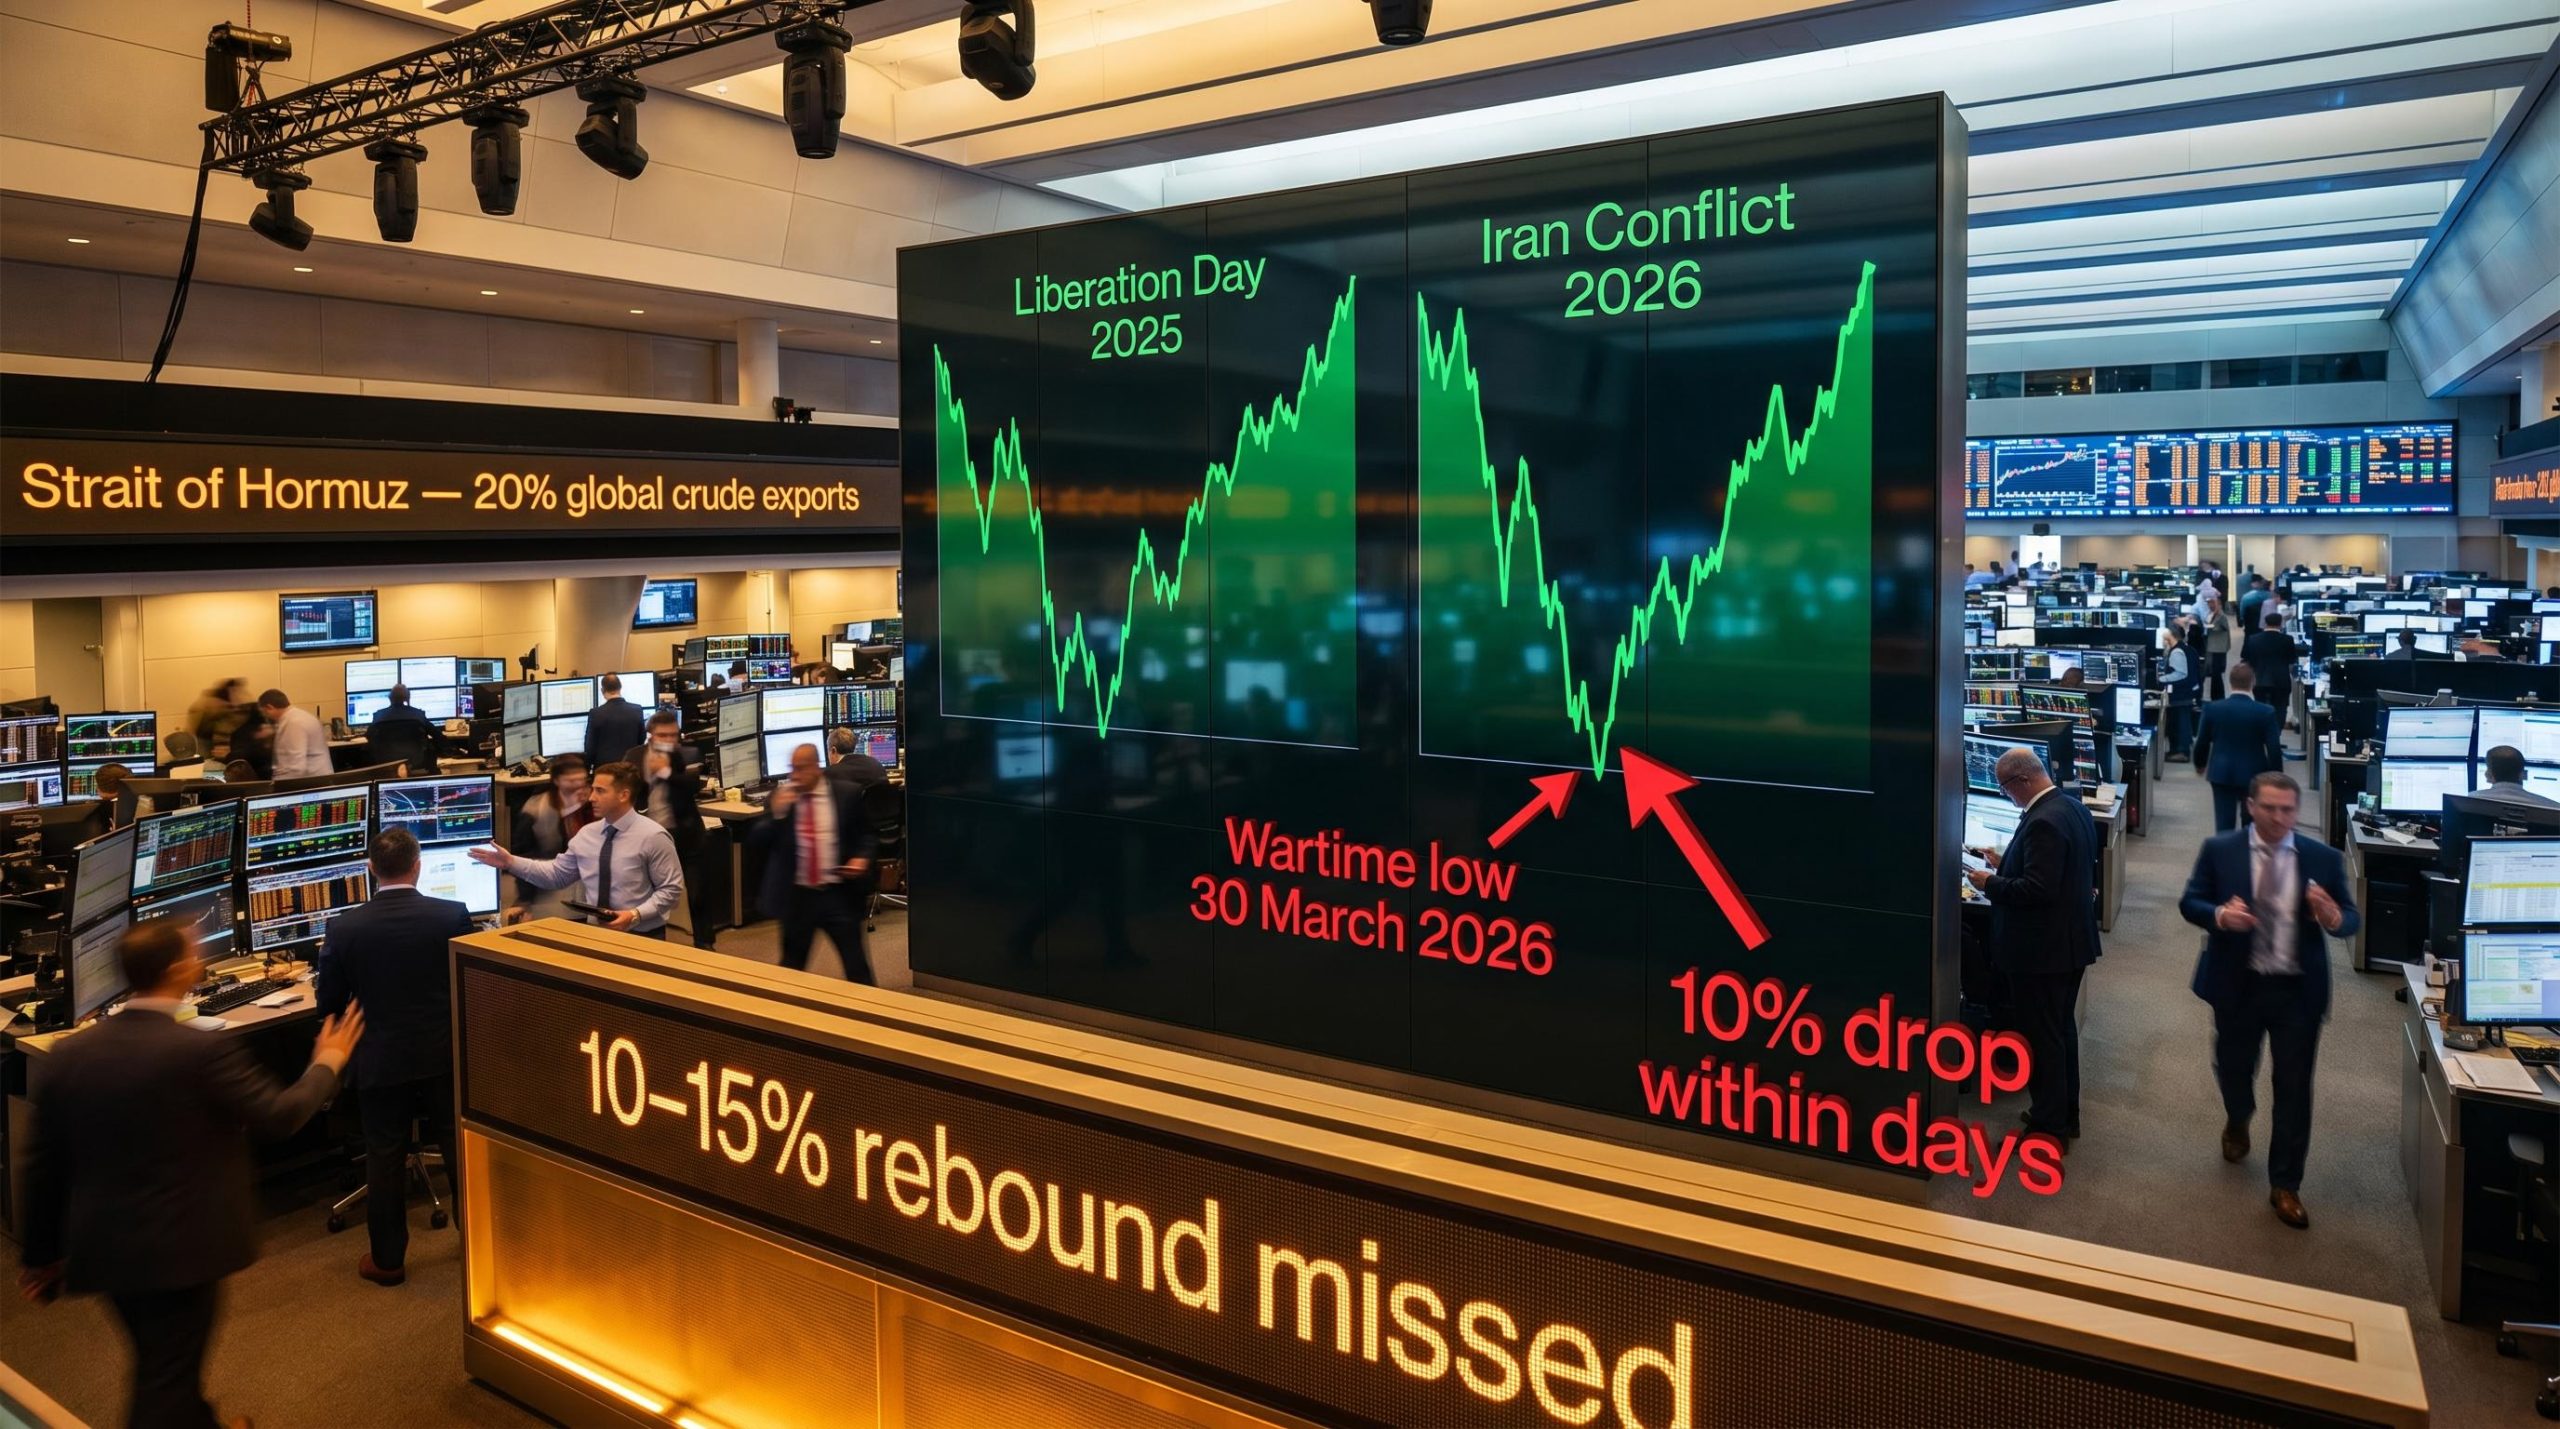
In early 2026, the US-Iran conflict brought a different kind of fear to markets. The Strait of Hormuz, which carries roughly 20% of global crude exports, became the focal point. Analysts highlighted scenarios of sustained supply disruption, energy rationing, surging inflation, and growth spillovers, particularly for energy-dependent economies. Risk assets sold off sharply while oil and related commodities spiked.
The wartime low for global equities was reached on 30 March 2026. From that point, share prices began climbing even as the conflict remained active and unresolved. Crude oil prices did not follow immediately, turning lower roughly a week after equities had already begun their recovery. As with the tariff shock, the turning point was not a formal resolution but rather early indications that both sides had appetite for a negotiated end to hostilities, reducing the perceived likelihood of a prolonged and catastrophic supply interruption.
The parallels with Liberation Day are difficult to ignore:
- Both episodes triggered an initial selloff as investors priced in severe worst-case outcomes across global markets
- Both saw equity prices begin recovering well ahead of any formal resolution to the underlying crisis
- Both were confirmed in hindsight as sentiment-driven overshoots rather than structural repricing events
| Feature | Liberation Day 2025 | Iran Conflict 2026 |
|---|---|---|
| Trigger | Executive Order 14257; sweeping tariffs | US-Iran military escalation; Strait of Hormuz risk |
| Peak decline character | Leading indices fell sharply, with losses exceeding 10% in a matter of days | Sharp, double-digit equity drawdown; oil spike |
| Recovery timing | Began within roughly a week of announcement | Equity prices turned higher from late March 2026; oil prices followed approximately one week afterwards |
| Resolution status at recovery onset | Partial policy reversal only; China tariffs remained elevated | Conflict unresolved; signals of openness to ending hostilities |
Why European markets reacted harder, and what that reveals
European equities saw sharper swings than their US counterparts during the Iran conflict, with the additional anxiety rooted in memories of the energy crisis that followed Russia’s invasion of Ukraine in 2022. Rather than assessing the current situation on its own terms, many investors in the region appeared to be re-fighting the previous war, treating the Hormuz disruption as a replay of the gas shortage fears that gripped Europe four years earlier. In practice, however, the supply picture in 2026 was considerably more robust: storage levels were healthier, alternative supply routes had been developed, and European natural gas prices as of July 2026 were nowhere near the extreme peaks recorded in 2022. The additional volatility in European markets therefore reflected a heavier burden of investor anxiety rather than any genuine deterioration in energy fundamentals, and recognising that distinction is important when assessing what regional market moves are actually telling you during a global shock.
What both crashes have in common: the anatomy of a sentiment-driven overshoot
Strip away the specific triggers and a three-stage pattern emerges:
- Fear-driven drop: Worst-case scenarios are priced in aggressively. Investors sell to avoid an outcome that feels imminent and plausible.
- Early recovery: The probability of the worst case begins to recede, not because the crisis is resolved, but because modest evidence accumulates that the extreme tail is unlikely. Markets respond to the shift in probabilities, not to resolution.
- Hindsight confirmation: With time, it becomes clear that the initial selloff overshot what fundamentals ultimately warranted. The crisis was real; the market reaction exceeded it.
What moves markets is a change in the range of probable outcomes, not the arrival of a clear answer. Prices reprice when the distribution shifts, and that shift can occur long before anyone can declare the crisis over.
Both the Liberation Day episode and the 2026 Iran conflict followed this pattern. Both were confirmed as sentiment-driven overshoots rather than structural repricing events.
But here is the part that matters most for your decision-making: a structural shock, one that permanently impairs earnings or justifies lasting repricing, follows the same first stage. In real time, during the selloff, both types of event feel identical. You cannot reliably tell the difference in the moment. That uncertainty is not a reason to panic sell; it is precisely the reason a pre-committed investment plan outperforms a reactive one.
The real cost of selling into the panic
The cost of panic selling is not abstract. In both the tariff and Iran conflict episodes, an investor who sold near the lows and attempted to re-enter after a 10-15% rebound would have missed a significant portion of the recovery. That cost is consistent with long-run equity return studies showing that the days which do the most recovery work cluster near market lows, exactly when the news environment makes re-entry feel most dangerous.
Research into sell-decision biases, including loss aversion, recency bias, the disposition effect, and herd behaviour, shows that these four forces concentrate specifically at the exit point, where a University of Chicago study found that randomly selected sell decisions outperformed professional portfolio managers by up to 150 basis points annually.
The asymmetry of the timing problem is what makes panic selling so costly: getting out feels like a single decision, but getting back in requires a second decision under conditions of even greater uncertainty. Most investors get both decisions wrong in the same direction.
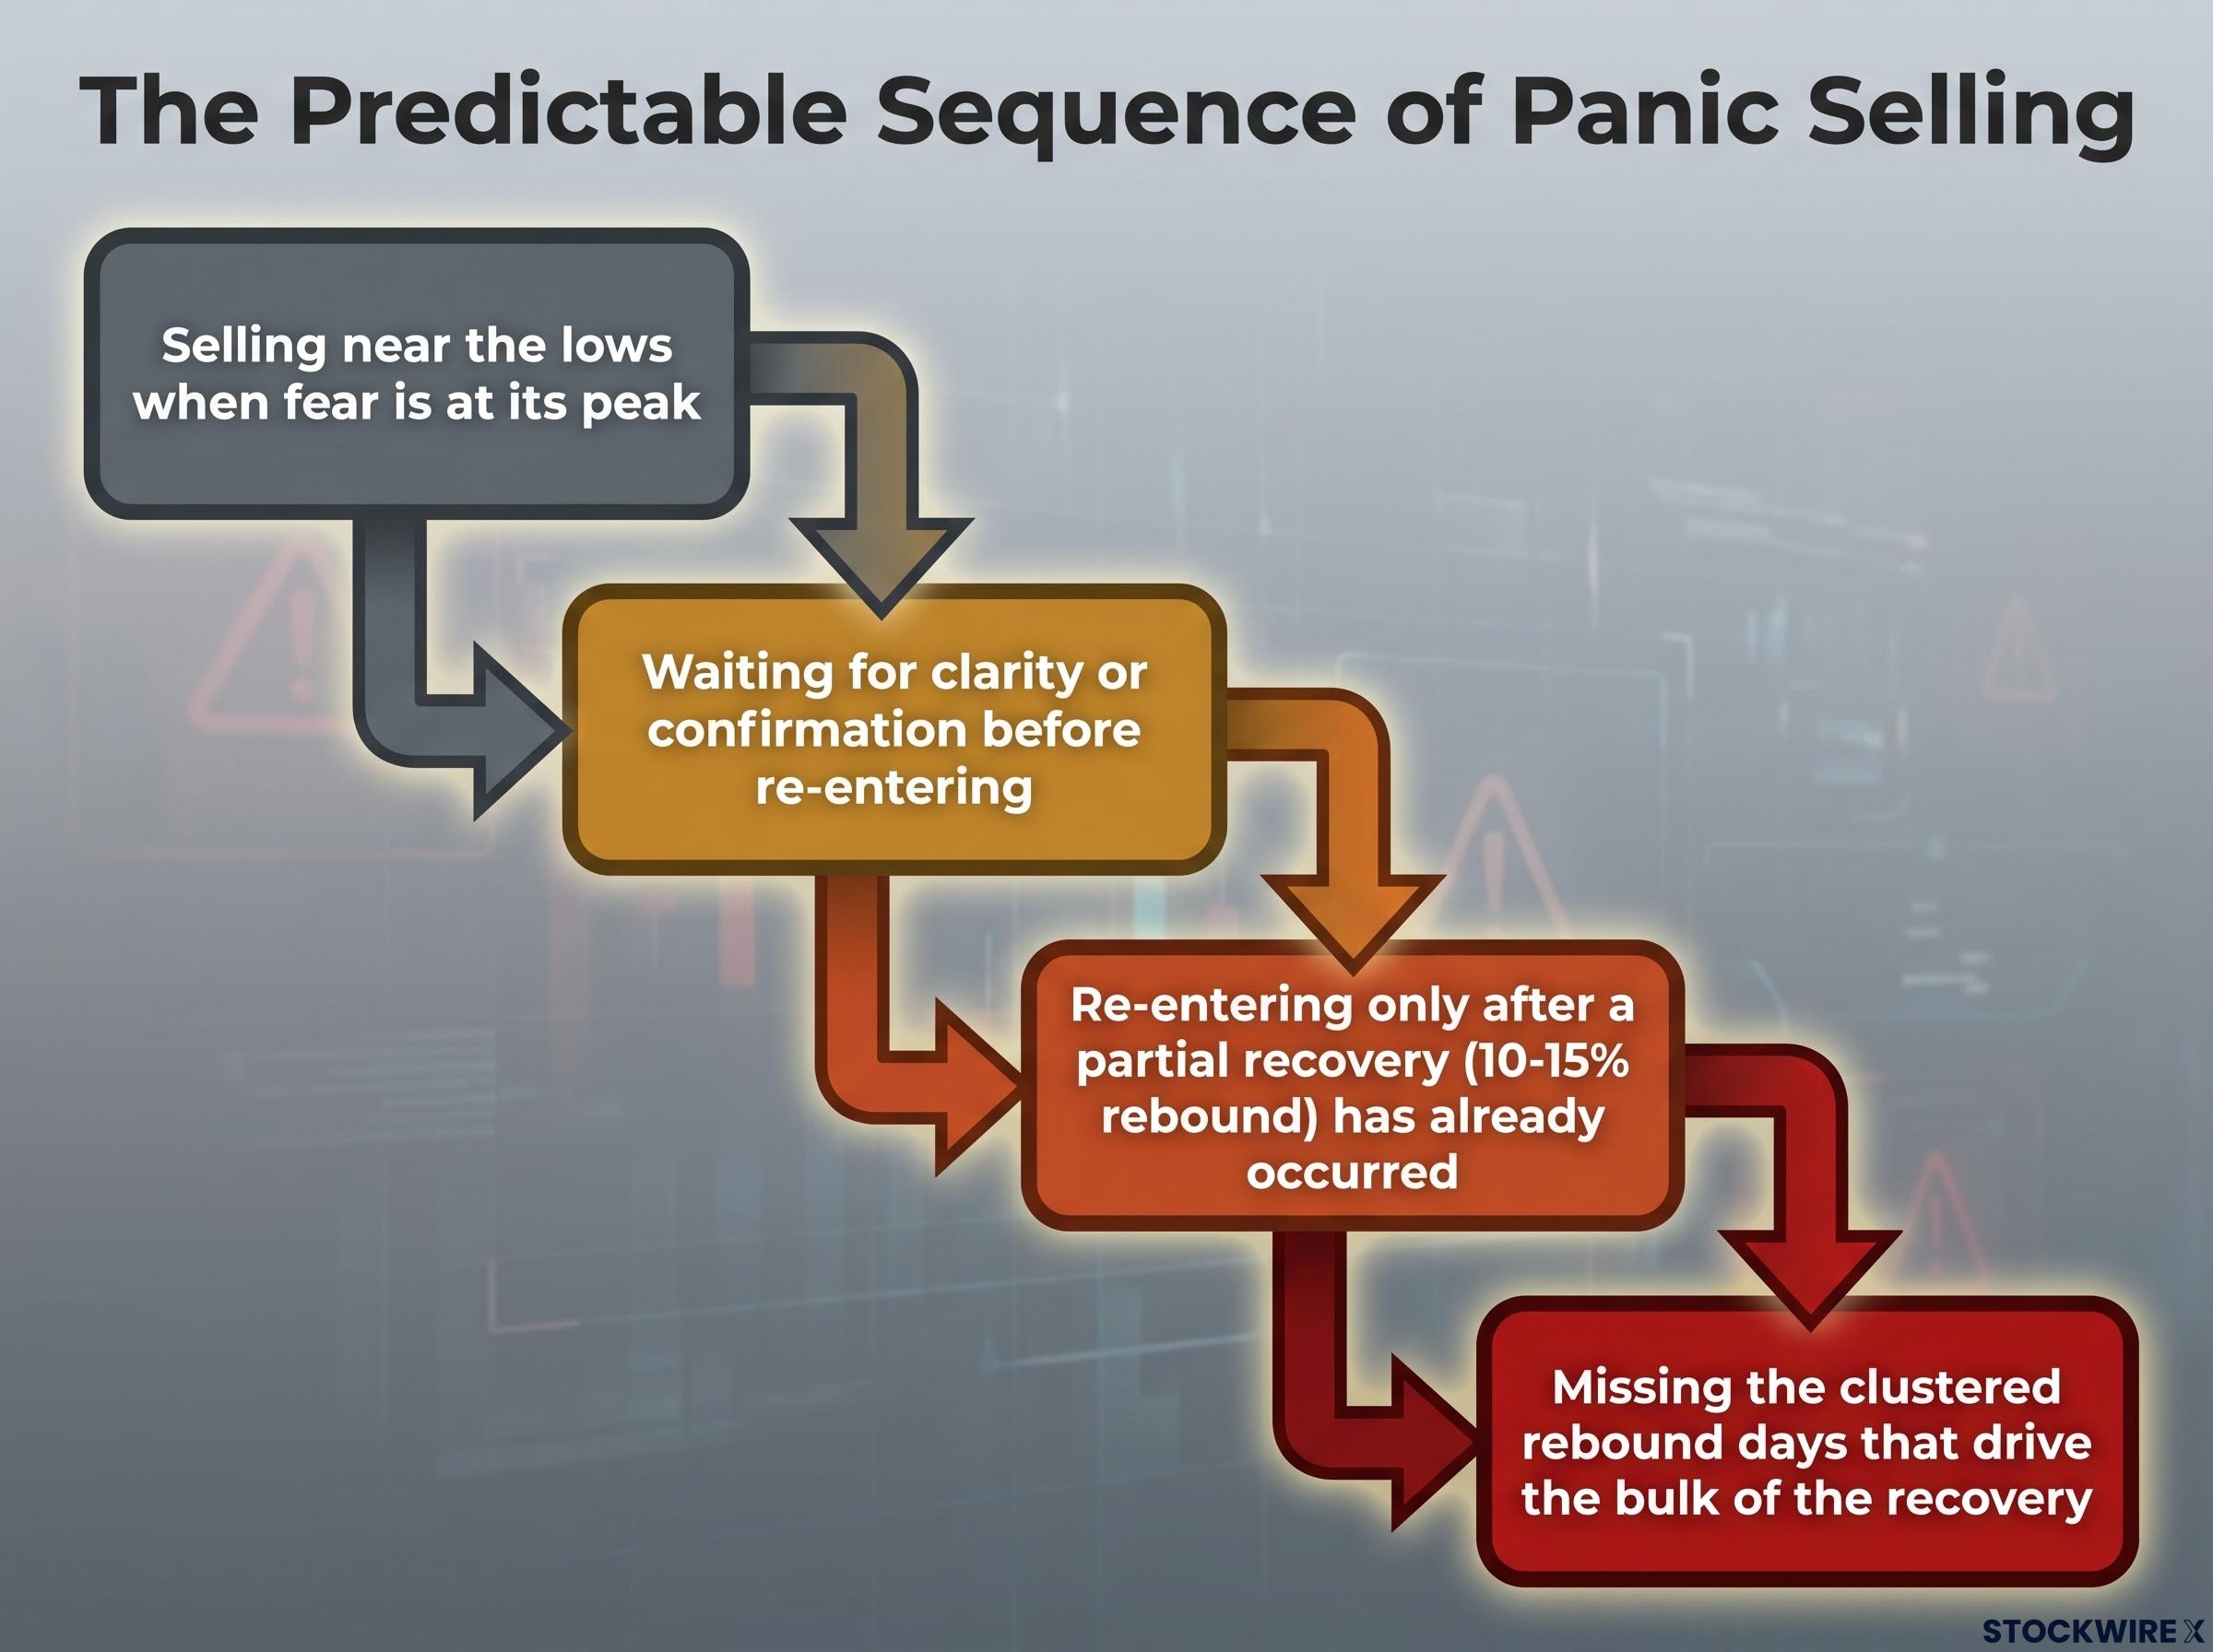
The behaviours that compound the cost follow a predictable sequence:
- Selling near the lows when fear is at its peak
- Waiting for “clarity” or “confirmation” before re-entering
- Re-entering only after a partial recovery has already occurred
- Missing the clustered rebound days that drive the bulk of the recovery
Major wealth managers and financial planners explicitly warn against emotionally driven, short-term market timing for this reason, and emphasise pre-committed plans aligned to your risk tolerance. The evidence from both 2025 and 2026 reinforces why: panic selling is not a single bad decision. It is a decision that creates a second, harder decision under conditions that make correct timing even less likely.
What the pattern cannot tell you, and why that matters anyway
Not every crisis resolves without permanent damage. Some shocks do permanently impair earnings, justify lasting repricing, or signal genuine structural change. The three-stage pattern described above applied to the Liberation Day tariff episode and the 2026 Iran conflict, but it would not have applied to, say, a financial crisis where bank solvency was genuinely at risk and credit markets froze.
The distinction between a sentiment overshoot and a structural repricing event is only reliably confirmable in hindsight. In real time, both felt like potentially structural breaks. That uncertainty is precisely what makes staying invested psychologically difficult, and it is exactly why the framework’s value lies not in predicting outcomes but in resisting the impulse to act on peak fear.
During a selloff, you can ask yourself a few questions to test whether the shock has structural characteristics:
- Are corporate earnings revisions accelerating in a direction that suggests permanent impairment, or are they reflecting temporary disruption?
- Is credit deteriorating, meaning are borrowing costs spiking and lending freezing, or is stress confined to equity sentiment?
- Is there evidence of policy dysfunction that prevents any corrective response, or are policymakers signalling flexibility?
- Does the underlying economic data support the severity of the market move, or is the gap between sentiment and fundamentals widening?
These questions will not give you certainty. Nothing will. But a pre-committed investment plan, calibrated to your actual risk tolerance and time horizon before a crisis begins, is the structural solution to the real-time ambiguity that makes both types of event feel the same while they are happening.
For investors who want a repeatable framework for distinguishing sentiment overshoots from genuine structural breaks in real time, our dedicated guide to classifying any stock market selloff walks through the three-category test, covering how to assess whether revenues, competitive moats, and ROIC trends support or contradict the severity of the market move.
Staying invested is not passive; it is the harder decision
Investors who stayed invested through both the 2025 tariff shock and the 2026 Iran conflict were better positioned at recovery than those who sold. This is consistent with long-run evidence that staying invested outperforms reactive market timing in sentiment-driven crises.
That framing can sound easy in retrospect. It was not. Both episodes felt, in the moment, like situations that justified urgent action. The tariff shock looked like the start of a global trade war. The Iran conflict looked like an oil supply crisis that could tip the world into recession. Staying invested required active resistance to that impulse, not passivity.
The practical implication is specific: review your risk tolerance and investment plan when markets are calm, not when they are falling. That is the only moment when the decision is not distorted by fear. Your future self will be better served by a plan made today than by a decision made during the next sharp decline, and that is not generic advice. It is the direct lesson of both crises examined here.
Building the behavioral architecture to stay invested through a 20-30% drawdown is not a matter of willpower; it relies on structural mechanisms such as automated contributions, a maximum account-checking rule, and a written selling policy agreed to while markets are calm.
This article is for informational purposes only and should not be considered financial advice. Investors should conduct their own research and consult with financial professionals before making investment decisions. Past performance does not guarantee future results.