How to Invest Through Geopolitical Risk Without Reactive Trades
7 hrs ago

Asian equity markets host several of the world’s largest semiconductor manufacturers, digital platforms, and consumer technology companies. Yet these markets remain structurally underrepresented in the average Australian superannuation or brokerage portfolio. For Australian retail investors, the barrier has historically been operational: accessing foreign exchanges requires offshore brokerage accounts, currency conversion infrastructure, and familiarity with markets operating in different regulatory environments and time zones. ASX-listed ETFs remove most of that friction. This guide compares three ASX-listed Asian ETFs, ASIA, IAA, and VAE, across cost, concentration, and risk profile, and provides a framework for identifying which option aligns with a given investor’s objectives.
The ASX is heavily weighted toward financials and resources. That composition serves Australian investors well in certain cycles, but it leaves a structural gap: limited organic exposure to the technology and high-growth consumer sectors that dominate Asia’s largest economies.
ASX domestic ETF concentration in financials and materials is even more pronounced than the headline index weights suggest: VAS, A200, and IOZ all assign more than 50% of their portfolios to those two sectors, making the structural gap in technology and consumer exposure a recurring constraint for investors building from an Australian equities base.
The scale of that gap is worth quantifying. Asia accounts for a substantial share of global GDP growth, and its technology sector includes companies at the centre of global AI infrastructure supply chains. China, Taiwan, and South Korea together produce the semiconductors underpinning AI development worldwide, making these markets structurally relevant even for investors not seeking pure emerging-market exposure.
The IMF Regional Economic Outlook for Asia and Pacific, published in April 2026, projects continued GDP growth leadership for the region and identifies technology exports and semiconductor supply chain integration as key structural drivers, reinforcing the case for deliberate exposure to Asian markets within a diversified Australian portfolio.
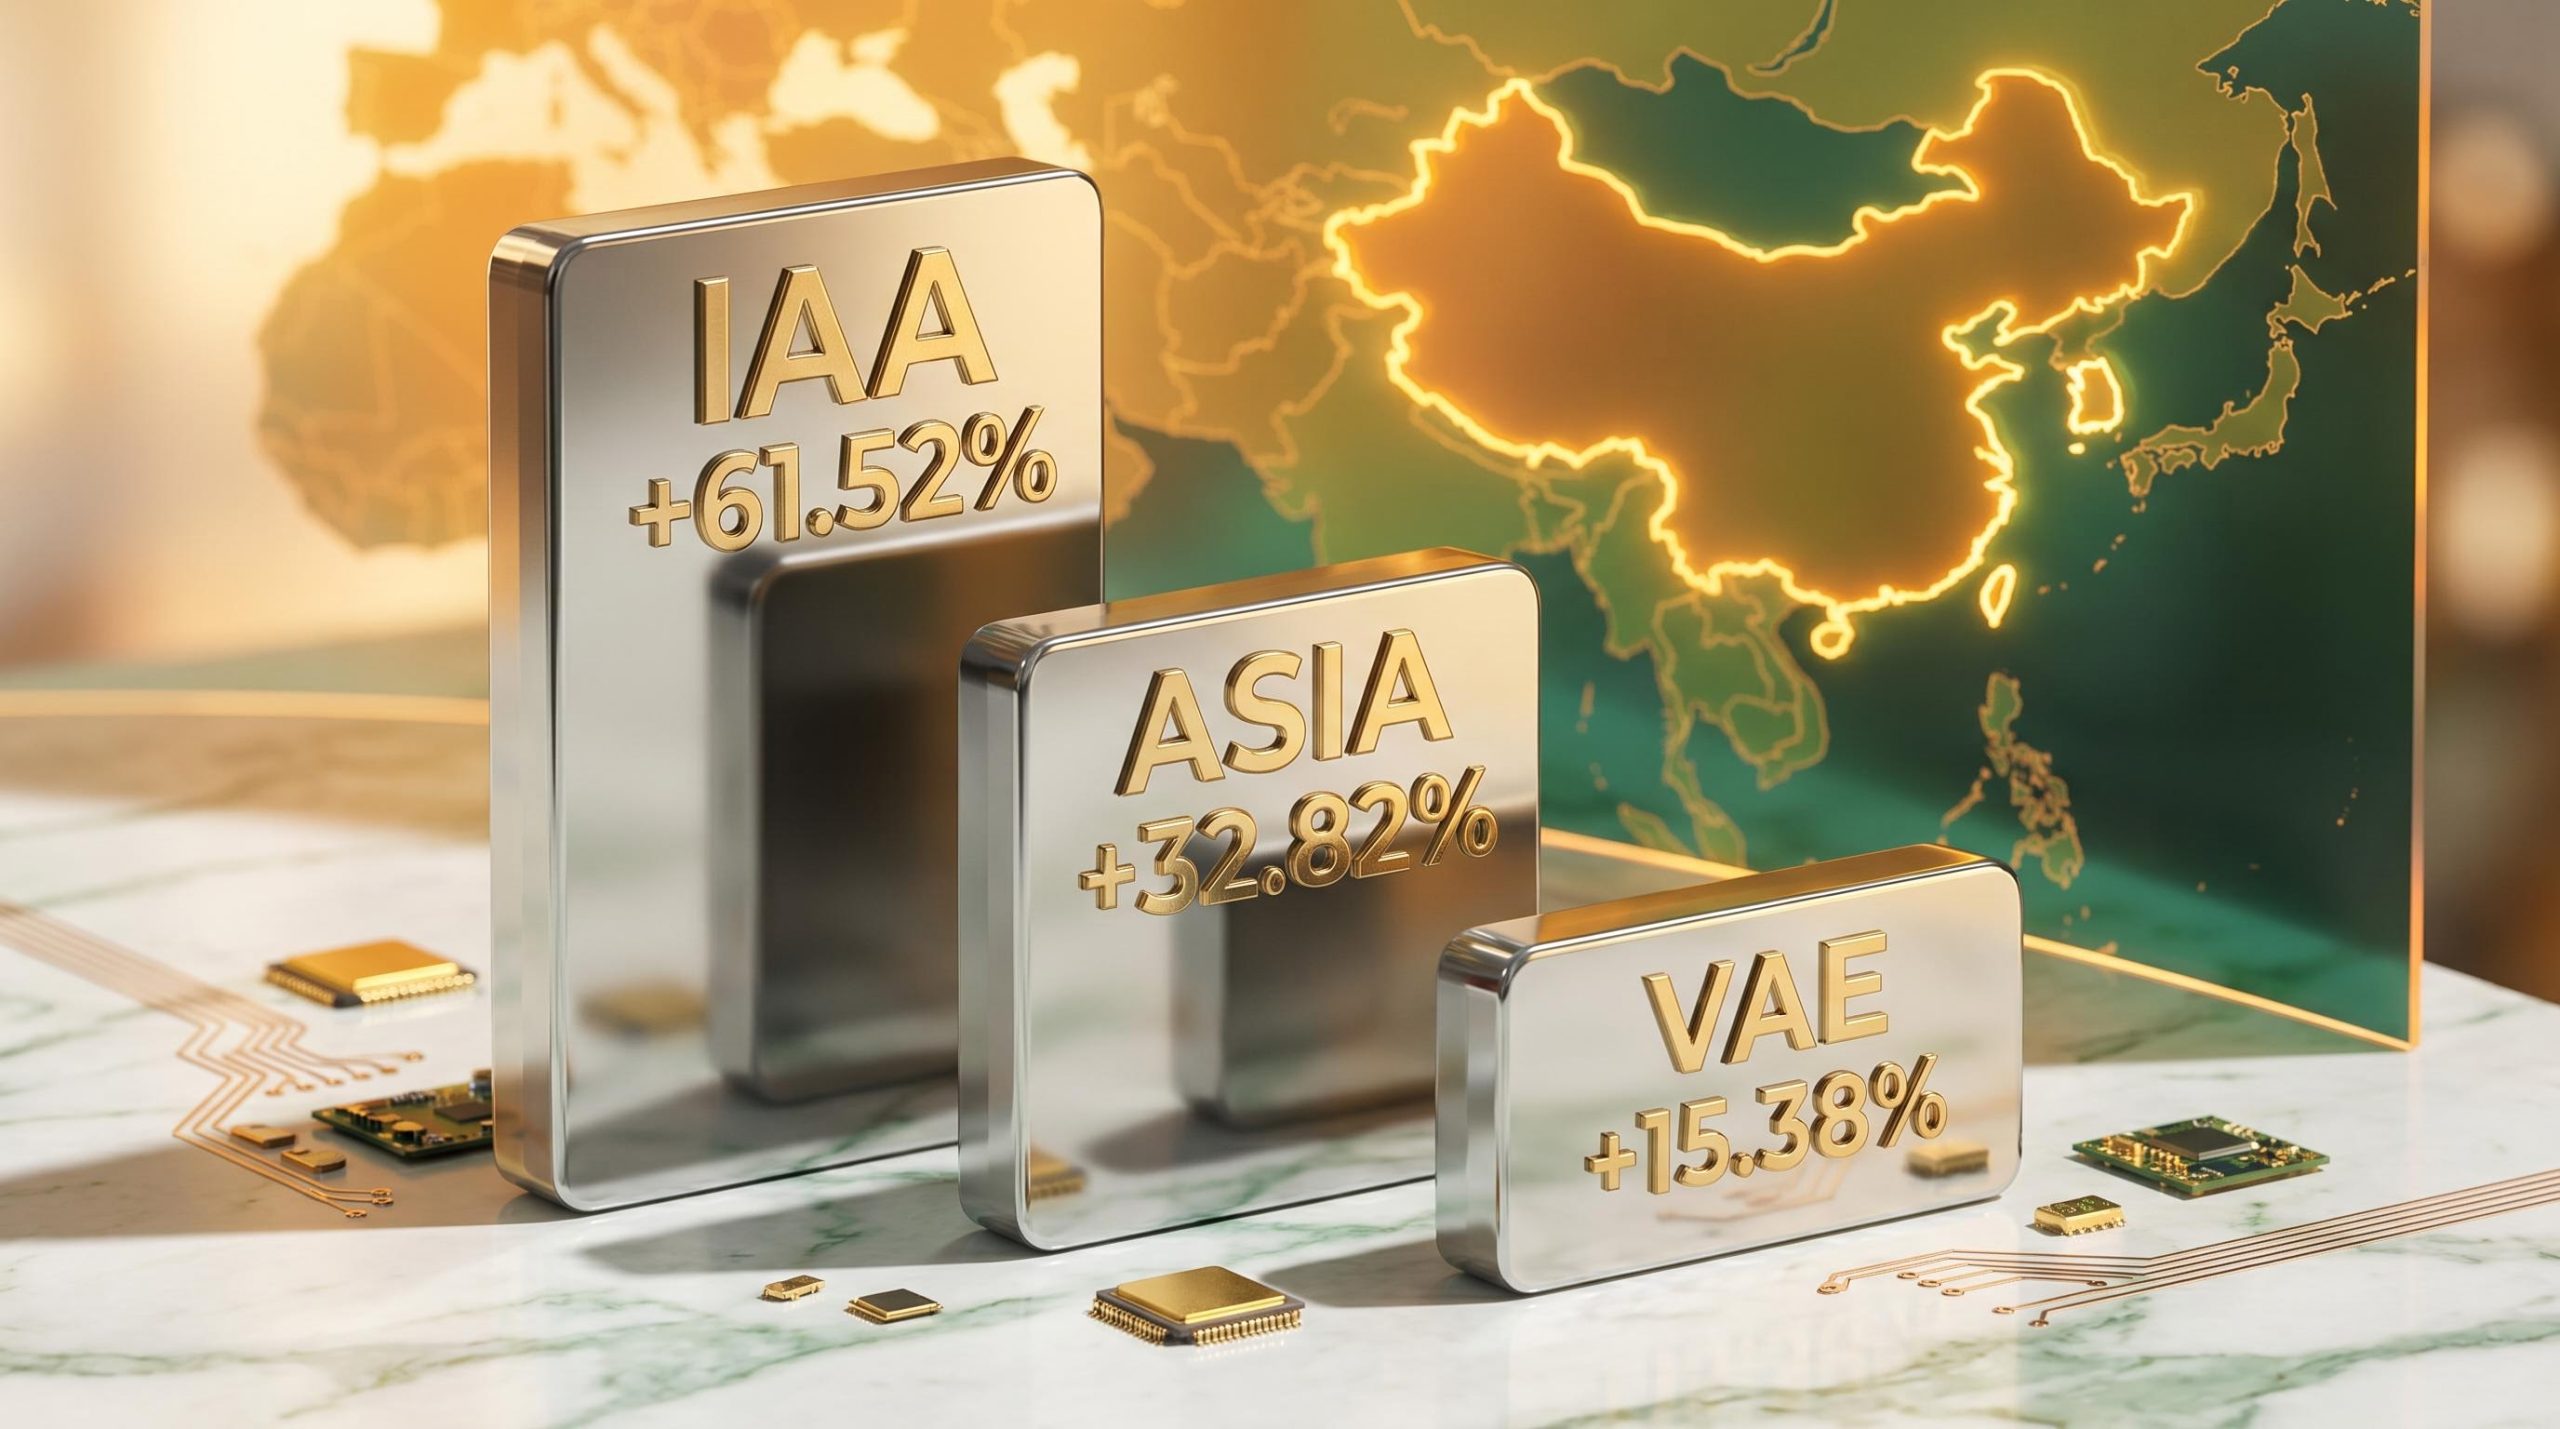
Recent performance reflects that relevance. ASIA returned 32.82% over one year to 30 April 2026, while IAA returned 34.11% over the same period. For broader context, the MSCI All Country Asia ex-Japan index returned 16.80% over one year to mid-2025.
Three structural reasons support deliberate Asian market allocation:
Without deliberate allocation, Australian portfolios risk being underweight in the sectors shaping the next decade of global growth.
The mechanics start with something familiar. An investor places a buy order on the ASX, just as they would for any Australian-listed share. The difference is what sits behind that order.
An ASX-listed ETF tracking an Asian index holds the underlying foreign securities directly or through a fund structure. The ETF unit itself trades in Australian dollars during ASX market hours. The ETF provider constructs a portfolio designed to replicate a defined index and rebalances periodically to maintain alignment with that benchmark.
ETF mechanics for Australian investors involve a unit trust structure that holds underlying securities through an independent custodian, which means the investor’s capital sits outside the fund manager’s balance sheet even while the ETF units themselves trade on the ASX like ordinary shares.
Here is how the three-step process works in practice:
Currency exposure is embedded. Even though investors transact in AUD, underlying exposure to the TWD, KRW, CNY, HKD, and SGD affects real returns. A rising Australian dollar can erode gains even when Asian equity prices increase.
The three primary ASX-listed options in this category are ASIA (BetaShares), with funds under management of approximately $1.18 billion; IAA (iShares/BlackRock), at approximately $1.43 billion; and VAE (Vanguard), whose FUM and MER should be confirmed via Vanguard Australia’s official ETF page. Those FUM figures, as of 30 April 2026, serve as a proxy for scale and market acceptance among Australian investors.
The following table presents the three funds across the dimensions most relevant to product selection.
| ETF Ticker | Fund Manager | MER | FUM (approx.) | Index Tracked |
|---|---|---|---|---|
| ASIA | BetaShares | 0.67% p.a. | $1.18 billion | Solactive Asia ex-Japan Technology & Internet Tigers Index |
| IAA | BlackRock / iShares | 0.29% p.a. | $1.43 billion | 50 largest companies across China, HK, South Korea, Singapore, Taiwan |
| VAE | Vanguard | Not confirmed | Not confirmed | FTSE Asia ex-Japan Index |
VAE’s MER and FUM data should be verified directly via Vanguard Australia’s official ETF page before making any allocation decision.
IAA’s lower MER of 0.29% reflects its broader, less thematically constructed index. ASIA’s higher MER of 0.67% corresponds to a more concentrated, technology-focused mandate. The 0.38 percentage point difference between them represents meaningful cost drag over a decade-long holding period when compounding is taken into account.
That said, a higher MER is not inherently a disadvantage if the investor specifically wants thematic technology exposure unavailable from a cheaper broad-market fund.
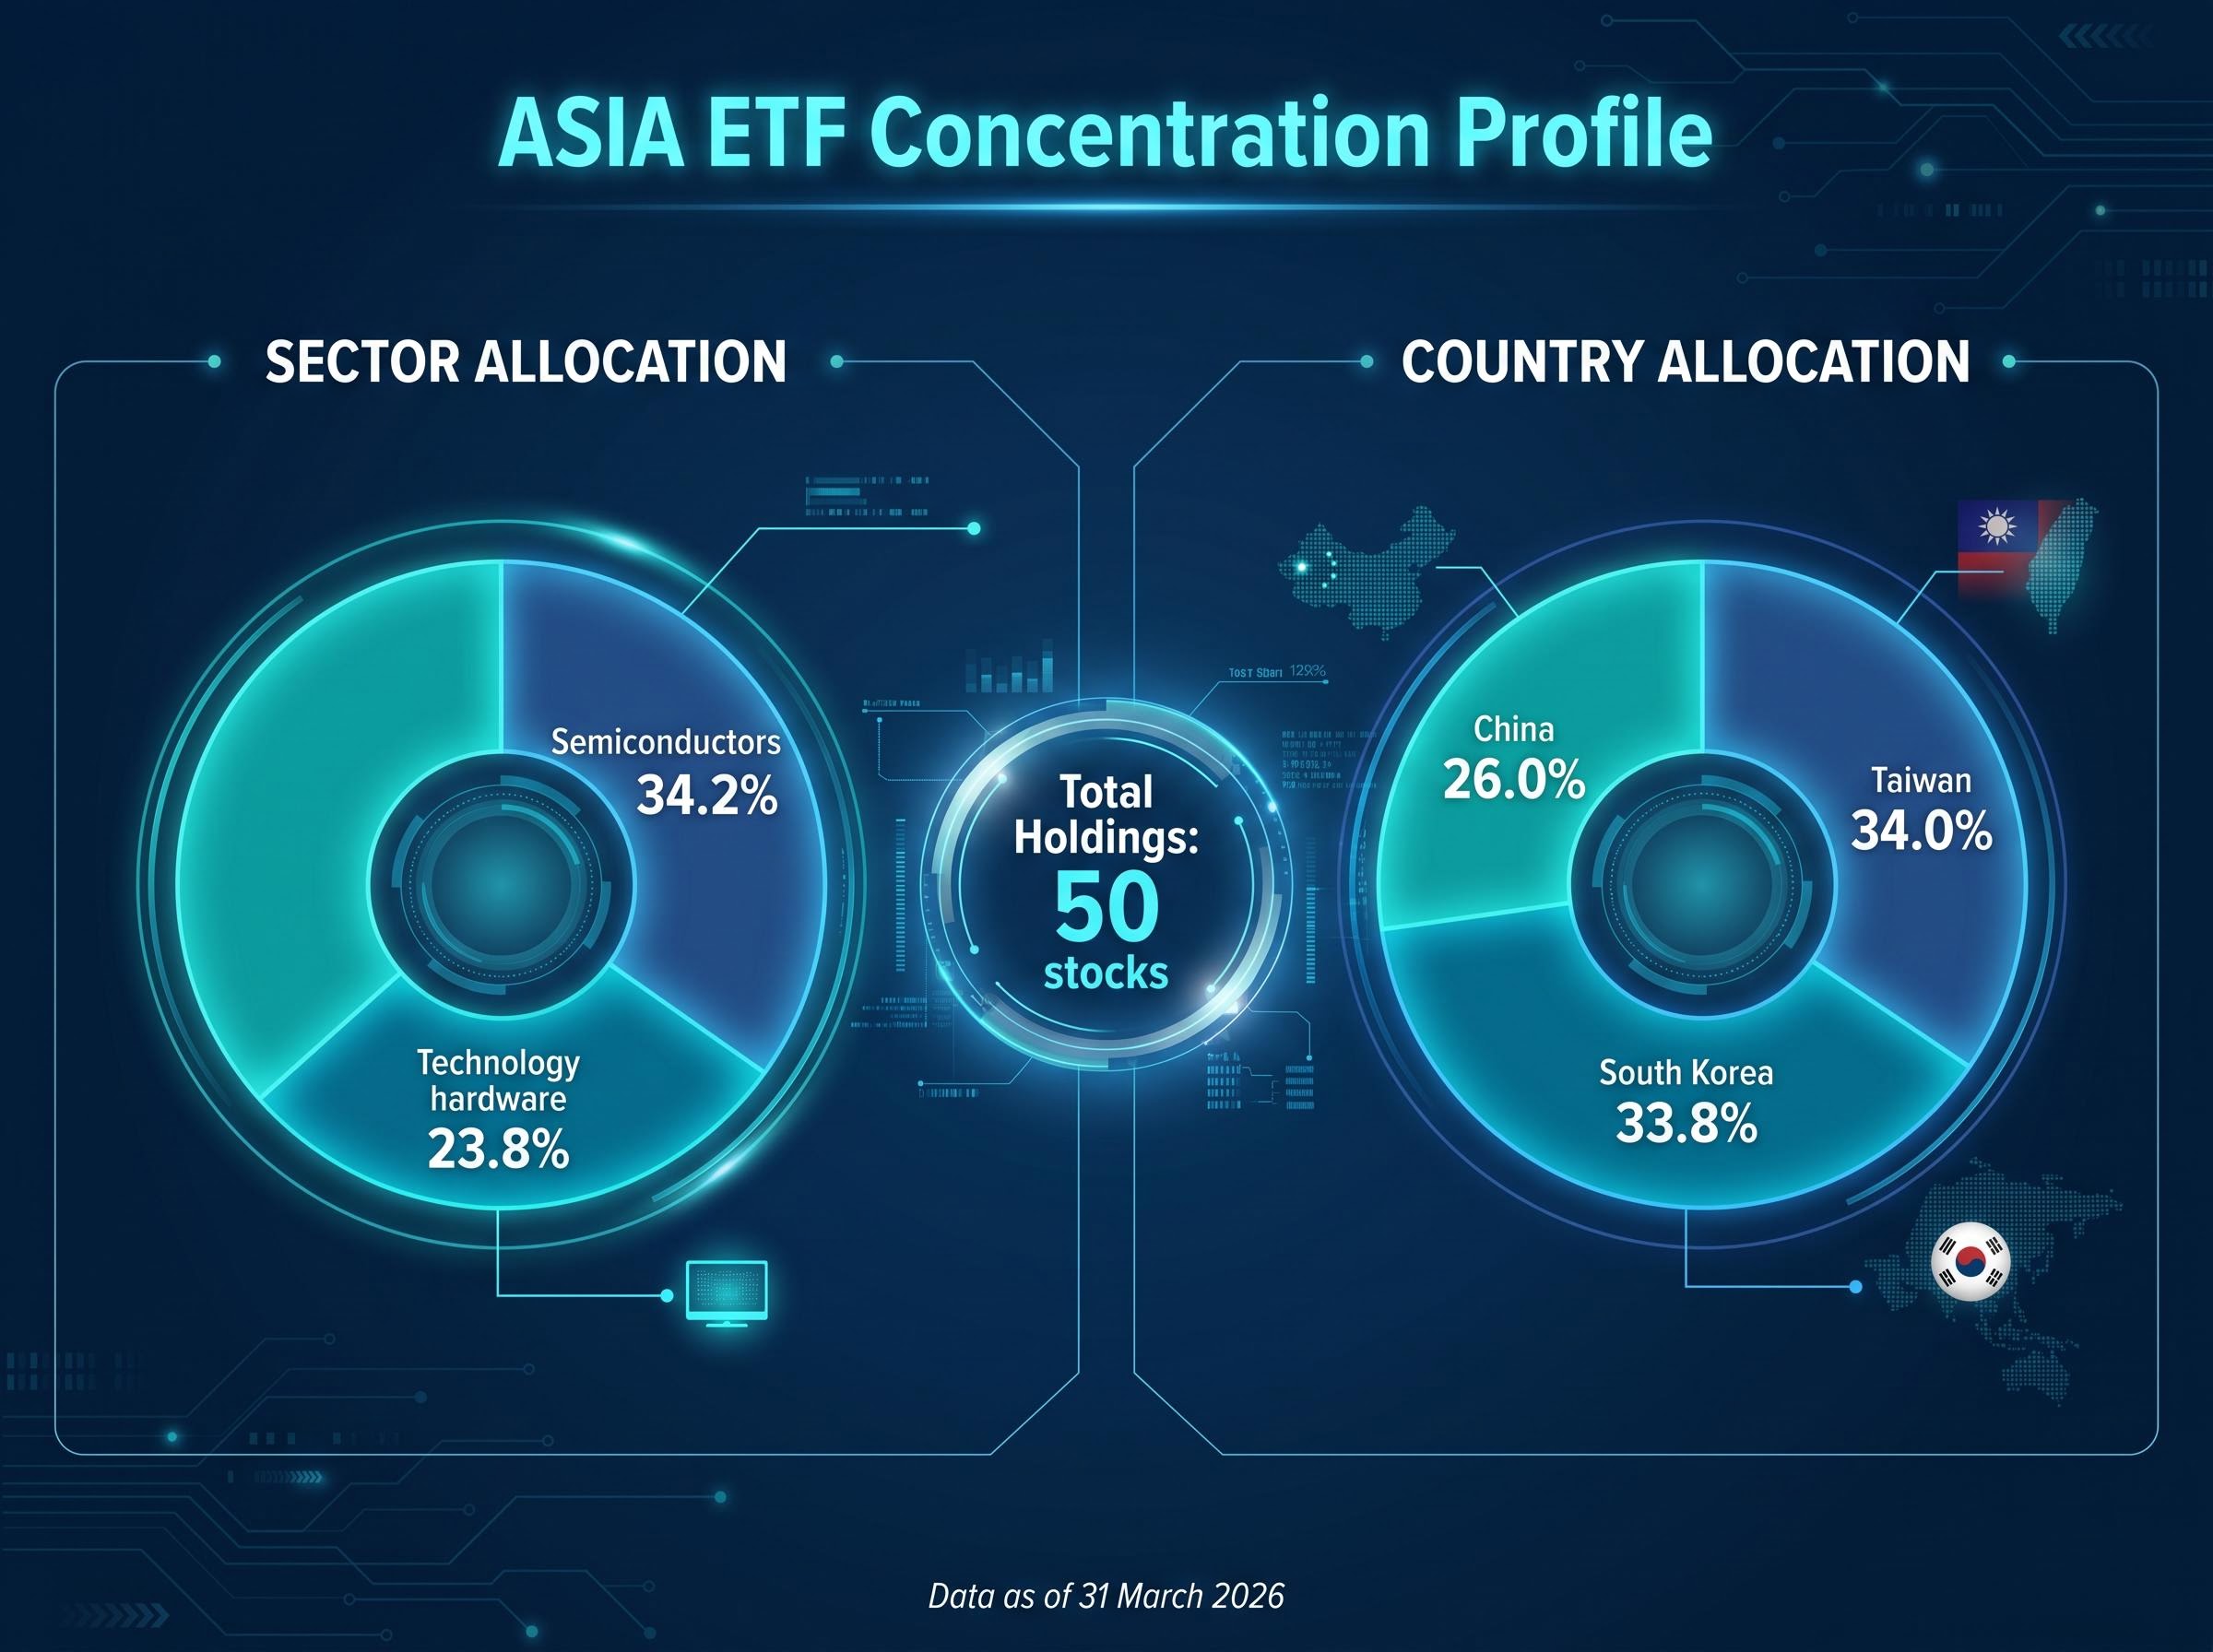
ASIA’s sector concentration tells the story. Semiconductors account for 34.2% of the fund’s allocation, with technology hardware at 23.8% (as of 31 March 2026). Its country allocations, Taiwan at 34.0%, South Korea at 33.8%, and China at 26.0%, reinforce that this is a concentrated bet on Asia’s technology supply chain. IAA covers 50 companies across five markets with broader sector representation, offering a different risk and return profile.
The distinction matters: for some investors, ASIA’s concentration is the entire point. For others, it is a risk they may be inadvertently accepting without realising the degree of sector overlap.
Strong annual returns and sharp monthly drawdowns can coexist in the same fund, and both ASIA and IAA demonstrate that reality clearly.
| Timeframe | ASIA | IAA |
|---|---|---|
| 1 month | -14.17% | -11.48% |
| 1 year | 32.82% | 34.11% |
| 3 year (p.a. / cumulative) | 24.08% p.a. | 74.05% cumulative |
All performance data as of 30 April 2026. Additional IAA figures include a 2025 calendar year return of 37.53% and a YTD 2026 return of 1.06%. ASIA’s since-inception return stands at 13.55% per annum.
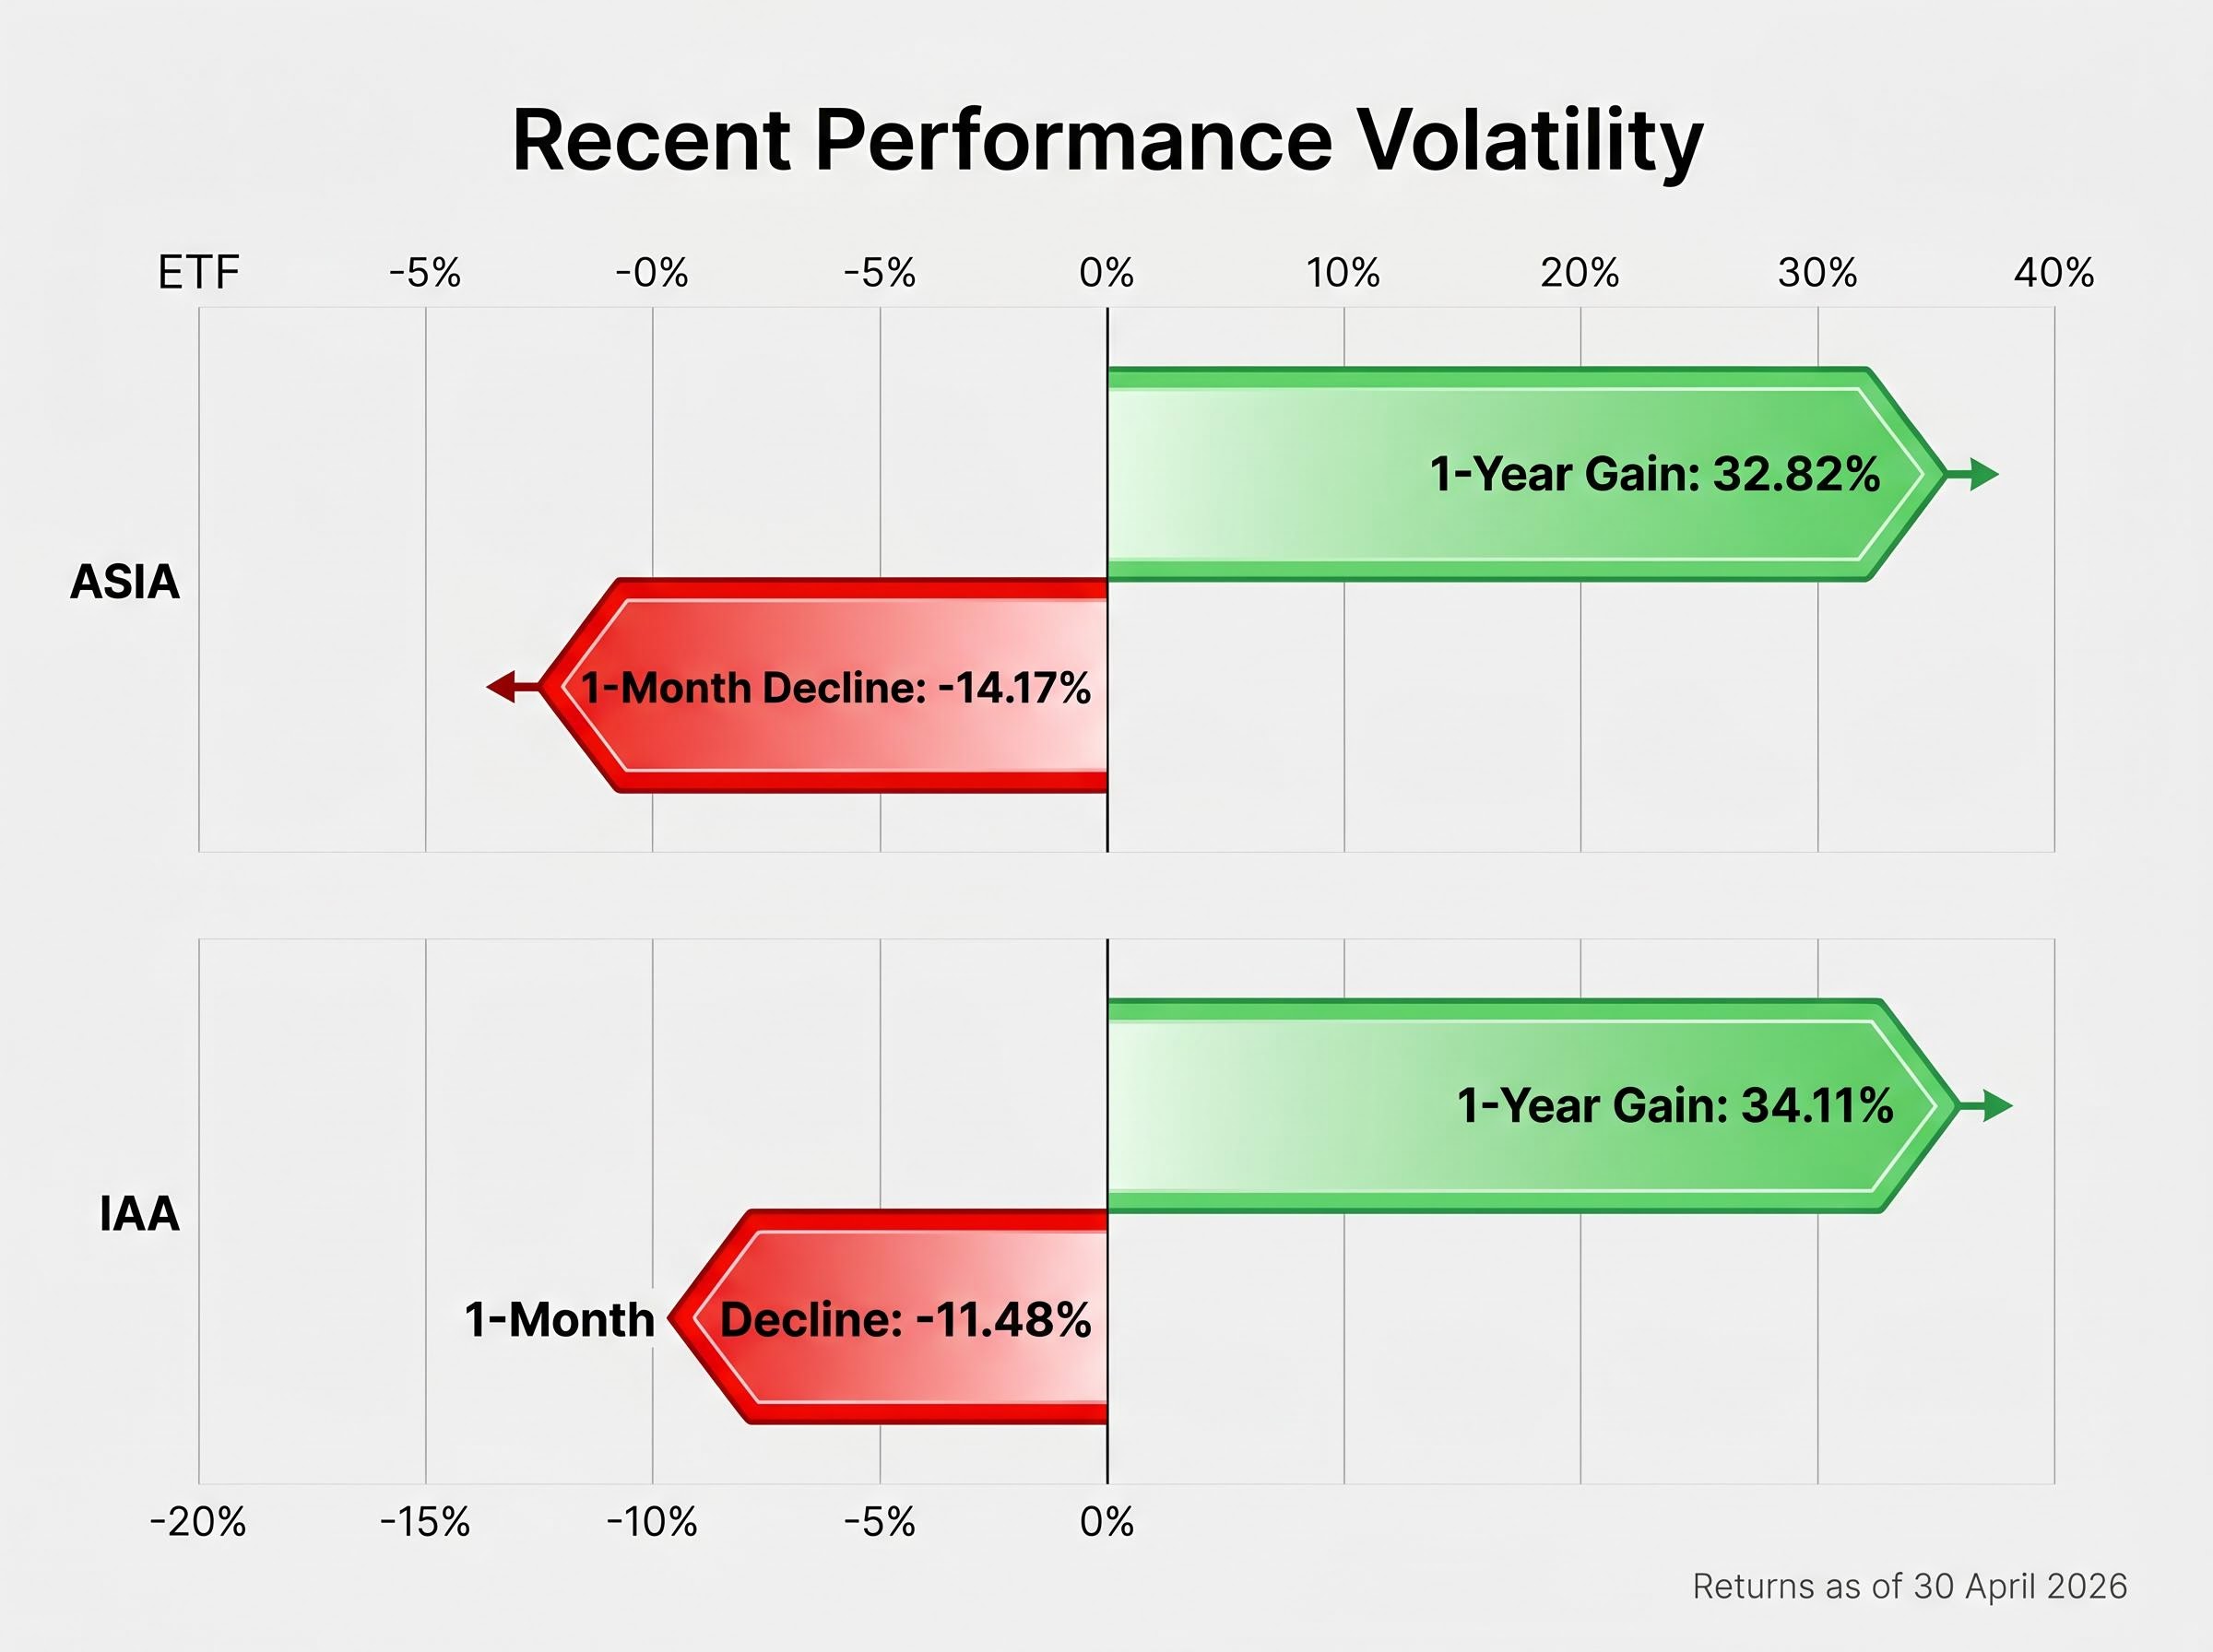
The one-month figures deserve attention. A 14.17% decline in ASIA and an 11.48% decline in IAA within a single month is consistent with the concentrated, geopolitically sensitive nature of these markets. It does not signal structural deterioration, but it does illustrate the volatility profile investors are accepting alongside the longer-term gains.
AI-driven demand for semiconductors has been a significant tailwind for ASIA’s longer-term performance. That same concentration creates sharper drawdowns when sentiment shifts or geopolitical risk spikes. Investors evaluating these products should calibrate expectations accordingly: a 30-plus percent annual gain and a 14 percent monthly drawdown can and do coexist.
AI capital expenditure driving semiconductors is not an abstract theme: the four largest hyperscalers are projected to invest $650 billion in AI infrastructure in 2026 alone, and that spending flows directly to the Taiwanese and South Korean manufacturers that sit at the top of ASIA’s country and sector allocations.
A note on data integrity: a previously circulated one-year return figure for ASIA of +71.65% is unverifiable. The confirmed figure from BetaShares is 32.82%.
VAE performance figures have not been confirmed via live data lookup. Investors should consult Vanguard Australia’s official ETF page for current performance data before making any allocation decisions.
The risks attached to these funds are not abstract regulatory disclaimers. They are specific, interconnected, and have produced real drawdowns in recent months.
ASIA has also been noted for relatively lower on-market liquidity compared to IAA and VAE, which may affect execution for larger orders.
For investors weighing whether ASIA’s semiconductor concentration is a structural advantage or a valuation risk, our deep-dive into AI hardware spending risks examines the case that escalating inference costs are making generative AI applications unprofitable, the conditions under which hyperscalers might decelerate capital deployment, and what that deceleration would mean for the chip manufacturers at the core of the fund.
Currency dynamics are often overlooked. When the AUD strengthens against Asian currencies, the value of underlying holdings declines in Australian dollar terms regardless of local market performance. This works in both directions, but investors accustomed to domestic-only portfolios may not anticipate the effect.
China’s regulatory environment adds a distinct layer. The technology crackdown that began in 2021 demonstrated how quickly government intervention can compress valuations across an entire sector. With China at 26.0% of ASIA’s allocation, this risk remains material.
Investors should read the Product Disclosure Statement (PDS) for each fund, available from BetaShares (ASIA), BlackRock/iShares (IAA), and Vanguard (VAE), as the authoritative source of risk disclosure before committing capital.
Three investor profiles map to the three available products:
These three funds are not mutually exclusive. Blending ASIA’s thematic concentration with VAE’s broad base is a structurally coherent approach for investors comfortable managing multiple positions and monitoring overlapping country exposures.
Before placing any trade, verify current MER, FUM, and holdings data directly from the relevant issuer pages. Download and read the PDS for each fund under consideration. Investors uncertain about allocation sizing or portfolio fit should consider speaking with a licensed financial adviser.
This article is for informational purposes only and should not be considered financial advice. Investors should conduct their own research and consult with financial professionals before making investment decisions. Past performance does not guarantee future results.
ASX-listed Asian ETFs genuinely reduce the operational friction of international diversification. They do not eliminate investment risk.
The core differentiator for each fund is straightforward: ASIA for concentrated technology and semiconductor exposure, IAA for blue-chip Asian breadth at the lowest confirmed fee, and VAE for the broadest diversification across Asia ex-Japan (pending data confirmation from Vanguard Australia).
As AI infrastructure demand continues to concentrate in Asian semiconductor and hardware manufacturers, the structural case for Asian market exposure in Australian portfolios is likely to strengthen rather than diminish. Whether that exposure should be concentrated or broad, and at what cost, depends on the individual investor’s risk tolerance, time horizon, and existing portfolio composition.
The next step is practical: visit the BetaShares, BlackRock/iShares, and Vanguard Australia product pages to compare current data, download the relevant PDS documents, and consider speaking with a licensed financial adviser before making allocation decisions.
An ASX-listed Asia ETF is an exchange-traded fund that holds a basket of Asian equities and trades on the Australian Securities Exchange in Australian dollars, allowing investors to gain exposure to markets like Taiwan, South Korea, China, and Singapore without needing an offshore brokerage account.
IAA, managed by BlackRock iShares, has the lowest confirmed management expense ratio among the three funds compared, at 0.29% per annum, making it the most cost-efficient option for broad Asian market exposure.
ASIA returned 32.82% and IAA returned 34.11% over the one year to 30 April 2026, though both also recorded sharp one-month drawdowns of 14.17% and 11.48% respectively over the same period, highlighting the volatility profile of these funds.
Key risks include geopolitical risk (particularly around Taiwan and US-China trade tensions), concentration risk in semiconductors and a small number of countries, currency risk from movements between the AUD and Asian currencies, and regulatory risk from China's history of sudden interventions in its technology sector.
ASIA suits growth-oriented investors wanting concentrated semiconductor and technology exposure; IAA suits cost-conscious investors seeking broad blue-chip Asian coverage at a lower fee; VAE suits those wanting the widest diversification across Asia ex-Japan, though its MER and performance data should be verified directly on the Vanguard Australia website before investing.