How ASX’s CHESS Overhaul Became a $250M Governance Failure
20 hrs ago

Two stock valuation methods applied to ANZ in May 2026 point to “fair value” within a few dollars of the current share price of $35.90. A PE comparison lands at $39.97. A dividend discount model averages out around $35.10-$35.74. The numbers are tidy, they broadly agree, and they invite an obvious conclusion: the stock is roughly fairly priced. So why do institutional analysts routinely spend upwards of 100 hours on qualitative research before they open a spreadsheet? The answer matters for every Australian retail investor holding bank shares, whether directly, through a super fund, or via an ETF. In an environment where the RBA cash rate sits at 4.35% following the May 5 hike, headline CPI runs at 4.6%, and Big Four impaired loans have climbed 15.4% to $9.6 billion in 1H26, a valuation number without context is not reassuring. It is incomplete. This guide explains what qualitative research experienced analysts conduct before applying any valuation model, why it matters for bank stocks specifically, and how Australian macro conditions right now make that framework directly relevant.
Start with what the models produce. ANZ reported FY24 earnings per share of $2.15. Apply the sector average PE multiple of 19x, and the arithmetic delivers a clean output: $39.97. Run a dividend discount model across a range of discount rates (6%-11%) and terminal growth rates (2%-4%), and the base case settles at $35.10, with an adjusted figure of $35.74.
Both outputs sit close to the current share price. For an investor scanning a broker note, that proximity might read as confirmation: the stock is near fair value.
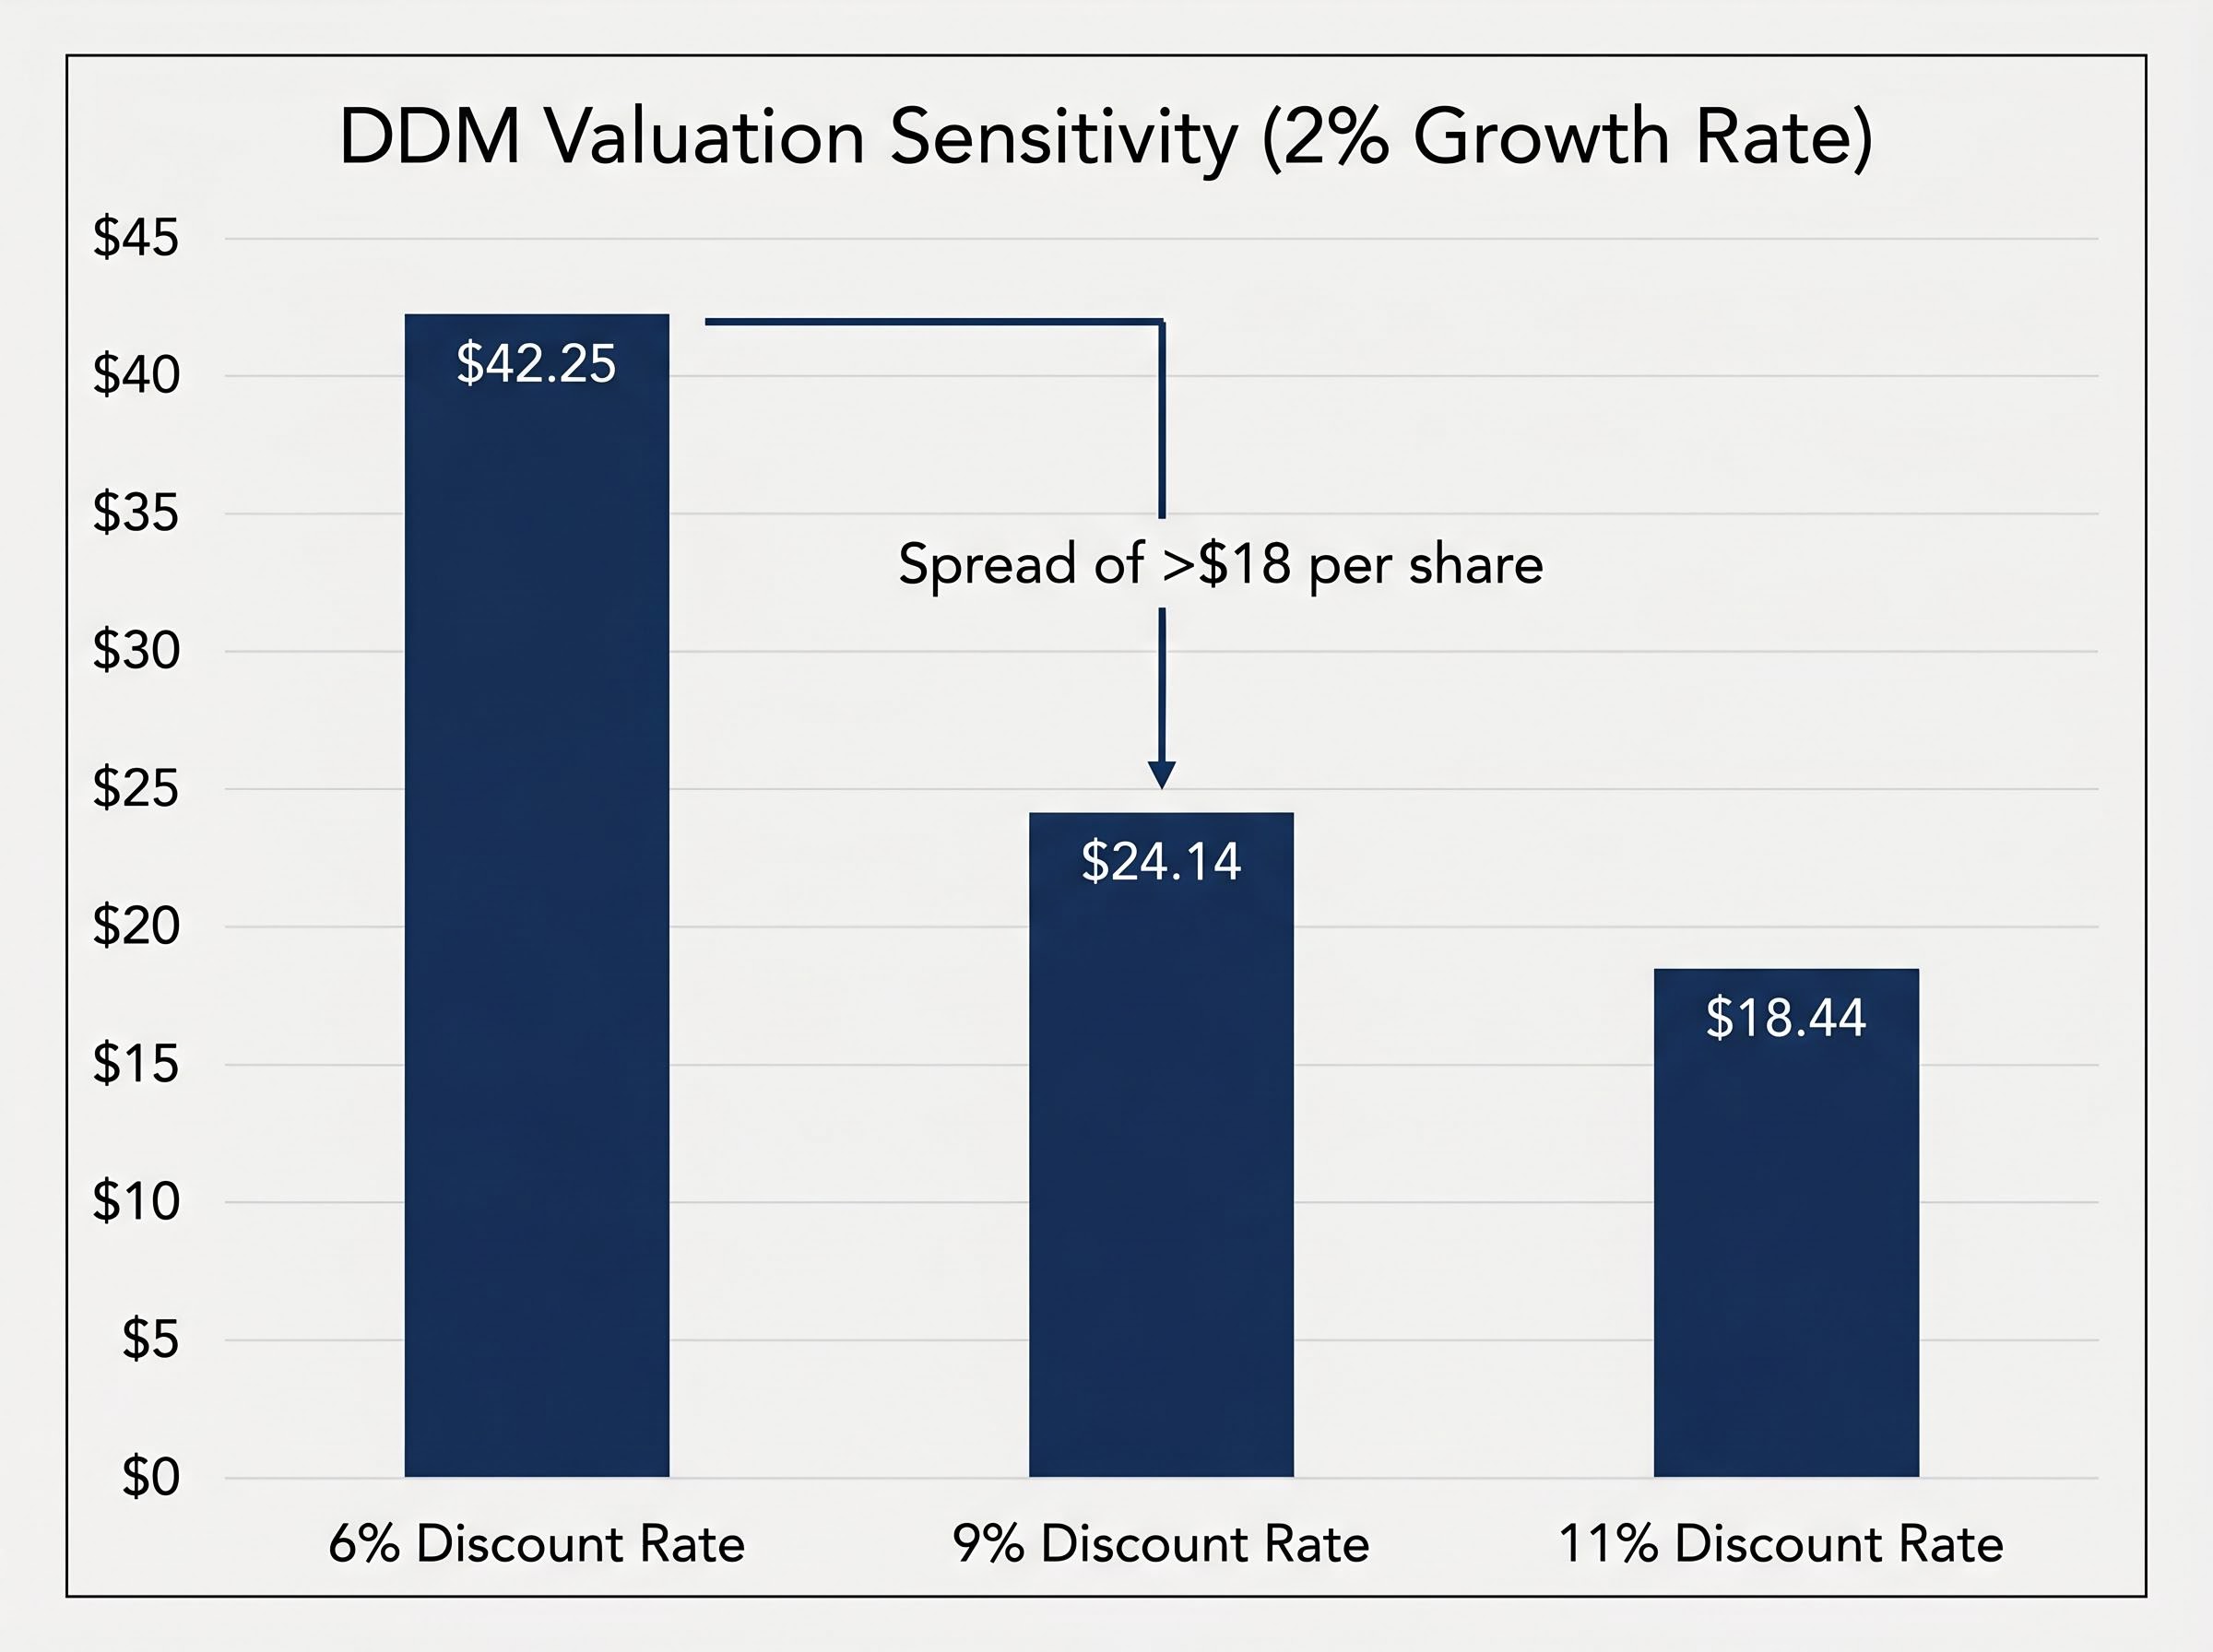
The comfort dissolves when the assumptions shift. The DDM is particularly exposed. A single change in the discount rate, holding everything else constant, reshapes the output dramatically.
| Discount Rate | Growth Rate 2% | Growth Rate 3% | Growth Rate 4% |
|---|---|---|---|
| 6% | $42.25 | $55.33 | $83.00 |
| 9% | $24.14 | $27.67 | $33.20 |
| 11% | $18.44 | $20.75 | $24.14 |
The same dividend, the same company, the same balance sheet. A move from a 6% to a 9% discount rate at 2% growth takes the valuation from $42.25 to $24.14, a spread of more than $18 per share. The model’s output depends entirely on which assumptions go in.
That spread is not an error. It is the model doing exactly what it is designed to do: translating assumptions into a price. The question is whether those assumptions hold. A retail investor treating the base case DDM of $35.10 as a verdict is placing trust in a specific discount rate and growth rate combination, and the table above shows how little room that trust has before the number changes materially.
A valuation model does not produce a conclusion. It produces a hypothesis. Everything that follows in this guide concerns the qualitative work required to test whether that hypothesis is worth acting on.
The sensitivity of macro assumptions in bank valuations extends well beyond the discount rate: the same NAB model produces outputs ranging from $19.00 to $85.50 per share depending on rate and growth combinations, a spread that reflects structurally different views on the economic cycle rather than any arithmetic disagreement.
The limitations are not abstract. For banks specifically, PE ratios and dividend discount models are structurally blind to three categories of risk that drive the most consequential moves in bank stock prices.
The institutional evidence supports this reading. Morgan Stanley in March/April 2026 characterised Australian banks as “fully priced” on PE metrics, with qualitative downside risks not yet reflected in multiples.
Morgan Stanley (March/April 2026) cautioned that Australian banks appeared “fully priced” based on PE metrics, with economic softening and credit quality deterioration representing qualitative risks the multiples had not yet absorbed.
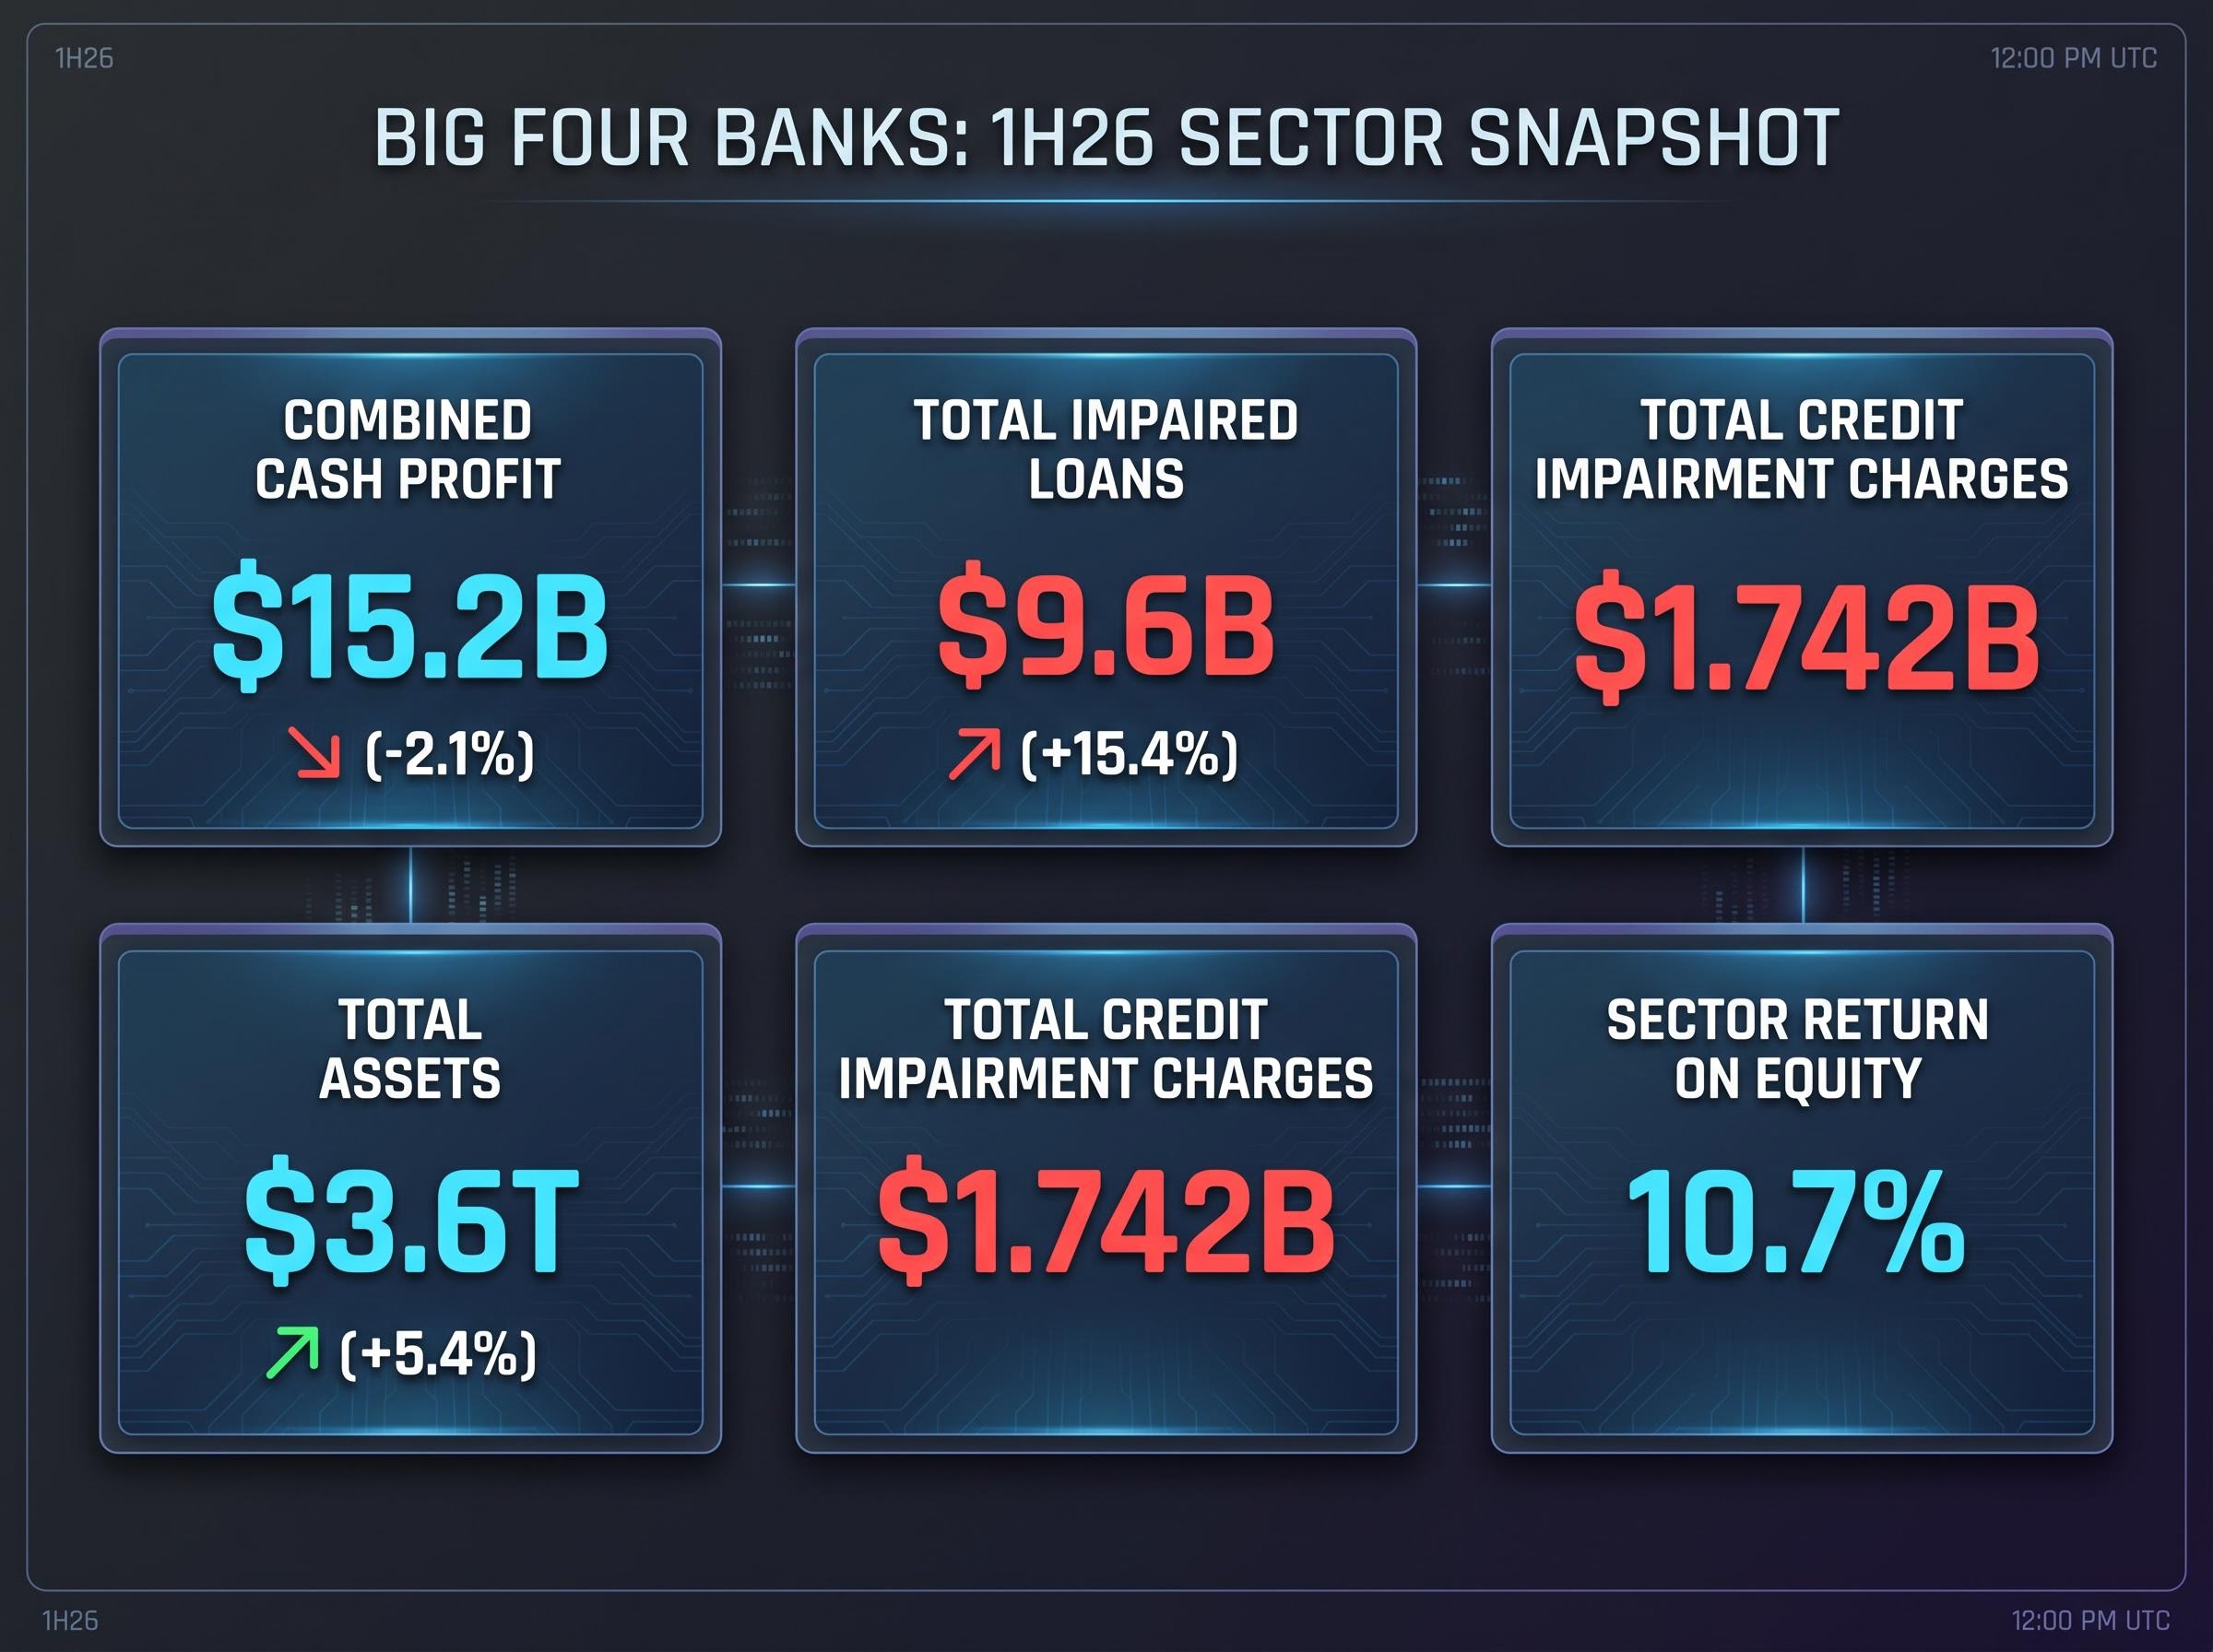
Combined cash profit across the Big Four came in at $15.2 billion in 1H26, down approximately 2.1% on the prior period. Total credit impairment charges reached $1.742 billion. NAB posted the highest charge at $706 million. Total impaired loans rose 15.4% to $9.6 billion. These are numbers a PE ratio calculated on FY24 earnings does not see.
The gap between what a model captures and what an investor needs to know is not filled by a better model. It is filled by a set of macro indicators that institutional analysts monitor continuously, each with a direct transmission mechanism into bank earnings.
| Macro Indicator | Current Reading (2026) | What It Signals for Bank Earnings |
|---|---|---|
| Unemployment rate | 4.3% (ABS, March 2026) | Flows through to mortgage and SME arrears; a rise increases provision charges |
| Residential property prices | 2.1% growth in Q1 2026 (CoreLogic) | Determines loss-given-default on mortgage books; falling prices erode collateral buffers |
| Inflation and consumer confidence | Headline CPI 4.6%; core (trimmed mean) 3.3% | Declining confidence reduces credit demand and increases borrower financial stress |
Each of these indicators is publicly available. The ABS publishes monthly labour force data. CoreLogic releases dwelling value indices quarterly. The RBA publishes the cash rate decision and supporting commentary after each board meeting.
The CoreLogic Hedonic Home Value Index, which recorded the 2.1% Q1 2026 national dwelling value increase referenced in this analysis, is released monthly and provides the most granular publicly available measure of collateral value trends across capital city and regional markets, making it the standard data source analysts use when stress-testing loss-given-default assumptions on mortgage books.
The transmission mechanisms are direct. Unemployment flows through to arrears: when borrowers lose income, repayment capacity degrades, and banks must increase provisions. Property prices determine loss-given-default on the largest single asset class on Big Four balance sheets, residential mortgages. Consumer confidence, squeezed by 4.6% headline inflation and a 4.35% cash rate, affects both demand for new credit products and the financial stress experienced by existing borrowers.
KPMG’s April/May 2026 analysis of the Big Four half-year results cited “growing macro uncertainty” and flagged “heightened refinancing and liquidity pressure” for some borrower cohorts. The 15.4% increase in impaired loans to $9.6 billion represents an early credit cycle signal that these macro indicators are beginning to translate into balance sheet stress.
The RBA’s 25 basis point hike on 5 May 2026, taking the cash rate from 4.10% to 4.35%, creates a dual effect. On the asset side, higher rates may modestly support net interest margins on variable-rate lending. On the liability side, they increase debt serviceability stress for leveraged households and SMEs.
The RBA’s third consecutive rate hike to 4.35% was supported by eight of nine Board members, with all four inflation measures still sitting above the 2-3% target band, a voting margin that signals the tightening cycle has not yet reached a clear consensus pause point.
This is precisely the environment where earnings multiples are most likely to mislead. The lagged effects of rate increases on credit quality have not yet fully flowed through to reported provisions. A PE ratio built on the prior year’s earnings does not capture the credit deterioration that higher rates are still transmitting through household and business balance sheets.
NAB’s 1H26 results offer a worked example of qualitative factors delivering analytical signal before the numbers confirmed it.
NAB’s business banking franchise is the largest among the Big Four. That market position is simultaneously a qualitative strength (franchise depth, pricing power, relationship stickiness) and a qualitative vulnerability (concentrated exposure to SME and cyclical sector stress). Analysts tracking NAB’s loan book composition, arrears trends in business lending, and sector-specific stress indicators had visibility on rising risk before the $706 million credit impairment charge, the highest of any major, appeared in the half-year results.
Non-performing exposures sat at approximately 1.52% of gross assets. Analyst downgrades to “hold” ratings for NAB during this period cited arrears trends and cyclical sector exposure as qualitative overrides to quantitative fair value assessments. The models may have said “fairly valued.” The qualitative layer said “wait.”
| Factor | NAB | Westpac |
|---|---|---|
| Credit impairment charge (1H26) | $706 million | $443 million |
| Non-performing exposures (% gross assets) | ~1.52% | Lower relative to NAB |
| CET1 ratio | Below Westpac level | 12.4% |
| Key qualitative characteristic | Business banking concentration; SME cyclical exposure | UNITE cost programme; defensive capital position |
Westpac’s position illustrates the contrast. A CET1 ratio of 12.4% provides a capital buffer above regulatory minimums. The UNITE cost reduction programme has been cited as a source of earnings resilience. These are qualitative signals an investor could have identified from company filings and APRA data before the earnings were reported.
Two banks in the same sector, analysable with the same valuation models, carrying materially different qualitative risk profiles. The models alone do not distinguish between them.
Australian investors face an analytical task that global valuation textbooks do not fully address. Three factors specific to the Australian market alter how bank valuations should be read.
For domestic shareholders, particularly those in super funds, the grossed-up yield on a fully franked Big Four dividend is significantly higher than the cash yield. Any valuation framework that ignores this adjustment systematically understates the after-tax return of Australian bank stocks for their largest holder base.
Investors in super funds or SMSFs who want to quantify how much the grossed-up yield differs from the headline cash dividend will find our full explainer on franking credits for Australian investors covers the ATO cash refund mechanism, the 45-day holding rule, and how pension-phase SMSFs can receive the full credit as a refundable tax offset.
Sector return on equity held at 10.7% in 1H26 despite profit softening, and total Big Four assets grew 5.4% to $3.6 trillion. These figures provide context, but they become meaningful only when read through the Australian-specific analytical lens.
Institutional analysts spend upwards of 100 hours on qualitative research before applying a valuation model to a bank stock. Retail investors cannot replicate that time commitment, but they can follow the same sequence at a lighter intensity using publicly available Australian data sources.
APRA quarterly ADI statistics covering capital adequacy, asset quality, and liquidity ratios are published after each quarter-end, giving investors direct access to the same regulatory data that institutional analysts use when assessing whether a Big Four bank’s CET1 ratio sits comfortably above minimum requirements or is being squeezed by credit deterioration.
Each step draws on public data. The ABS, RBA, CoreLogic, APRA, and individual bank filings are all freely accessible. The discipline is not access; it is sequence. The qualitative screen comes first. The valuation model scores a candidate that has already passed that screen.
Dividend sustainability signals extend beyond payout ratios: a rising dividend yield driven by a falling share price can indicate the market is pricing an imminent cut, and a payout ratio above 100% is one of the clearest early warnings that a reduction is likely within one to two reporting cycles, both patterns worth cross-checking against the APRA capital adequacy data the research sequence above identifies.
A PE ratio is not an investment conclusion. A DDM output is not a price target. Both are hypotheses, structured around assumptions that may or may not survive contact with the credit cycle, the rate environment, and the specific qualitative characteristics of the bank in question.
That does not make the models useless. It makes them contextual. A valuation figure produced after a thorough qualitative review, one that accounts for macro indicators, credit cycle positioning, regulatory capital, and sector-specific stress, carries meaning that the same figure produced in isolation does not.
In the current Australian environment, the qualitative signals are pointing in a direction that models built on prior-year earnings have not yet captured. Impaired loans are rising. The rate environment is tightening borrower capacity. Consumer confidence is under pressure. Any valuation estimate an investor encounters for a Big Four bank stock deserves to be tested against these conditions before it informs a decision.
This article is for informational purposes only and should not be considered financial advice. Investors should conduct their own research and consult with financial professionals before making investment decisions. Past performance does not guarantee future results. Financial projections are subject to market conditions and various risk factors.
The two most common stock valuation methods applied to Australian bank stocks are the price-to-earnings (PE) comparison, which multiplies earnings per share by a sector average multiple, and the dividend discount model (DDM), which estimates value based on projected future dividends discounted back to present value.
The DDM is highly sensitive to the discount rate because it divides the dividend by the difference between the discount rate and the growth rate; moving from a 6% to a 9% discount rate at 2% growth, for example, drops the ANZ valuation from $42.25 to $24.14, a swing of more than $18 per share from the same underlying company.
Investors should review macro indicators such as the unemployment rate, residential property prices, and inflation, then assess credit cycle positioning by tracking impaired loan trends, evaluate regulatory capital ratios via APRA data, and analyse management commentary on cost programmes and lending risk appetite before applying any valuation model.
Fully franked dividends carry an imputation credit representing tax already paid by the company, which reduces the tax liability for domestic shareholders and makes the grossed-up yield materially higher than the headline cash yield, an adjustment that standard PE ratios and DDM calculations do not automatically incorporate.
Total Big Four impaired loans rose 15.4% to $9.6 billion in the first half of 2026, an early credit cycle signal that higher interest rates and cost-of-living pressure are beginning to translate into balance sheet stress, which trailing earnings-based valuation models may not yet have captured.