Tesla at $390: a Framework for Valuing Transformation-Stage Stocks
7 mins ago

At roughly $375 per share, every projected return outcome for Tesla under a realistic bear case scenario was negative. Yet at that same price, a bull case scenario projected annualised returns of up to 35% over a decade. Same stock. Same price. Completely opposite investment conclusions.
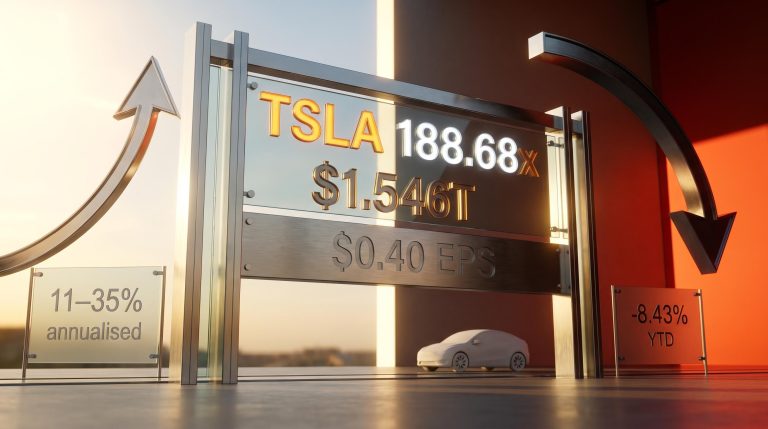
Tesla’s Q1 2026 earnings, released 22 April 2026, reignited one of the most polarising stock valuation analysis debates in modern markets. With a forward price-to-earnings (P/E) ratio near 189x, analyst price targets ranging from $25 to $600, and the company simultaneously spending more than $25 billion in capital expenditure to build robots, autonomous taxis, and AI chips, Tesla has become a live classroom in how to think through transformation-stage company valuation. The methods investors apply, and the inputs they choose, determine whether they see extraordinary opportunity or dangerous overvaluation in the exact same stock at the exact same price.
What follows uses Tesla’s Q1 2026 numbers as a concrete teaching case to walk through the step-by-step methodology for building bull and bear scenarios, understanding what valuation multiples are really pricing in, and grasping why entry price is one of the most consequential decisions any investor makes.
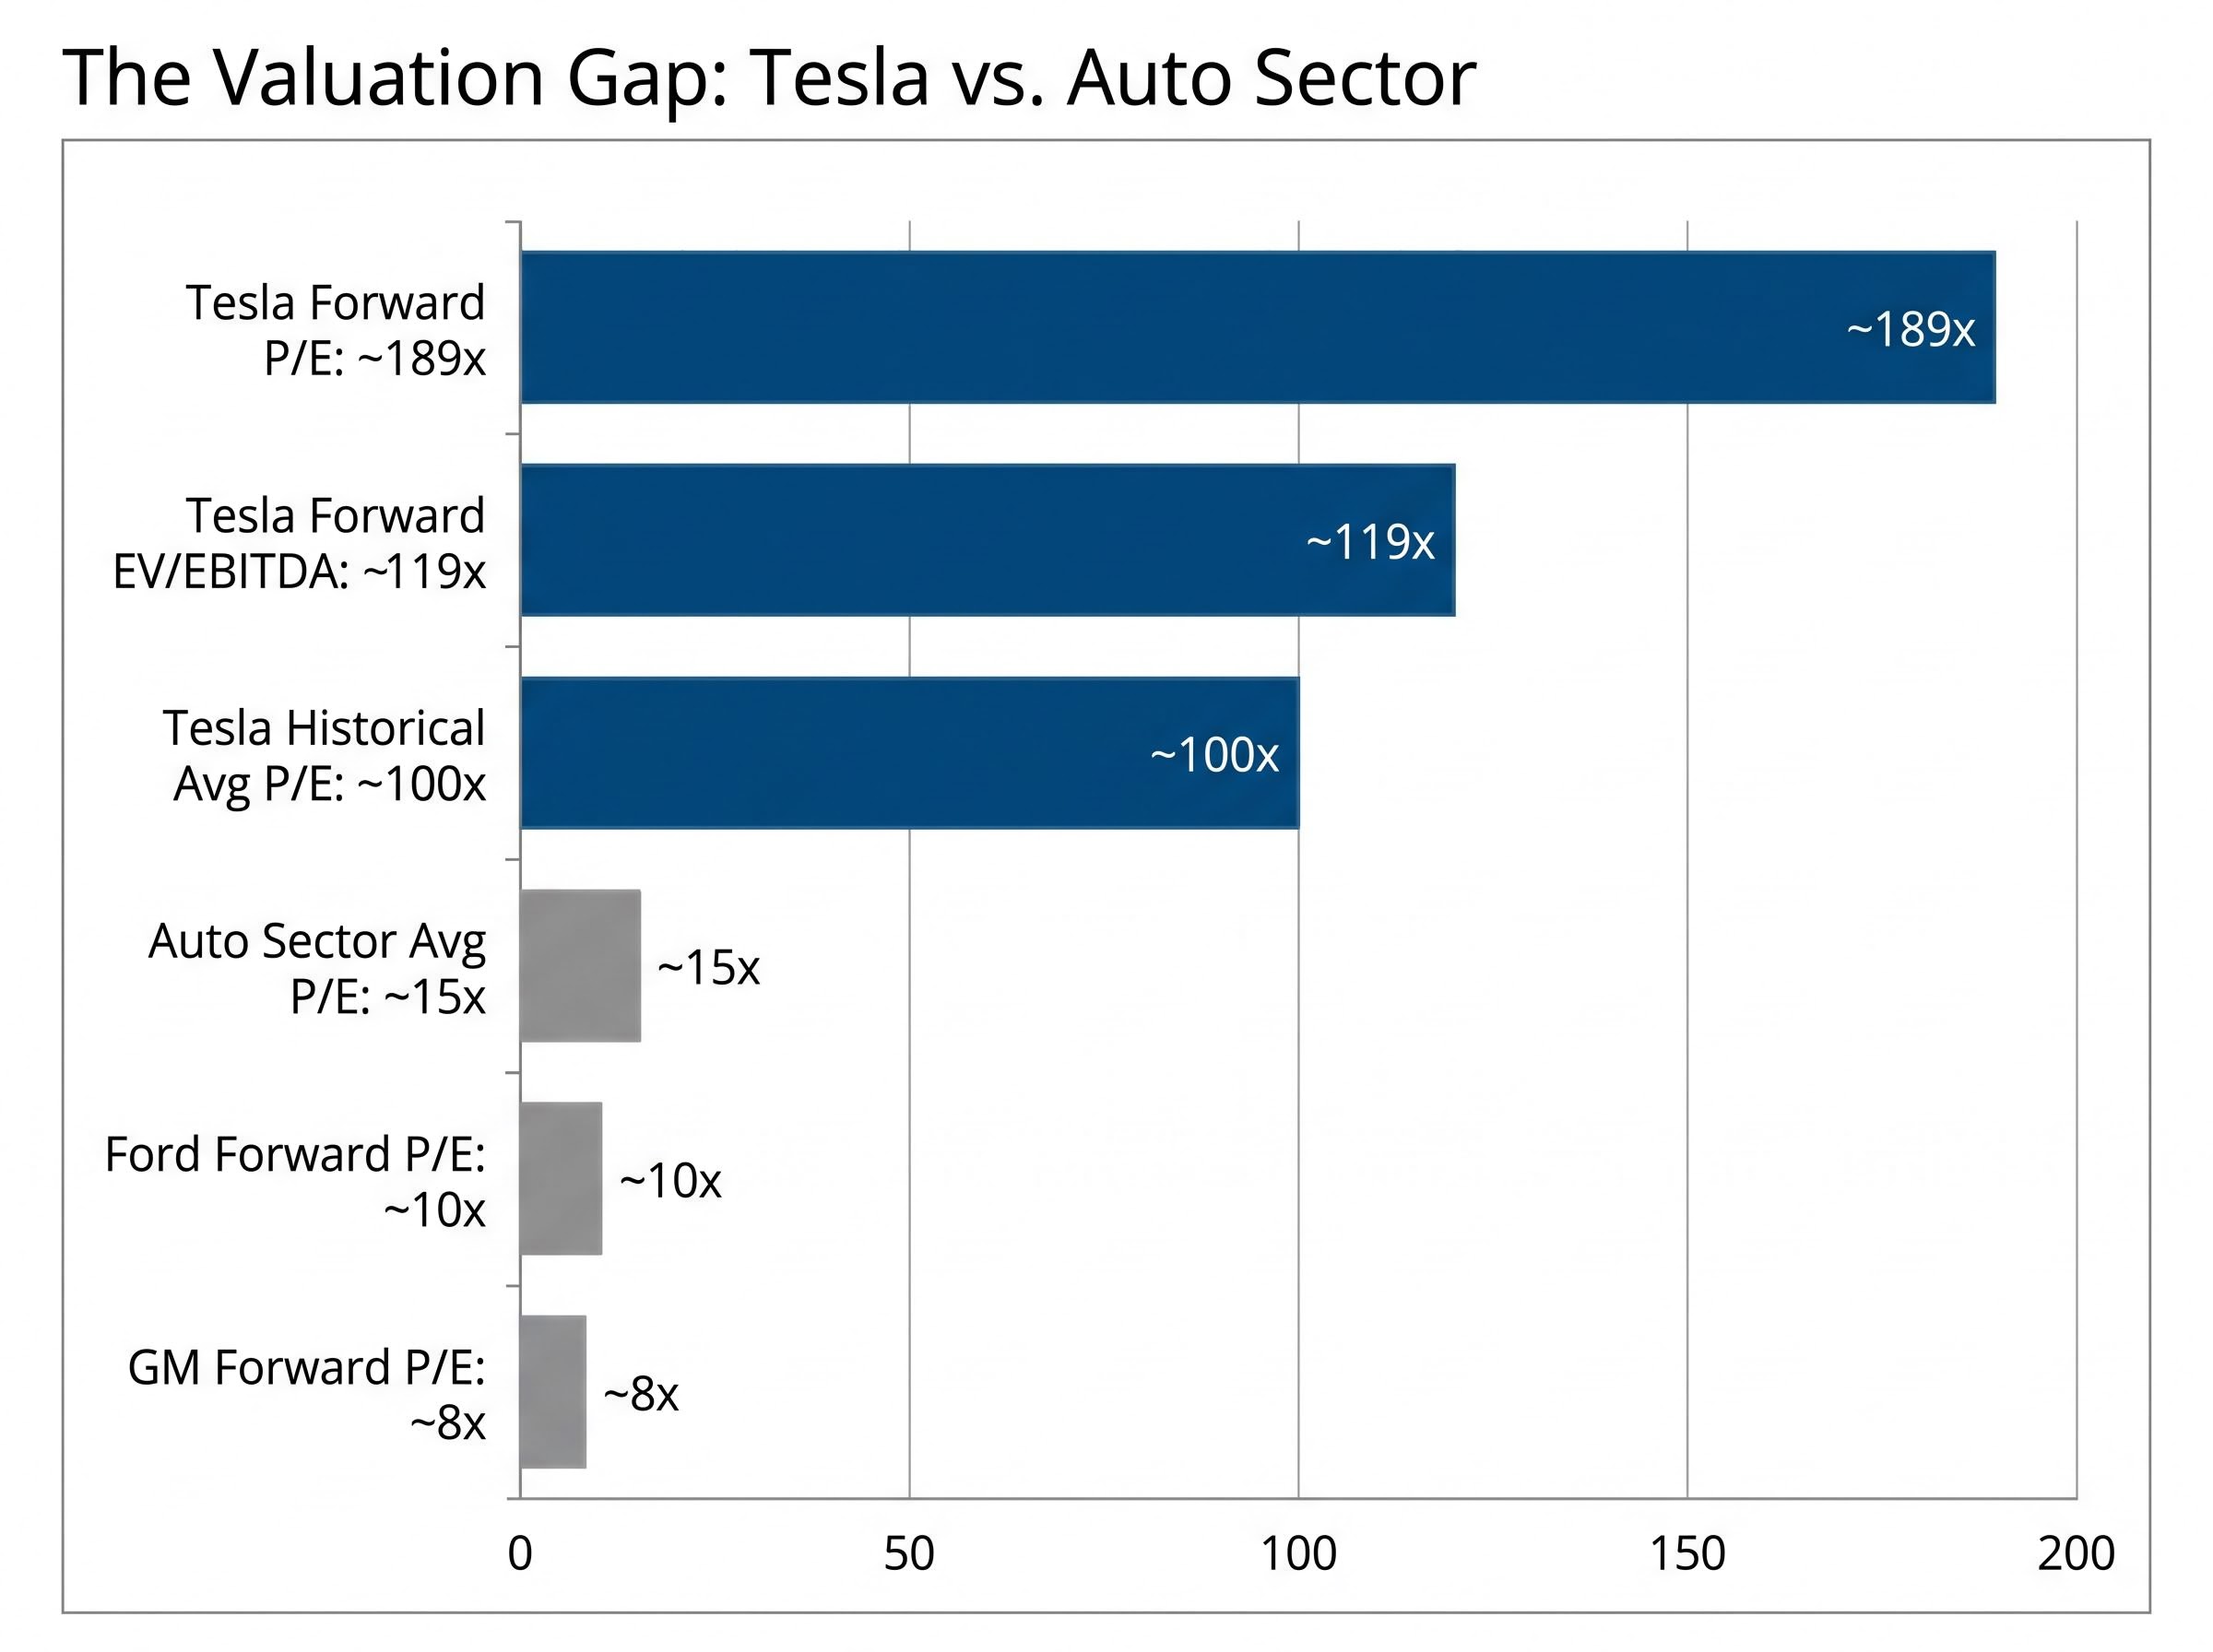
Apply a traditional automotive peer multiple to Tesla and the numbers collapse. Ford trades at roughly 10x forward P/E. GM sits near 8x. The auto sector average hovers around 15x. Tesla trades at approximately 189x forward earnings, more than twelve times the sector average and nearly double its own historical average of roughly 100x.
That gap is not an anomaly. It is a deliberate analytical choice by the market.
| Company | Forward P/E | Forward EV/EBITDA |
|---|---|---|
| Tesla | ~189x | ~119x |
| Ford | ~10x | Sector range |
| GM | ~8x | Sector range |
| Tesla (historical avg.) | ~100x | N/A |
Tesla reported Q1 2026 revenue of $25.2 billion, net income of $1.1 billion, and negative free cash flow of $2.5 billion. On today’s earnings alone, the company looks expensive by almost any conventional measure. The market is not pricing today’s earnings. It is pricing a future business that does not yet exist in the financials.
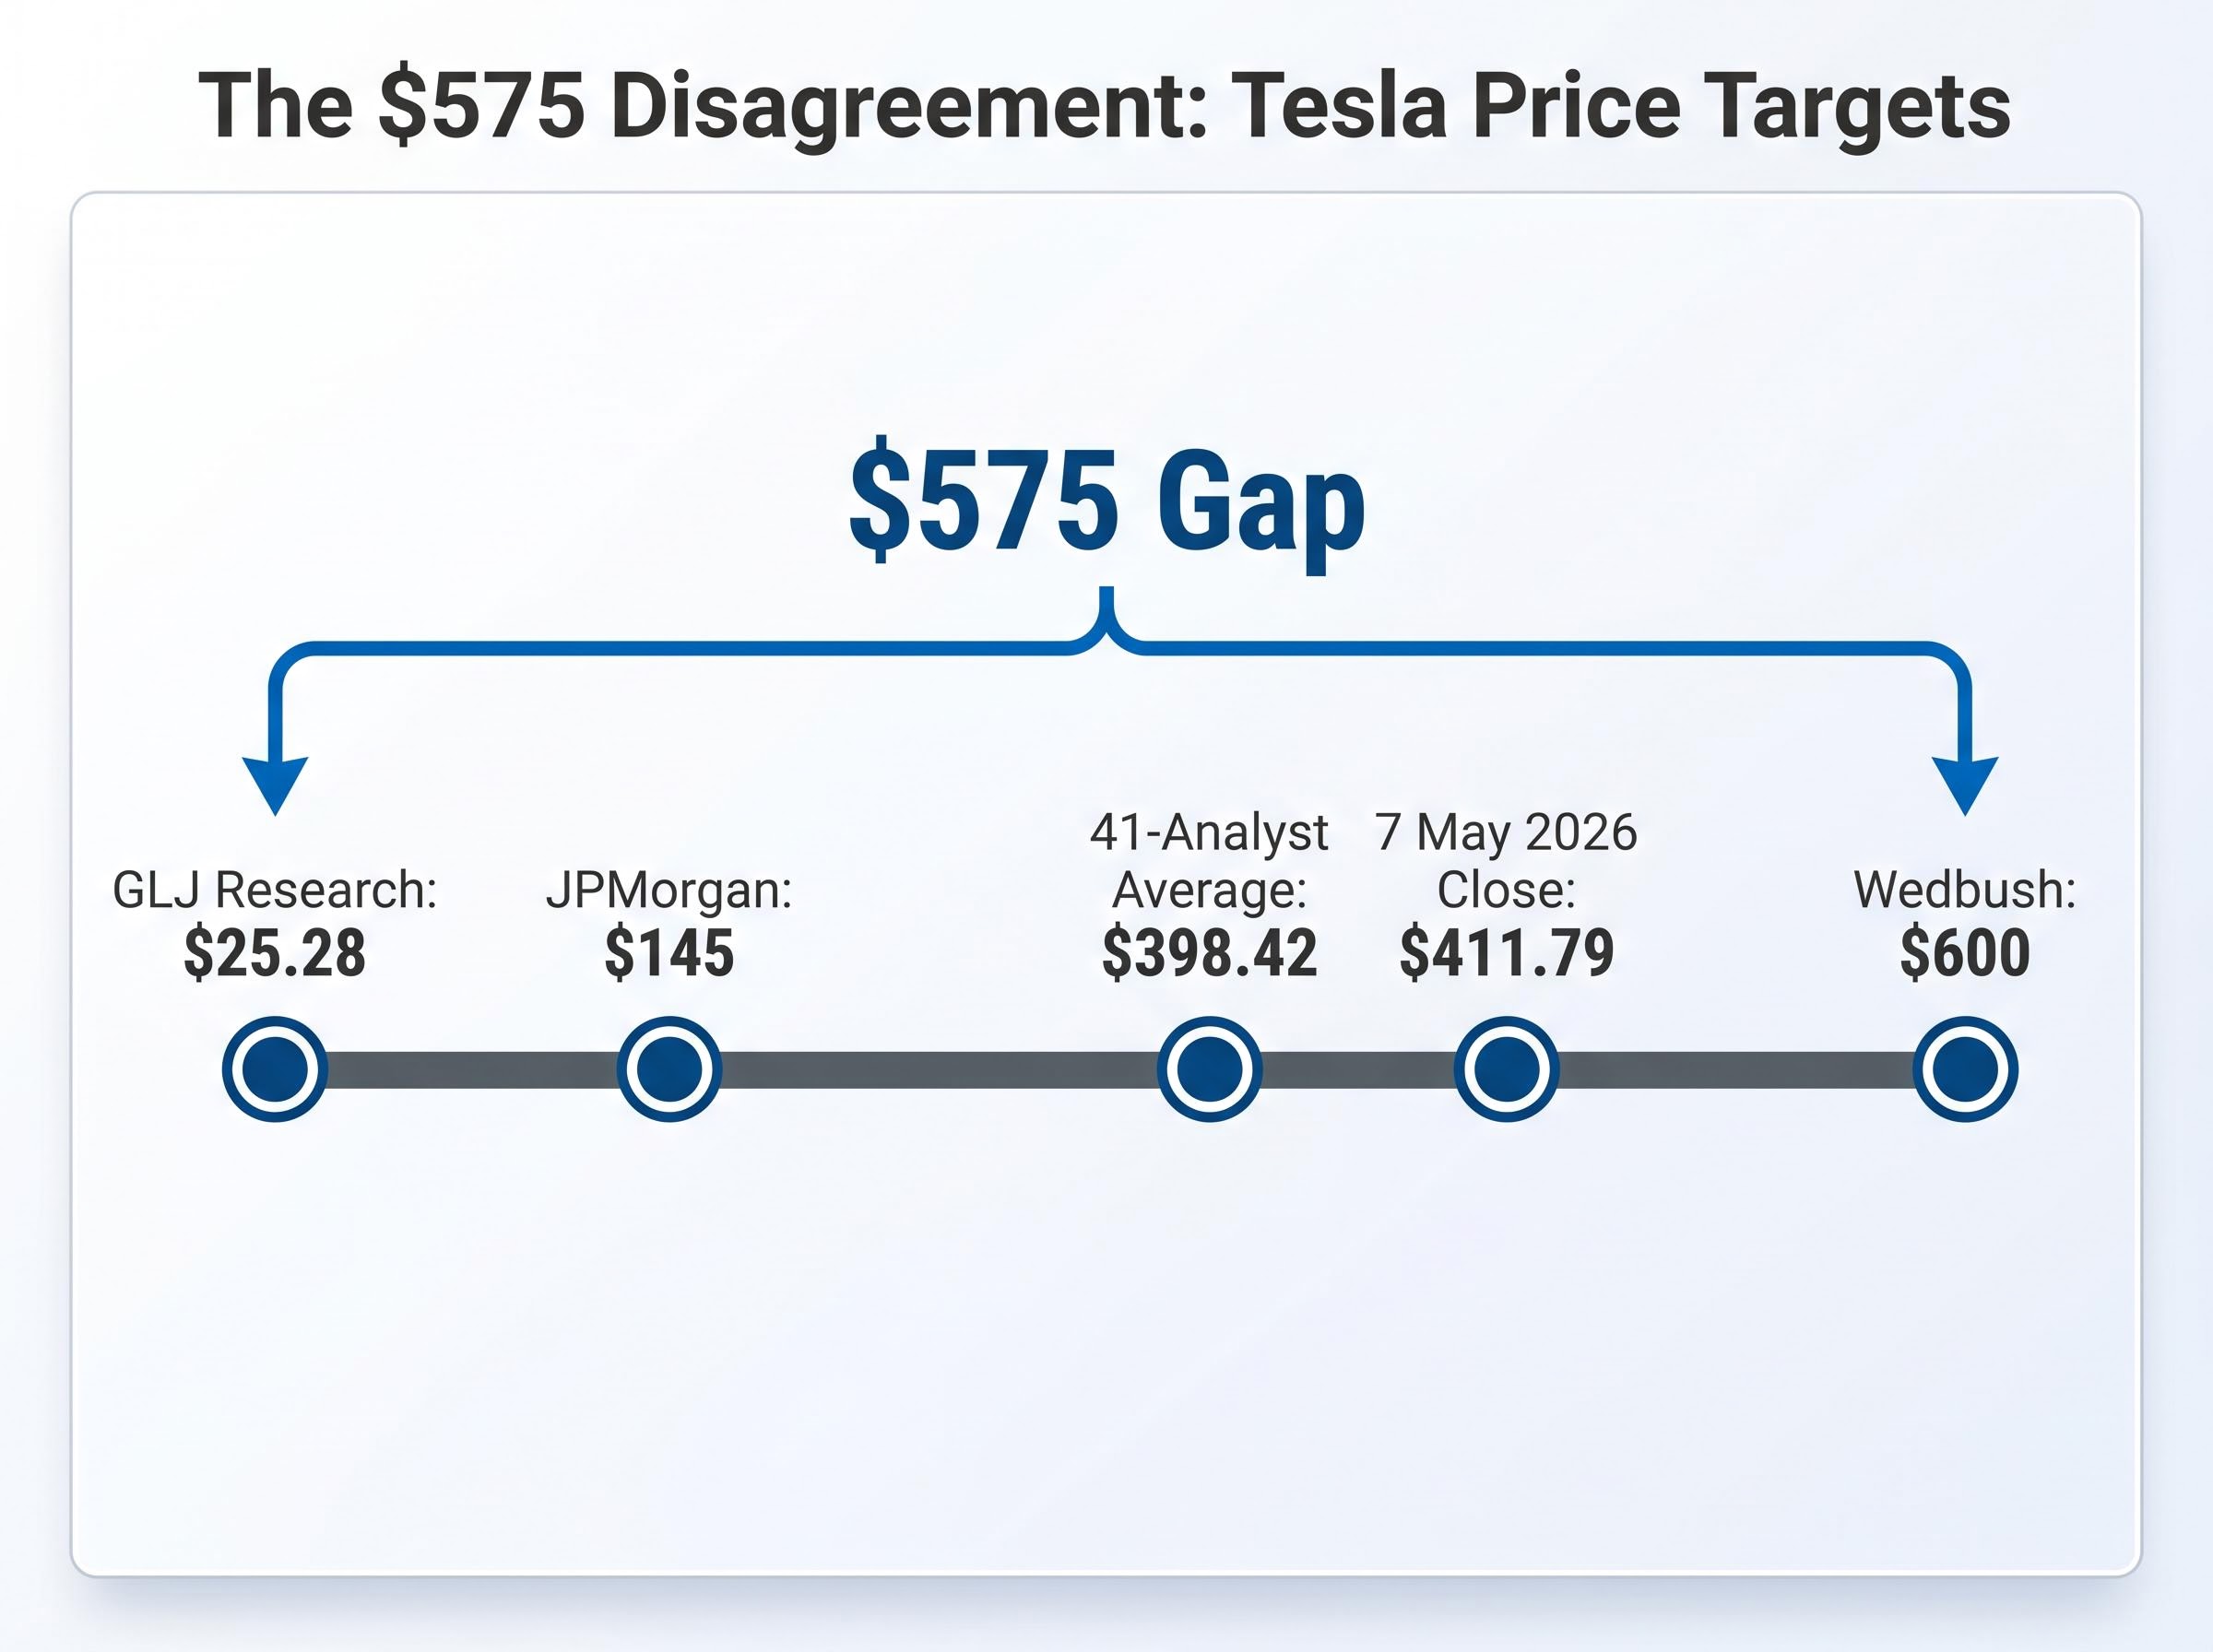
Analyst price target range: $25.28 (GLJ Research) to $600 (Wedbush), with a 41-analyst average of $398.42. That $575 gap between the lowest and highest target is the market’s disagreement made visible.
Both frameworks, pricing the present and pricing the future, can be simultaneously valid depending on which scenario an investor believes is most probable. The investor’s job when analysing a company mid-transformation is not to find the “correct” valuation. It is to identify what must be true for the current price to make sense, and then assess the probability of that happening.
Every forward scenario model, whether produced by a Wall Street desk or a retail investor with a spreadsheet, rests on three input levers. Change any one of them and the output shifts dramatically.
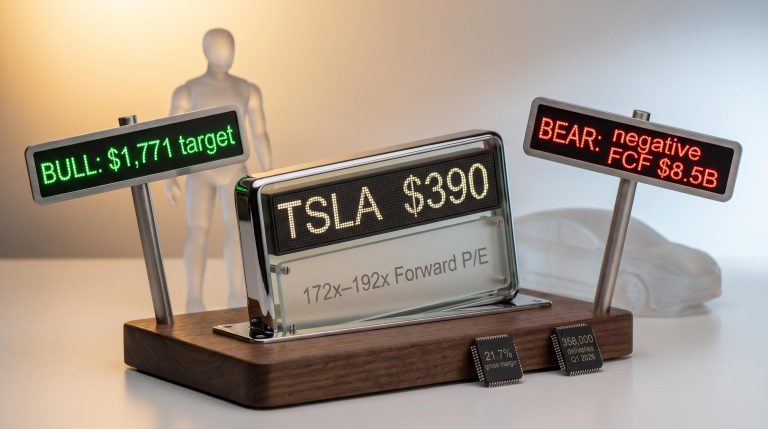
These inputs are not objective facts. They are assumptions. The investor’s analytical task is to decide which set of assumptions is most plausible and to recognise what the market is already embedding in the current price. Tesla’s Q1 2026 EBITDA of $3.8 billion against a forward EV/EBITDA consensus of roughly 119x indicates the market is already pricing substantial future earnings growth into the stock. Analyst earnings-per-share estimates declined more than 90% from peak levels before recovering in forward projections, illustrating how sensitive these models are to shifting assumptions.
A discounted cash flow (DCF) model projects future cash flows and discounts them back to a present value using a required rate of return. It works best for companies with predictable, positive cash flows. Tesla’s negative $2.5 billion free cash flow in Q1 2026 means that any DCF model becomes extremely sensitive to assumptions about terminal value, the estimate of what the business will be worth far into the future. Small changes in the terminal growth rate can swing the output by tens of billions of dollars.
Comparable company analysis (comps) offers a market-anchored alternative. Instead of projecting cash flows, comps apply the valuation multiples of similar companies to the target’s financials. The challenge for Tesla is peer selection. Comparing the company against Nvidia as a technology and AI peer produces a radically different conclusion than comparing it against Ford as an automotive manufacturer. Thoughtful peer selection is the difference between a useful sanity check and a misleading one.
Sum-of-the-parts methodology offers a structural complement to the scenario framework built here: rather than projecting a single blended revenue growth rate, it assigns a separate valuation to each business line, Automotive, Energy, FSD software, and Optimus, and sums them independently, which makes the contribution of each unproven segment to the total price tag explicit rather than embedded in a single multiple.
The bull case begins with a specific view of the world: Tesla is not an automotive company but a technology platform whose vehicles, autonomous driving software, humanoid robots, and energy infrastructure will compound into a business several times the size of today’s.
The inputs supporting that view are as follows:
| Input | Bull Case Range | Implied Annualised Return (10 yr) |
|---|---|---|
| Revenue growth | 20% to 35% annually | ~11% to ~35% |
| Net profit margin | 20% to 30% | |
| Exit multiple | 25x to 35x earnings |
Each input rests on a specific business development Tesla would need to execute. The 20% to 30% margin assumption requires Full Self-Driving (FSD) to reach commercial monetisation at scale, generating high-margin software revenue that transforms the company’s cost structure. The revenue growth midpoint of approximately 27% depends in part on Optimus, Tesla’s humanoid robot, reaching third-party commercial availability by 2027 after V3 production targeting late July or early August 2025. And the Cyber Cab programme, with autonomous miles reported to have nearly doubled in Q1 2026 compared to the prior period, would need to generate meaningful robo-taxi network revenue.
Wedbush’s $600 price target anchors the upper bound of this scenario in analyst reality.
The bull case carries an estimated 5% to 10% probability of full materialisation, yet it projects annualised returns of 11% to 35% over a decade. Even the optimistic scenario does not guarantee exceptional returns at current prices.
Building the bull case from its assumptions makes clear that it is not an irrational position. It is a coherent framework with specific, falsifiable predictions that investors can monitor as execution milestones either materialise or miss.
The bear case does not require pessimism. It requires precision.
Bear case inputs treat Tesla as an excellent electric vehicle company with above-average automotive margins but no AI or robotics transformation:
| Input | Bear Case Range | Implied Annualised Return (10 yr) |
|---|---|---|
| Revenue growth | 6% to 12% annually | Negative across all outcomes |
| Net profit margin | 8% to 14% | |
| Exit multiple | 18x to 22x earnings |
At approximately $375 per share, every projected return outcome under this scenario was negative. The current price already embeds the transformation thesis and assigns essentially no value to the scenario where Tesla remains a premium car company without an AI-driven revenue multiplier.
JPMorgan’s $145 price target represents the most prominent institutional bear anchor and reflects this automotive-only valuation framework.
Three specific competitive and regulatory risks underpin the bear case:
The NHTSA engineering analysis into Tesla FSD, opened on 18 March 2026 and covering an estimated 3.2 million vehicles, focuses specifically on the system’s performance in reduced visibility conditions, adding a concrete regulatory ceiling to FSD’s near-term commercial deployment timeline.
Elon Musk’s historical timeline pattern adds further context. A claim that vehicles had “full autonomy hardware” in 2016, a projection of one million robo-taxis by the end of 2020, and an assertion that Optimus would be deployment-ready in 2022 all missed their announced schedules. Alongside more than $25 billion in capex guidance for 2026 and negative $2.5 billion free cash flow in Q1, the bear case asks a straightforward question: what, exactly, are investors paying for at current prices? The answer is almost entirely a future that has not yet arrived.
A Tesla investor who bought near $100 several years ago and a Tesla investor buying near $411.79 (the 7 May 2026 close) may hold the same bull thesis. They do not hold the same investment.
The first investor has a margin of safety measured in hundreds of percentage points of gain already captured. A 50% drawdown from current prices would still leave them profitable. The second investor has no margin of safety at all if the transformation thesis stalls. Entry price transforms the return mathematics of identical analytical conclusions.
The concept of margin of safety, the distance between the price paid and the estimated intrinsic value under the most probable scenario, determines how much execution risk an investor can absorb before the investment produces a loss. The 41-analyst consensus average target of $398.42 sits below the 7 May close of $411.79, meaning even the average analyst is currently projecting slight downside from the spot price. The options market, with a put/call ratio of 0.73 as of 6 May, shows net bullish positioning, but that sentiment does not change the mathematical reality that the reward-to-risk profile at current prices depends almost entirely on the bull scenario materialising.
Broad market valuation signals add a further layer of context to any single-stock analysis: the Buffett Indicator reached 223.6% in May 2026, approximately 2.4 standard deviations above its long-run historical trend, meaning the macro backdrop against which Tesla’s transformation scenario must play out is itself pricing in considerable optimism.
Every projected return outcome under the bear case was negative at approximately $375 per share.
Rather than committing to a single scenario, probability-weighted expected returns allow investors to see the full expected value of a position. If the bull case (estimated 5% to 10% probability) projects annualised returns of 11% to 35%, and the bear case (carrying the residual probability) projects negative returns, multiplying each scenario’s return by its probability and summing the results produces the weighted expected outcome.
Forward EPS estimates growing more than 5x from current levels in analyst projections illustrate the scale of earnings expansion the bull case requires. The expected value calculation forces investors to confront whether that expansion is sufficiently probable to compensate for the losses embedded in the bear scenario at today’s price.
The methodology applied to Tesla above is not Tesla-specific. It is a framework that transfers to any company whose market price reflects a transformation that has not yet materialised in the financials.
The growth stock valuation discount that reached 21% below fair value in March 2026 reflects the same dynamic at sector scale: when transformation timelines compress under macro pressure, the exit multiples embedded in bull case scenarios become harder to defend, and the gap between optimistic and conservative price targets widens across the entire growth category.
The five-step process, distilled:
Analyst EPS estimates for Tesla declined more than 90% from their peak before recovering in forward projections, a pattern that illustrates how transformation timelines repeatedly reset analyst models. Musk’s history of announcing innovations that eventually arrive, but rarely on the announced schedule, is a specific illustration of why probability discounting matters for any company led by ambitious timelines.
This framework applies beyond a single stock:
The reader who finishes with a reusable analytical process, rather than a view on one company, holds something more durable than a stock opinion.
The value of scenario-based thinking is not predicting which outcome occurs. It is making an informed decision about whether the current price fairly compensates the investor for bearing the uncertainty of not knowing.
Investors holding any position where the stock price appears to reflect a future business that does not yet exist in the financials can apply the same bull/bear framework outlined here. The question that separates disciplined investors from narrative-driven ones is never “do I believe in this company?” It is: what does the price already believe, and do I agree with those odds?
For investors who want to know which specific milestones will most meaningfully update the probability weightings built here, our deep-dive into Tesla’s Q2 2026 reassessment catalysts identifies the July 2026 earnings call gross margin reading, California DMV commercial permitting decisions, and Optimus deployment milestones as the three near-term signals that will shift the bull-versus-bear probability balance most materially.
This article is for informational purposes only and should not be considered financial advice. Investors should conduct their own research and consult with financial professionals before making investment decisions. Past performance does not guarantee future results. Financial projections are subject to market conditions and various risk factors.
Scenario-based stock valuation analysis builds separate bull and bear financial models using different assumptions for revenue growth, profit margins, and exit multiples, then weights each scenario by its estimated probability to calculate an expected return. This approach is particularly useful for transformation-stage companies like Tesla where the current price reflects a future business that does not yet exist in the financials.
A bull case uses optimistic inputs, such as 20% to 35% annual revenue growth, 20% to 30% net profit margins, and a 25x to 35x exit multiple, while a bear case uses conservative inputs like 6% to 12% growth, 8% to 14% margins, and an 18x to 22x exit multiple. Each scenario implies a different annualised return over a 10-year horizon, and comparing them reveals what the current share price is already assuming about the company's future.
Entry price determines the margin of safety available to an investor, which is the gap between the price paid and the estimated intrinsic value under the most probable scenario. An investor who bought Tesla near $100 and one who buys near $411.79 may hold the same thesis, but the second investor has no buffer if the transformation story stalls, making the reward-to-risk profile entirely dependent on the optimistic outcome materialising.
As of Q1 2026, Tesla trades at approximately 189x forward price-to-earnings, compared to roughly 10x for Ford and 8x for GM, meaning the market is pricing Tesla as a technology and AI platform rather than a traditional automaker. This multiple is also nearly double Tesla's own historical average of around 100x forward earnings.
Probability-weighted expected returns are calculated by multiplying each scenario's projected annualised return by its estimated likelihood and summing the results. For Tesla, if the bull case carries a 5% to 10% probability and projects 11% to 35% annualised returns, while the bear case carries the residual probability and projects negative returns, the weighted sum reveals whether the current price fairly compensates investors for the uncertainty involved.