How to Value a Stock Like Tesla Using Scenario Analysis
4 mins ago

Two analysts can examine the same company, the same earnings report, and the same stock price and arrive at projected 10-year returns that differ by more than 40 percentage points. Why? Because when a company’s future may look nothing like its present, the assumptions behind a valuation matter more than the arithmetic. Tesla in mid-2026 is one of the most instructive examples of this problem. Q1 2026 results showed $22.4 billion in revenue, a gross margin of 21.7%, and earnings per share of approximately $0.40, beating consensus. The core business is real. Yet the forward price-to-earnings (P/E) ratio sits in the triple digits, pricing in a future that does not yet exist at commercial scale. This article provides a repeatable framework for evaluating any company in strategic transition: how to build bull and bear cases, why entry price determines which scenario an investor needs to be right about, and what Tesla’s numbers reveal about the methodology in practice. All specific figures are used for illustration and should be independently verified before any investment decision.
Standard single-point discounted cash flow (DCF) analysis and trailing P/E ratios assume a relatively stable business model. They work when next year’s revenue mix looks roughly like this year’s. They break when it does not.
The dividend discount model illustrates the contrast most sharply: it values a stock by summing the present value of its future dividend stream, an approach that works precisely because mature utilities, banks, and REITs have predictable cash distributions and offers essentially no analytical traction on a business whose future earnings depend on unproven technology milestones.
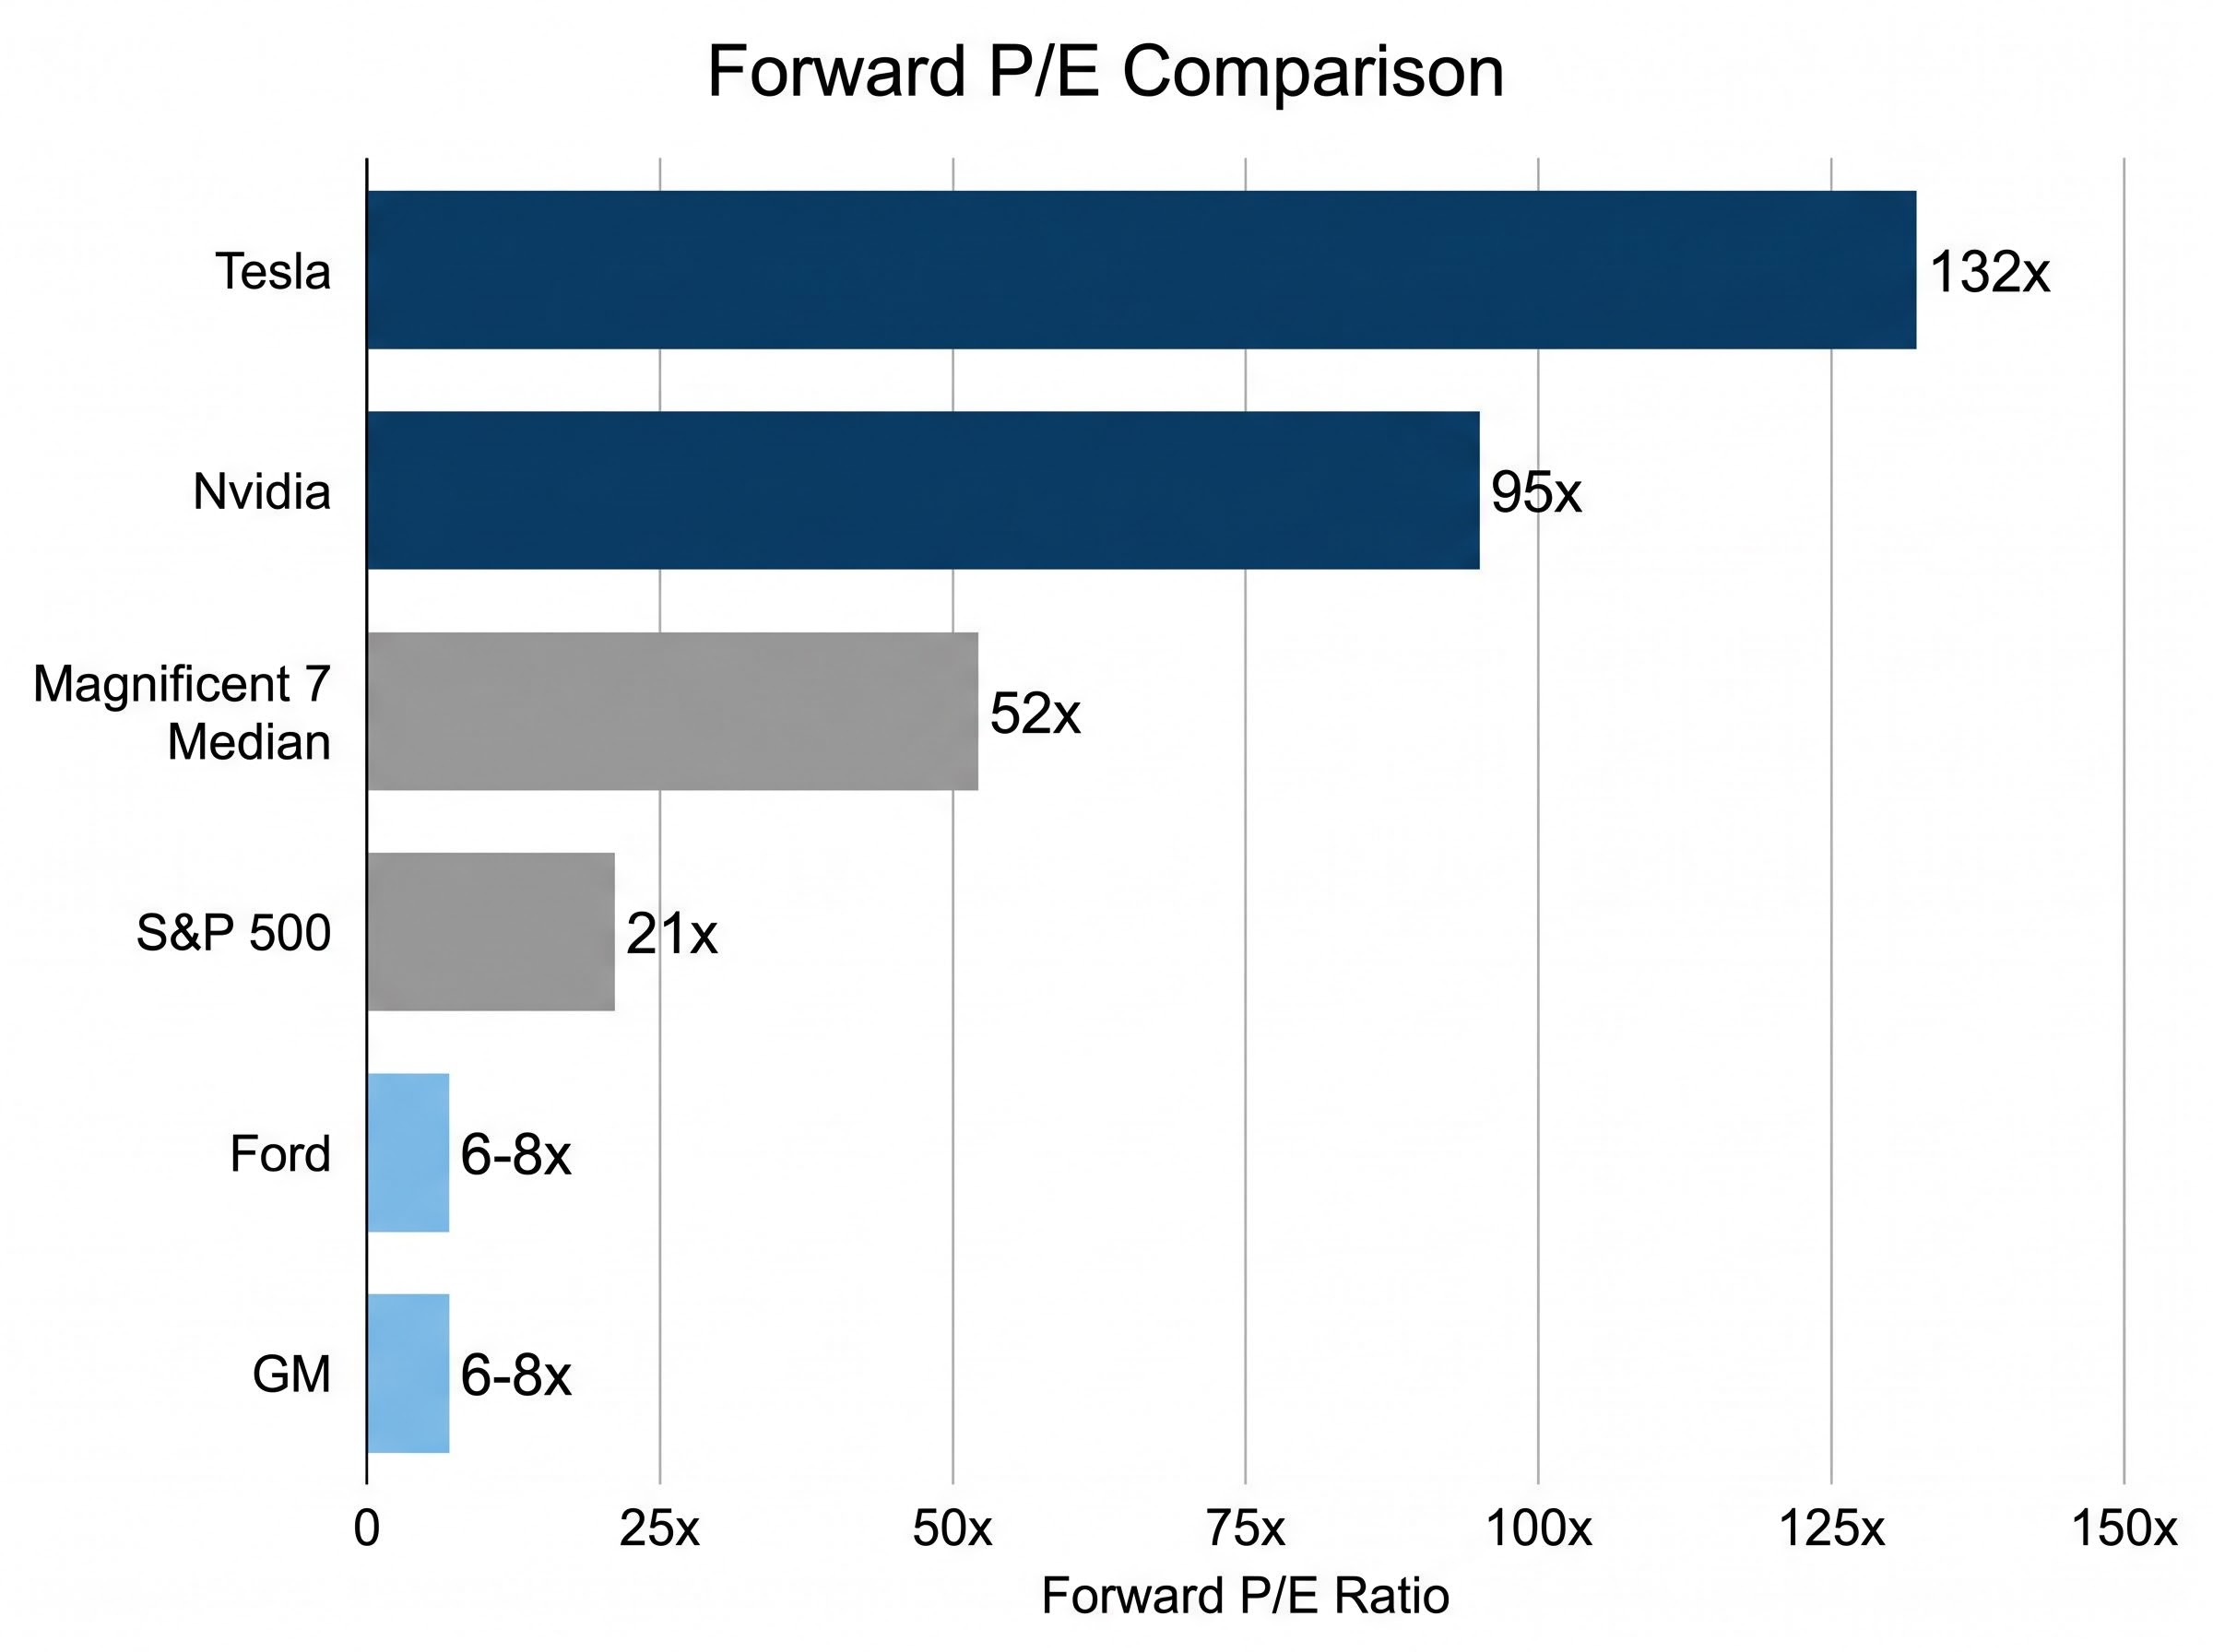
Tesla’s situation is a structural version of this problem. The stock is not priced on automotive earnings alone. It reflects a probability-weighted bet across several business lines, including robotaxi operations, full self-driving software, and the Optimus humanoid robot programme, that do not yet generate meaningful revenue. Traditional automakers such as Ford and GM trade at 6-8x forward P/E because the market can model their future with relative confidence. Tesla’s reported forward P/E of approximately 132x is not simply a premium over those names; it is a categorically different analytical object.
| Company / Index | Forward P/E (Approx.) | What the Multiple Implies |
|---|---|---|
| Tesla | ~132x | Market prices in substantial multi-year earnings growth from business lines not yet at commercial scale |
| Nvidia | ~95x | AI revenue ramp expected to continue; transition-period premium with visible revenue acceleration |
| Magnificent 7 Median | ~52x | High-growth tech consensus with established revenue streams |
| S&P 500 | ~21x | Broad market earnings growth expectations |
| Ford | ~6-8x | Mature auto business with predictable margins and modest growth |
| GM | ~6-8x | Mature auto business with predictable margins and modest growth |
A triple-digit P/E is not a number to accept or reject. It is a question to interrogate: what combination of growth, margins, and new revenue streams must materialise for the current price to deliver a satisfactory return?
That gap between Tesla and traditional automakers is not an anomaly to be arbitraged. It is a signal that the market is pricing a different future business altogether. The wrong valuation tool applied to that signal produces the wrong answer, whether that answer is “obviously overvalued” or “obvious buy.”
The diagnostic problem is clear. A company in strategic transition cannot be captured by a single earnings estimate and a single discount rate. The solution is a toolkit built for uncertainty, one that forces assumptions into the open rather than hiding them inside a model.
Three tools form the core of that toolkit:
The power of this approach is not precision. It is structured honesty. It forces the analyst to name what they believe and at what probability, rather than embedding hidden convictions inside a single discount rate.
Historical precedent supports this methodology. Amazon’s retail-to-AWS transition in the 2000s is widely cited: early valuation models in 2010 assigned AWS a 0-30% probability of reaching significant scale. The stock had fallen approximately 90% before the pivot proved successful, eventually generating a roughly 10x return. The outcome range was always wide, and it should have been modelled as such rather than collapsed into a single estimate. Nvidia’s transition from GPU gaming chips to AI accelerators provides a second case study. During the transition period, Nvidia’s P/E spiked above 100x before the AI revenue ramp was fully established, yet earnings growth ultimately caught up to and exceeded the multiple.
The mechanics are straightforward. Take the current stock price, plug in a discount rate, and solve for the implied earnings growth rate rather than estimating a price from assumed growth. At a forward P/E of approximately 132x, the implied compound annual growth rate (CAGR) in earnings is substantial (the specific figure is model-dependent and requires independent verification).
The exercise forces a direct question: how confident is the investor in that growth rate? If the implied growth rate is achievable only under the most optimistic assumptions, then the stock is pricing the bull case as if it were the base case. That is not a buy or sell signal. It is a stress test that tells the investor exactly what they are signing up for at the current price.
A bull case is not optimism. It is an explicit set of assumptions, named and quantified, that define the conditions under which an investment produces strong returns. The discipline is in stating what must happen, not in believing it will.
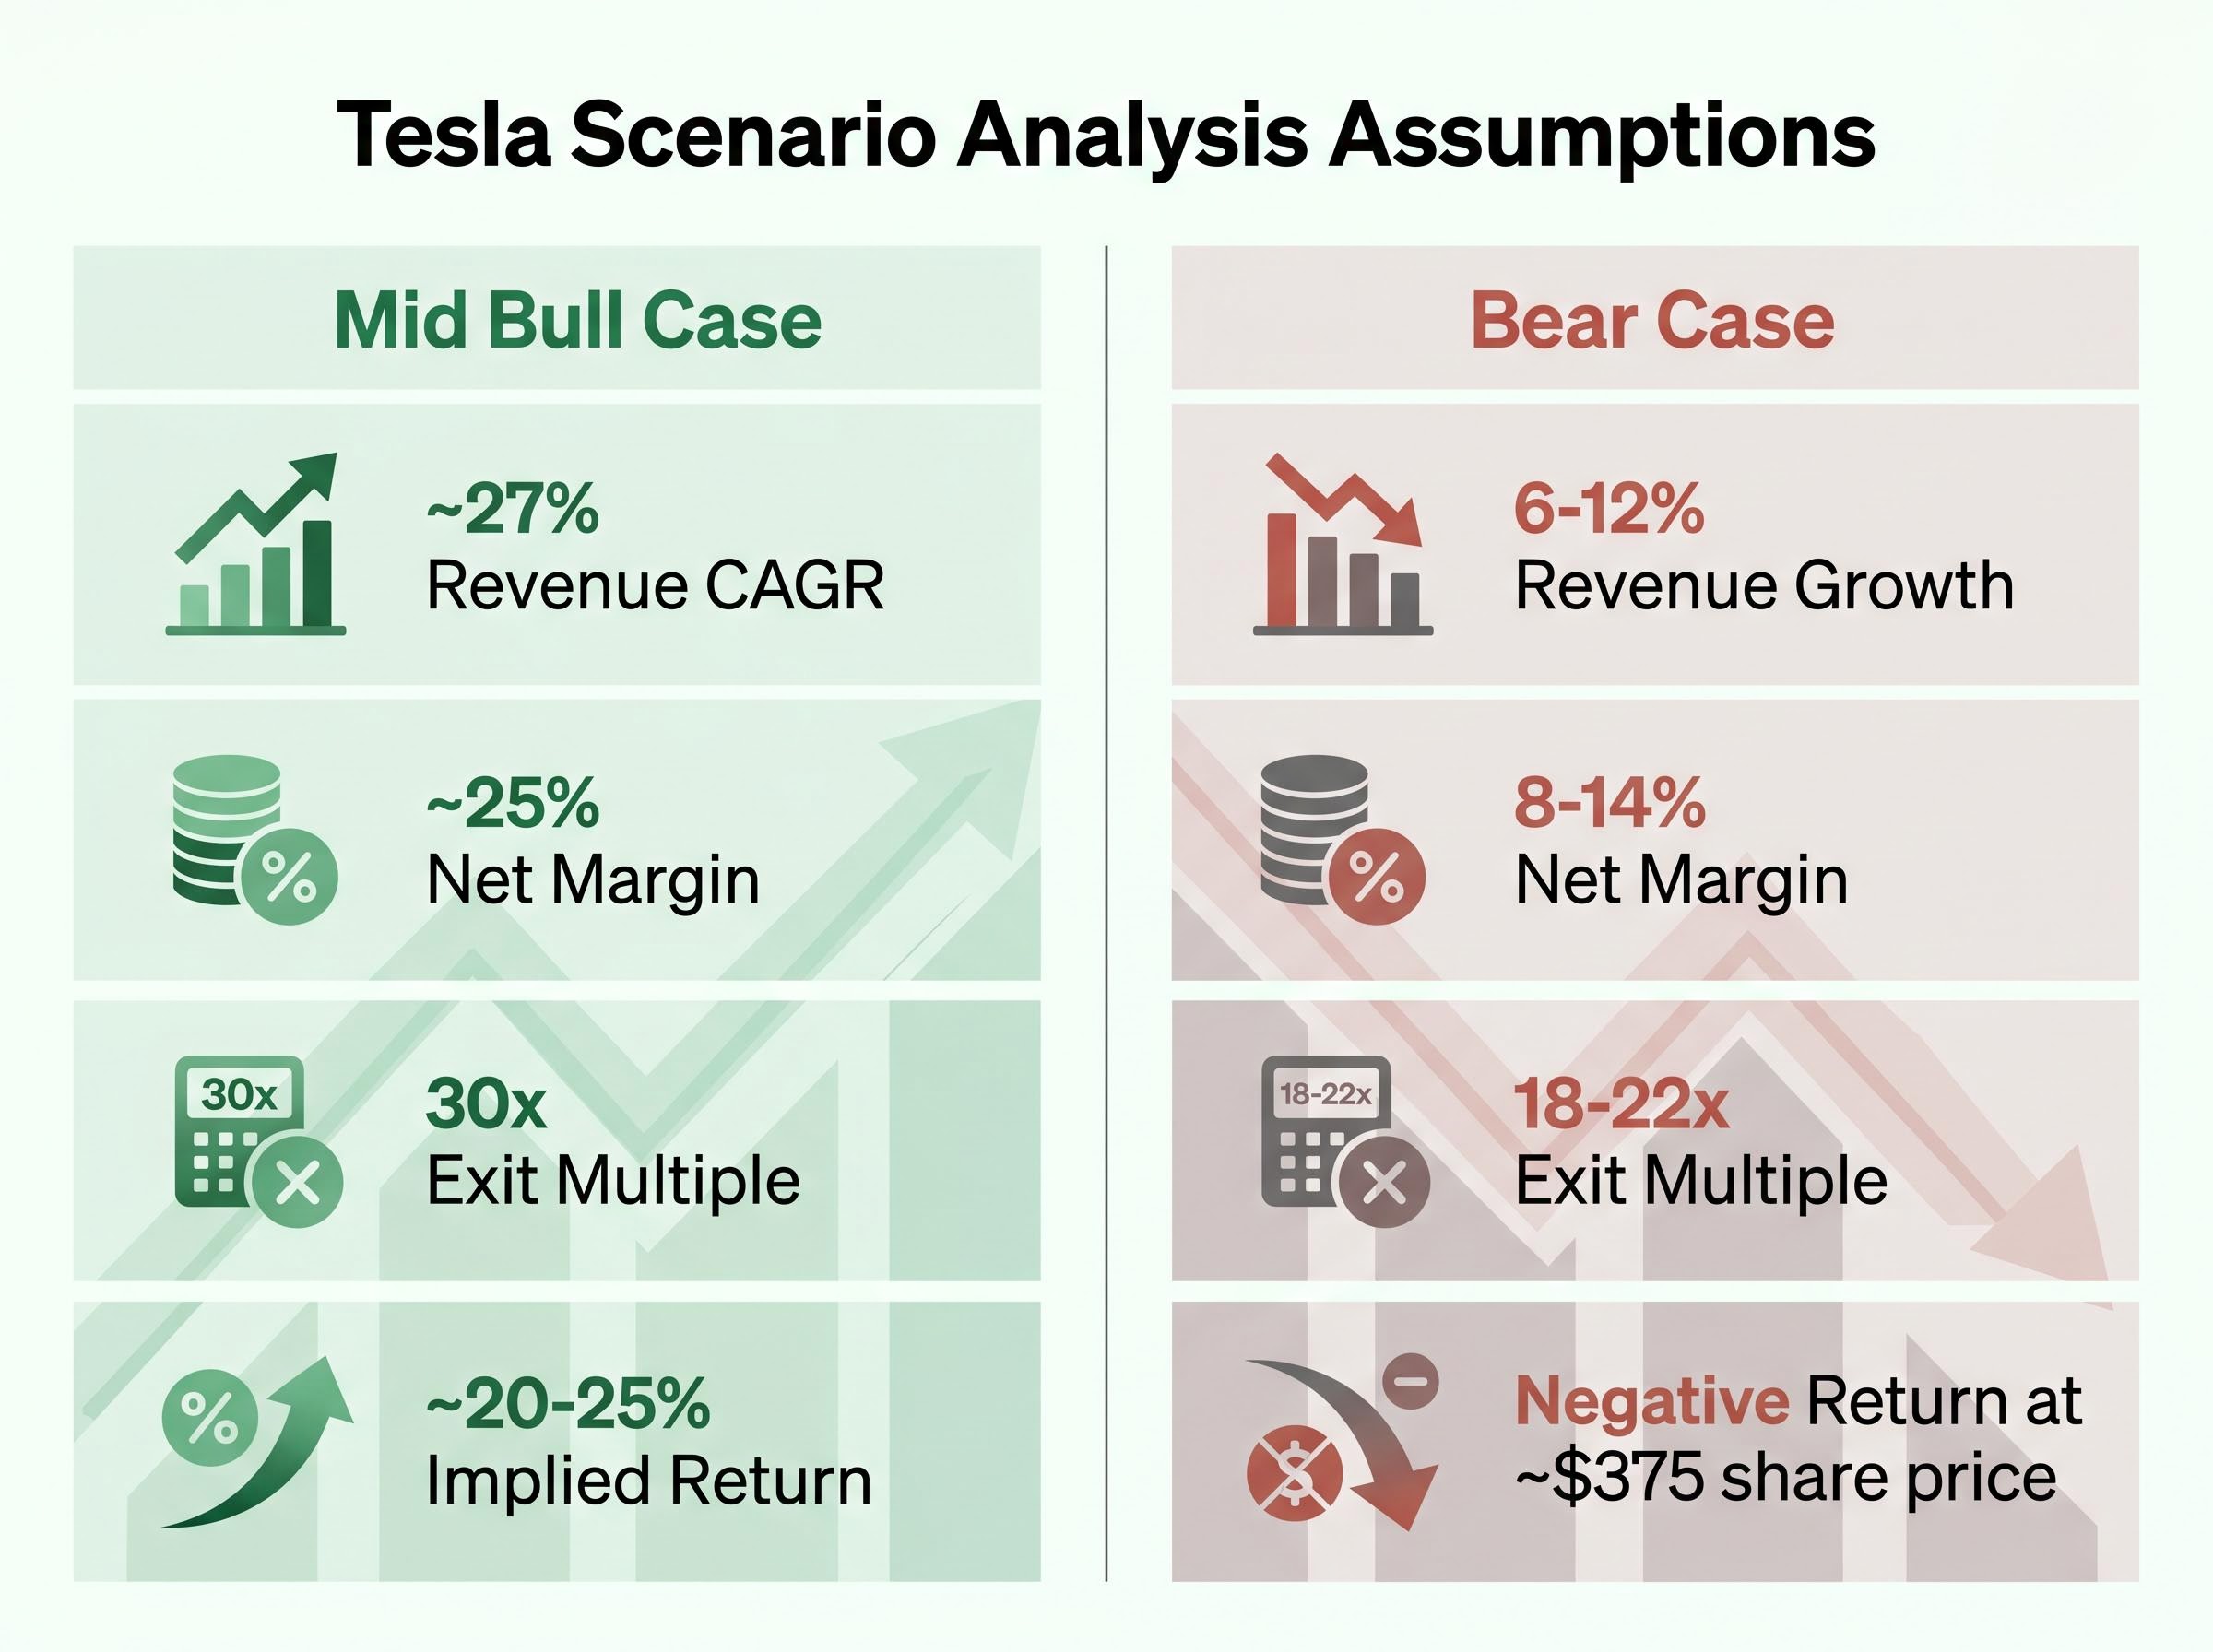
For Tesla, the bull case framework uses three input variables across a range of sub-scenarios: revenue growth of approximately 20-35% annually, net profit margin expansion to 20-30% (compared with the current range of roughly 7-10%), and an exit valuation multiple of 25-35x earnings. At the midpoints (approximately 27% revenue growth, 25% net margin, 30x multiple), estimated annualised returns over a 10-year horizon fall in the range of approximately 11-35%, depending on the specific sub-scenario.
| Bull Sub-Scenario | Revenue Growth (CAGR) | Net Margin | Exit Multiple | Implied 10-Year Return (Annualised) |
|---|---|---|---|---|
| Low Bull | ~20% | ~20% | 25x | ~11% |
| Mid Bull | ~27% | ~25% | 30x | ~20-25% |
| High Bull | ~35% | ~30% | 35x | ~35% |
What must materialise for these numbers to hold? Three specific conditions: the Cyber Cab robotaxi programme must reach commercial scale, full self-driving (FSD) unsupervised approval must be granted in major markets, and Optimus must begin generating meaningful third-party revenue by approximately 2027. Reports indicate robotaxi expansion to Dallas and Houston (in addition to Austin), with autonomous miles driven reportedly nearly doubling in Q1 2026 versus the prior period, and Optimus production at the Fremont facility undergoing conversion with V3 production targeted for late 2025 and third-party commercial availability projected for 2027. All of these milestone figures require independent verification.
Historical precedents lend some analytical credibility. Both the Amazon AWS ramp and the Nvidia AI pivot involved periods where optically extreme multiples were ultimately justified by earnings growth. Both also involved severe drawdowns before the thesis proved out. A bull case is useful only when its preconditions are named, tracked, and used to update probability weights as milestones are confirmed or missed.
Market-wide valuation signals provide the macro backdrop against which individual stock scenario analysis operates: the Buffett Indicator at 223.6% as of May 2026 sits approximately 2.4 standard deviations above its long-run trend, a reading that historically compresses the exit multiples available to investors in the 10-year window that bull case models assume.
The bear case is not a worst-case catastrophe. It is the scenario where Tesla remains a strong electric vehicle business that does not convert its AI and robotics investments into meaningful revenue at the pace or scale the current stock price demands.
Under bear case assumptions (revenue growth of 6-12%, net margins of 8-14%, valuation multiples of 18-22x), all projected return outcomes at approximately $375 per share are negative. The current price provides no margin of safety if the AI pivot stalls.
Four specific mechanisms make this scenario plausible:
At approximately $375 per share, the bear case produces no positive return scenario under any sub-scenario tested. The investor at this price is not being compensated for bearing bear-case risk.
Recognising that negative returns represent the base-case outcome across an entire scenario range is the analytical step that separates disciplined stock valuation analysis from narrative-driven conviction. A strong business and a strong investment are not the same thing when the price already assumes a specific future.
Entry price is not one variable among many. It is the variable that determines whether the base case is sufficient or whether only the bull case produces an acceptable return.
Consider two investors examining the same company with the same thesis. One entered at approximately $100 per share, a price available a few years prior to the current analysis. The other enters at approximately $375, near the current level and not far from the stock’s peak near $450. Both believe in Tesla’s long-term AI transformation. The difference is which scenario each investor needs to be right about.
The reverse DCF from the earlier section applies directly here. At $375, the implied earnings growth rate effectively demands bull-case execution. Forward analyst EPS estimates project more than 5x growth from current levels (note these are consensus estimates requiring independent verification), and 2026 capital expenditure guided above $25 billion means substantial negative free cash flow compounds the entry price sensitivity. An investor at this price is not making a bet on whether Tesla is a good company. They are making a bet that the most optimistic scenario is approximately correct.
The concept of margin of safety, applied to transition stocks, is not about buying at a discount to book value. It is about buying at a price where the base case, not the bull case, produces a satisfactory return.
Growth stock valuations in mid-2026 reflect a wider macro compression that extends well beyond Tesla: technology equities, which account for roughly 42% of the growth category, experienced concentrated losses in Q1 2026 alongside Nvidia, Meta, and Microsoft, creating a sector-level context in which individual scenario models need to account for multiple compression driven by macro conditions rather than company-specific execution failures alone.
Three questions translate this principle into a decision framework:
At approximately $100 per share, even a scenario where Tesla’s AI pivot partially succeeds, where FSD ramps gradually and Optimus generates moderate rather than transformational revenue, may produce strong returns because the starting valuation embeds less optimism.
At approximately $375, partial success may produce flat or negative outcomes. The bull case must largely materialise for the investment to work.
This is the core discipline of valuation-driven investing: the same company, the same thesis, but a radically different risk profile depending on when the purchase is made.
The Tesla case study illustrates a methodology. The methodology itself applies to any company where the market has priced in a transformation that has not yet fully materialised.
Five steps convert the framework into a repeatable process:
For primary data, US retail investors have free access to SEC EDGAR (edgar.sec.gov) for 10-K annual reports, 10-Q quarterly filings, and earnings releases containing the revenue, margin, and capital expenditure data needed for scenario modelling. Yahoo Finance provides historical price data and forward consensus estimates. Company earnings call transcripts offer management guidance on transition milestones.
The SEC investor guidance on reading 10-K and 10-Q filings explains precisely what financial data each document contains, including revenue breakdowns, margin disclosures, and capital expenditure line items that form the raw inputs for the scenario modelling described above.
One US-specific consideration warrants attention: long-term capital gains treatment (holdings exceeding one year) versus short-term rates affects actual after-tax return calculations, particularly when modelling 10-year scenarios in taxable accounts versus IRAs or 401(k)s.
Tesla’s Q1 2026 results beating consensus (EPS of $0.40 versus the $0.35 forecast, gross margin of 21.7% versus the 17% forecast) represent exactly the type of positive base-case milestone update that should trigger a probability weighting review in a living scenario model.
A great company is not automatically a great investment. The question is always whether the price already assumes the great outcome.
This article is for informational purposes only and should not be considered financial advice. Investors should conduct their own research and consult with financial professionals before making investment decisions. Past performance does not guarantee future results. Financial projections are subject to market conditions and various risk factors.
Tesla’s current valuation is not obviously right or obviously wrong. It is a probability-weighted bet, and the investor’s job is to assess whether they are being compensated for the uncertainty at the current entry price.
The framework presented here is a living process, not a one-time calculation. Scenario probability weights should be updated as milestones are confirmed (California permit filings, Cyber Cab commercial deployment, Optimus third-party contracts) or missed (timeline slippage, competitive erosion, regulatory setbacks). Each data point shifts the probability distribution, and each shift changes the answer to the entry price question.
The point of using Tesla as a case study is not to produce a buy or sell verdict. It is to demonstrate that disciplined scenario analysis, applied before entry, is the most consequential thing an investor can do with any company in strategic transition. The methodology transfers directly to any stock where the market has priced in a future that does not yet exist.
Apply the five-step framework to a company in your own portfolio that may be pricing in a transformation. Start with the reverse DCF. The growth rate it reveals may change how you think about what you already own.
For investors who want to apply the scenario analysis methodology to a broader set of stocks beyond Tesla, our dedicated guide to high-multiple stock valuation walks through a six-step portable framework covering ratio calculation, peer benchmarking, DCF scenario building, stress-testing, and probability weighting, with worked examples drawn from Tesla’s live Q1 2026 earnings data.
Stock valuation analysis for companies in strategic transition involves separating the known, established business from speculative future revenue streams and valuing each independently, using tools like sum-of-the-parts modelling, probability-weighted scenario analysis, and reverse DCF rather than a single earnings multiple.
A reverse DCF back-solves the current stock price to reveal the implied earnings growth rate the market has already priced in, rather than estimating a price from assumed growth; investors use it to stress-test whether a stock's valuation requires bull-case execution or whether the base case alone justifies the entry price.
Entry price determines which scenario an investor needs to be correct about; at a higher price, only the most optimistic bull-case assumptions may produce an acceptable return, whereas a lower entry price can make even partial success in a company's transformation sufficient to generate strong returns.
A bear case is built by modelling what happens if the company's transformation stalls, using conservative assumptions for revenue growth, net margins, and exit valuation multiples, then checking whether any projected return is positive at the current share price; if all bear-case sub-scenarios produce negative returns, the stock offers no margin of safety.
US retail investors can access SEC EDGAR (edgar.sec.gov) for 10-K annual reports, 10-Q quarterly filings, and earnings releases containing revenue, margin, and capital expenditure data, while Yahoo Finance provides historical price data and forward consensus estimates for scenario modelling inputs.