Tesla at $390: a Framework for Valuing Transformation-Stage Stocks
6 mins ago

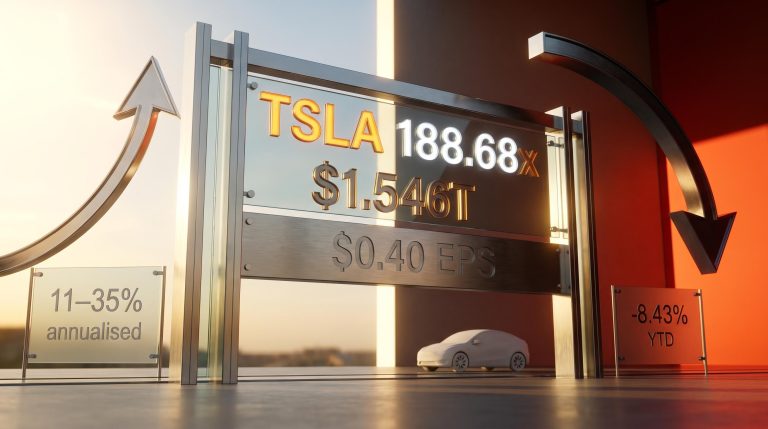
At roughly $392 per share in early May 2026, Tesla trades at approximately 317x trailing earnings. A company that earned $477 million in GAAP net income during the first quarter is valued at more than $1.2 trillion. That gap is not a mistake; it is a forecast. The question every investor conducting stock valuation analysis must answer is whether the entry price justifies the bet embedded in that forecast.
Tesla’s Q1 2026 earnings beat on both revenue ($22.4 billion, up 16% year-over-year) and adjusted EPS ($0.41 versus $0.36 consensus), yet the stock fell 3.56% in the two sessions following the report. Strong results, falling price. The apparent contradiction signals that the market is not primarily trading Tesla on current financials. It is trading on a transformation that has not yet happened, making this one of the most instructive real-world cases for learning how to value a company in transition.
What follows is a full bull-and-bear scenario framework built on Tesla’s actual Q1 2026 numbers: how to construct the inputs, how to model the outputs, and how to use the resulting range to determine whether the price being asked makes the risk worth taking. The methodology applies to any company whose current share price embeds a future not yet visible in the income statement.
Tesla’s Q1 2026 GAAP net income was $477 million. Its market capitalisation exceeds $1.2 trillion. That gap only makes sense if investors are pricing something other than today’s earnings, and the valuation multiples confirm exactly how much of the price is a forward bet.
Tesla’s trailing non-GAAP P/E ratio sits at approximately 317x. For context, that multiple implies investors are willing to pay $317 for every $1 of current earnings, a level that only produces positive returns if earnings grow by multiples of their present base.
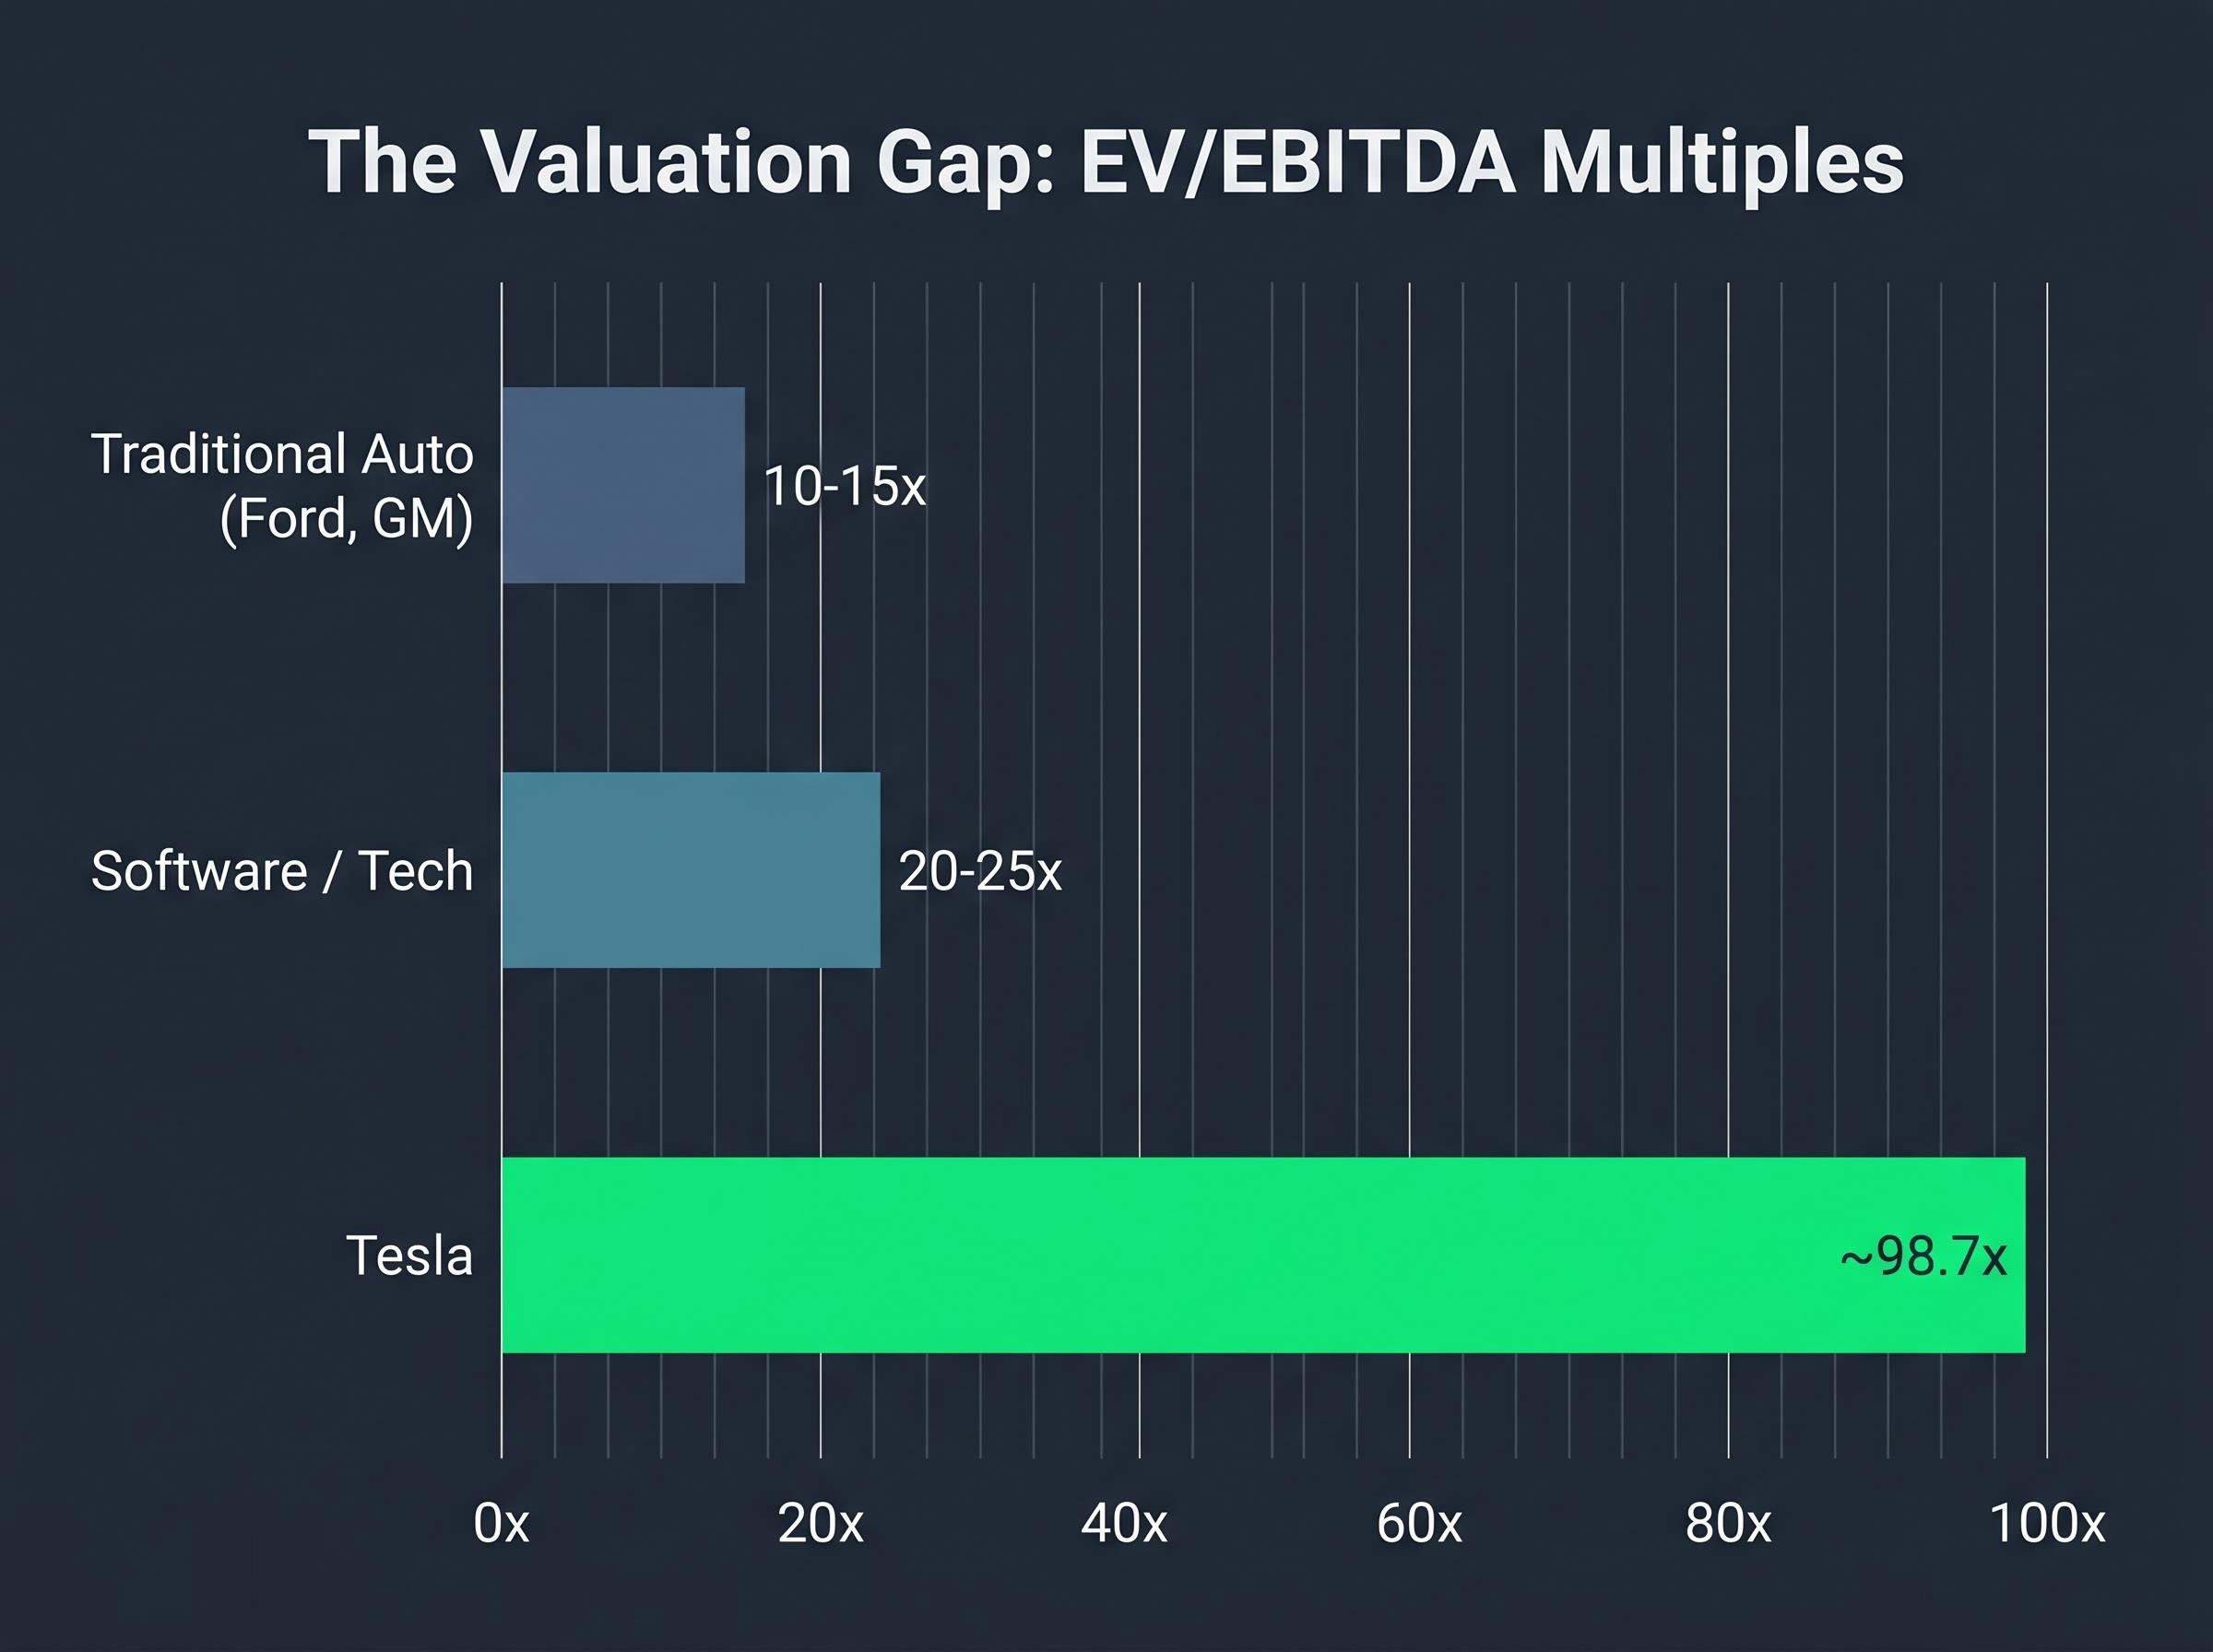
The price-to-sales ratio stands at roughly 14.7x on an approximately $98 billion forward revenue base. The EV/EBITDA multiple, at approximately 98.7x, is where the sector comparison becomes most revealing.
| Sector | Typical EV/EBITDA | What the Multiple Implies |
|---|---|---|
| Traditional Auto (Ford, GM) | 10-15x | Stable cash flows, modest growth expectations |
| Software / Tech | 20-25x | Recurring revenue, margin expansion, scalability |
| Tesla | ~98.7x | Full business model transformation: AI, autonomy, robotics |
BYD has surpassed Tesla as the world’s largest EV producer by volume. Automotive margins have compressed from peak levels. The core car business is under structural pressure, which means the entire valuation premium is dependent on the AI and robotics narrative delivering.
Understanding why a stock trades at a premium to its current earnings is the first step in any valuation exercise. Skip it, and the wrong framework gets applied from the start.
Investors wanting to situate Tesla’s 317x multiple within the broader US market context will find our full explainer on US equity valuation signals, which examines the Buffett Indicator at 223.6%, the equity earnings yield versus Treasury spread, and the near-absence of margin-of-safety buying opportunities across the index as of May 2026.
Scenario analysis is not guessing. It is a disciplined translation of business assumptions into price outcomes, where every input is an explicit choice the analyst must own. Three core inputs drive any earnings-based valuation: revenue growth rate, net profit margin, and the exit valuation multiple. Each is a distinct assumption, not a derivation from the others.
Damodaran’s equity valuation framework for high-growth firms establishes that the critical inputs in any scenario analysis are growth rate, margin, and exit multiple, with the combination of those three inputs determining the full range of plausible price outcomes rather than any single point estimate.
| Input | Bull Case | Bear Case |
|---|---|---|
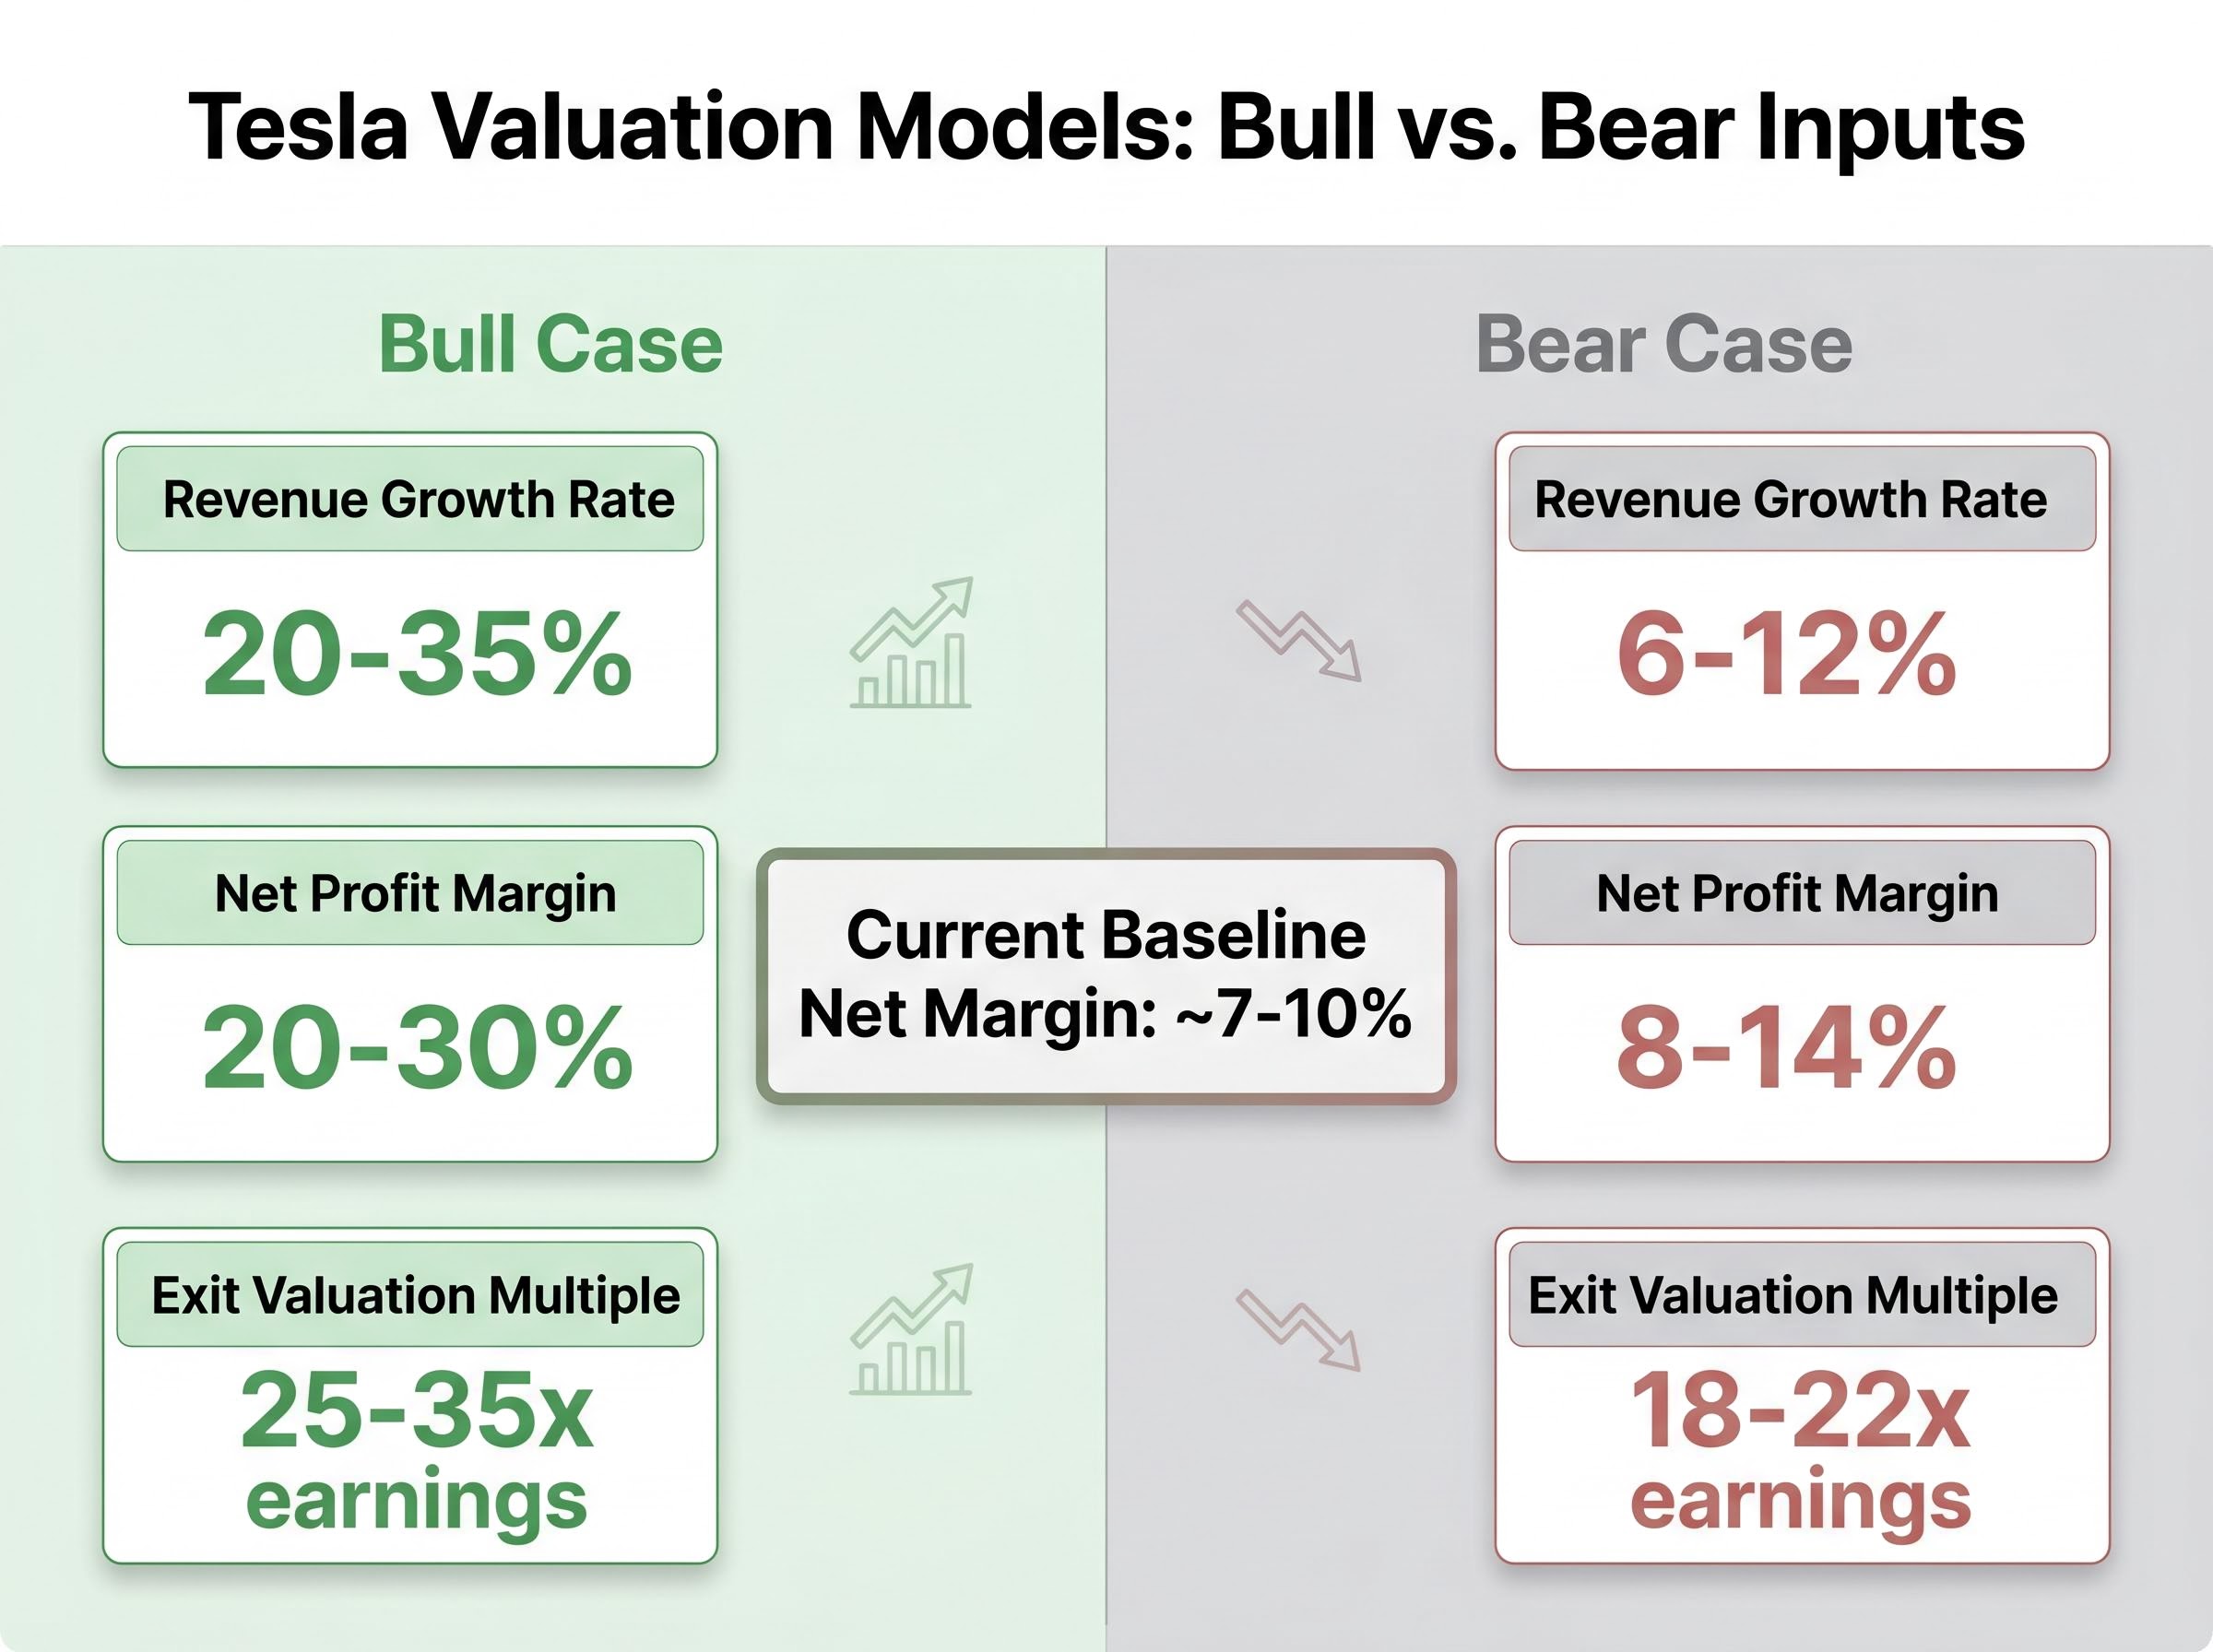
| Revenue Growth Rate | 20-35% (midpoint ~27%) | 6-12% (midpoint ~9%) |
| Net Profit Margin | 20-30% | 8-14% |
| Exit Valuation Multiple | 25-35x earnings | 18-22x earnings |
Tesla’s current net margins sit at approximately 7-10%, the baseline from which both scenarios diverge. Forward analyst EPS estimates project more than 5x growth from current levels, illustrating how much transformation the consensus already embeds.
The purpose of running both scenarios is not to predict which one happens. It is to map the range of outcomes and price the probability-weighted risk across that range.
Entry price is the one variable the investor controls entirely, and it is the most consequential lever in the return calculation. Even a correct bull case outcome can produce poor returns if the investor overpaid at entry.
Consider the difference between purchasing Tesla near $100 (where it traded a few years prior) versus near $400. The company, the strategy, and the transformation narrative are identical. The return profile is not.
Tesla peaked near $450. Investors who bought at that level may still face muted or negative returns even as the company executes on portions of its transition thesis. The price paid at entry determines how much of the upside scenario must materialise before the investment breaks even.
The bull case is not a number on a spreadsheet. It is a series of concrete operational milestones, each of which must be cleared for the scenario to materialise. At its core, the bull case requires Tesla to achieve:
There is current operational evidence supporting portions of this thesis. Cybercab mass production began at Giga Texas in April 2026. Unsupervised FSD has expanded to Austin, Dallas, and Houston. Autonomous vehicle miles driven nearly doubled in Q1 2026 versus the prior period. Tesla’s CFO guided for capital expenditure exceeding $25 billion in 2026, signalling that the company itself is committing substantial capital to the transformation.
The Tesla valuation debate ultimately hinges on a single unresolved question: whether the $25 billion capital expenditure commitment accelerates proof of autonomous and robotics revenue, or whether it deepens the funding pressure at precisely the moment execution credibility matters most.
The execution risk, however, is visible in the historical record. Elon Musk projected one million robotaxis operating by end of 2020 (announced in 2019). He projected Optimus deployment readiness for 2022 (announced in 2021). Both timelines were missed significantly. Core innovations have eventually materialised, but the cadence of delivery has consistently lagged public projections.
Under bull case assumptions, estimated annualised returns range from approximately 11% to 35% over a 10-year horizon.
The estimated probability of the full bull case materialising is approximately 5-10%. This does not mean the bull case is impossible. It means an investor paying today’s price is substantially reliant on a low-probability outcome delivering the returns that justify the premium.
The bear case is not a catastrophe. It is a scenario where Tesla remains a strong EV manufacturer, maintaining margins above Ford and GM, but does not generate meaningful autonomous or robotics revenue within the projection window. Under those assumptions (revenue growth 6-12%, net profit margins 8-14%, exit multiple 18-22x), every projected return outcome at approximately $375-$392 per share is negative.
That finding is significant. It means the current stock price embeds a structural premium that disappears entirely if the transformation does not occur. At today’s entry price, the investor is not being compensated for downside risk; the entire return depends on the upside scenario.
Q1 2026 data provides several operational signals that bear case proponents cite:
Waymo currently operates paid robotaxi services in five U.S. cities and has entered a commercial partnership with Uber for ride-hailing integration. A London launch is targeted for Q4 2026, which would mark its first international commercial deployment.
This operational footprint provides a concrete data point for how long the regulatory and operational runway to commercial AV scale actually is. Waymo’s multi-city presence, revenue-generating autonomous miles, and regulatory approvals represent a benchmark against which Tesla’s timeline assumptions can be measured. The competitive moat in autonomous vehicles is being contested by a well-capitalised incumbent with a proven deployment record, and Tesla has yet to match that deployment breadth.
Commercialisation timelines in capital-intensive technology sectors have a consistent historical pattern: regulatory approval estimates compress the uncertainty into a single date, but the operational and capital requirements on either side of that date create the real return-distribution problem for investors holding the stock through the transition.
The framework is built. The scenarios are populated. The decision logic that connects them to the price being asked today follows three steps:
Market-level warning signals, including the S&P 500 hitting an all-time high of 7,173.91 on 27 April 2026 while energy price pressures and recession probability estimates from Goldman Sachs and JPMorgan remained firmly elevated, create the macro backdrop against which any individual stock’s probability-weighted return must be compared to the index alternative.
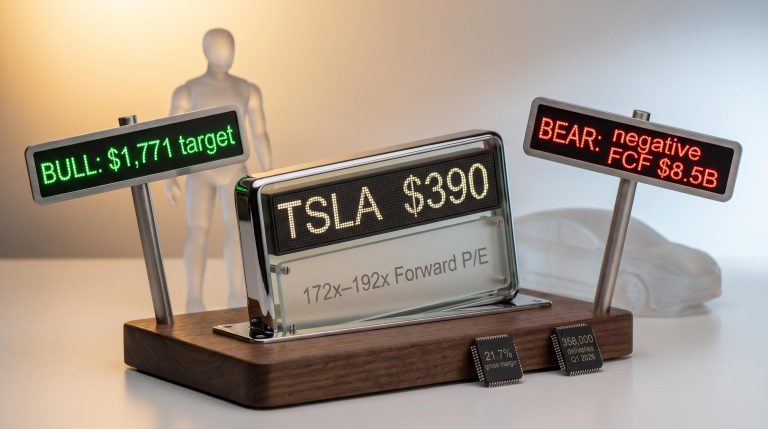
The consensus analyst price target for Tesla sits at approximately $398.42 as of May 2026, with a high-end target of $600. Even among professional analysts, the range is wide. That dispersion itself is informative: it reflects genuine uncertainty about which scenario will materialise, not a lack of analytical rigour.
Investors who bought near $100 and investors who bought near $450 hold the same company. They do not hold the same risk/reward profile. The difference is entry price alone.
Entry price is the one variable the investor fully controls. Every other input in the framework, revenue growth, margins, competitive dynamics, regulatory outcomes, depends on external factors. The price paid at purchase is a choice.
The same company with the same future earnings can produce dramatically different investor returns depending solely on the price paid at entry. This is the concept of price sensitivity in valuation, and it operates through a specific mechanism: the multiple paid at purchase becomes the compression or expansion that the investor must survive over the holding period.
An investor who purchased Tesla at approximately $100 is in a fundamentally different position than one who paid $450, even if both hold shares in the same company executing the same strategy. At a low entry price, partial scenario success can still produce acceptable returns. At a high entry price, the investor requires near-full scenario success to achieve positive returns, concentrating all the risk at the tail of the probability distribution.
| Entry Price | Bull Case: Implied 10-Year Annualised Return | Bear Case: Implied 10-Year Annualised Return |
|---|---|---|
| ~$100 | Strong positive (significant upside cushion) | Modest positive to flat (valuation cushion absorbs compression) |
| ~$392 (current) | ~11-35% annualised (requires full scenario execution) | Negative (current premium disappears entirely) |
| ~$450 (near peak) | Below bull-case range (higher starting multiple compresses returns) | Materially negative (deepest loss scenario) |
Tesla analyst EPS estimates declined more than 90% from their peak before recovering, illustrating how much the earnings base can shift under a company in transition. Paying 317x trailing earnings requires the investor to be correct about future earnings expansion, not current performance.
When a stock trading at 317x earnings eventually re-rates to a more normalised multiple, say 50x or even 35x, that compression alone creates a headwind to returns that underlying earnings growth must overcome. If Tesla’s forward estimates project more than 5x EPS growth, a significant portion of that growth may be absorbed simply by the multiple contracting from current levels to something closer to the software/tech peer range.
This is not a bearish argument. It is arithmetic. The higher the entry multiple, the more earnings growth the investor needs just to break even, before any real return is generated.
Tesla’s current price requires an investor to take a specific, quantifiable stance on the probability of a low-probability bull case. The methodology for doing that honestly is scenario analysis anchored to entry price sensitivity.
Q1 2026 results serve as a reminder of the dynamic at work: 16% revenue growth, 21.7% gross margin, and a beat on both top and bottom lines did not prevent a post-earnings decline. The market is forward-looking, not backward-looking. A capital expenditure commitment exceeding $25 billion for 2026 confirms the transformation bet is real and capital-intensive.
The methodology applies universally. Any company whose stock price embeds a transformation not yet visible in earnings, whether in AI, biotechnology, clean energy, or another sector, demands the same three-input framework and the same entry price discipline.
Before buying any transition-stage company at a premium multiple, an investor should be able to clearly answer three questions:
Investors who cannot answer those questions clearly should treat that uncertainty as a signal, either to reduce position size or to revisit the entry price at which the risk/reward equation changes.
This article is for informational purposes only and should not be considered financial advice. Investors should conduct their own research and consult with financial professionals before making investment decisions. Past performance does not guarantee future results. Financial projections are subject to market conditions and various risk factors.
Scenario analysis in stock valuation is a disciplined method of translating business assumptions into price outcomes by modelling three core inputs: revenue growth rate, net profit margin, and exit valuation multiple. It maps a range of plausible outcomes rather than relying on a single point estimate.
Entry price is the one variable an investor fully controls, and it determines how much of the upside scenario must materialise before the investment breaks even. Buying the same company at a lower price can produce positive returns even if the bull case only partially materialises, while a high entry price concentrates all risk at the tail of the probability distribution.
A 317x trailing P/E ratio means investors are paying $317 for every $1 of current earnings, a level that only produces positive returns if earnings grow by multiples of their present base. It signals the stock price is primarily a forward bet on business model transformation rather than a reflection of current financial performance.
To calculate a probability-weighted expected return, assign an explicit probability to each scenario (such as bull and bear cases), multiply the estimated return in each scenario by its assigned probability, and sum the results. If the high-return bull case carries only a 5-10% probability and the bear case produces negative returns at much higher probability, the weighted expected return may be low or negative.
Multiple compression occurs when a stock re-rates from a high valuation multiple to a lower, more normalised one, creating a headwind that underlying earnings growth must overcome before any real return is generated. For a stock trading at 317x earnings, even substantial EPS growth may be partially or fully offset if the multiple contracts toward the software or tech peer range of 20-25x.