Tesla at $390: a Framework for Valuing Transformation-Stage Stocks
6 mins ago

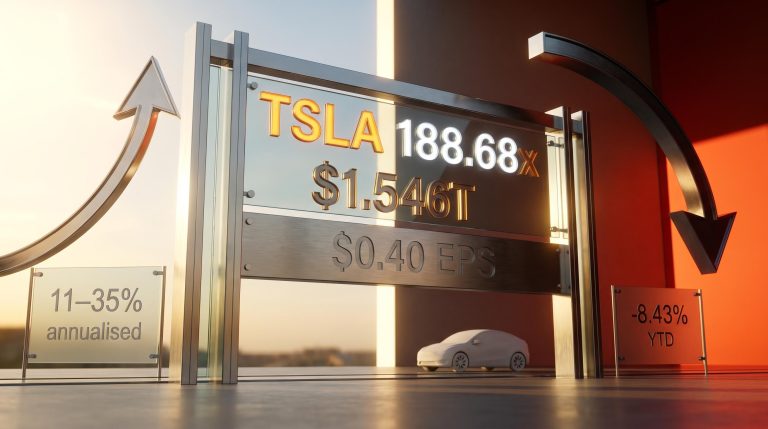
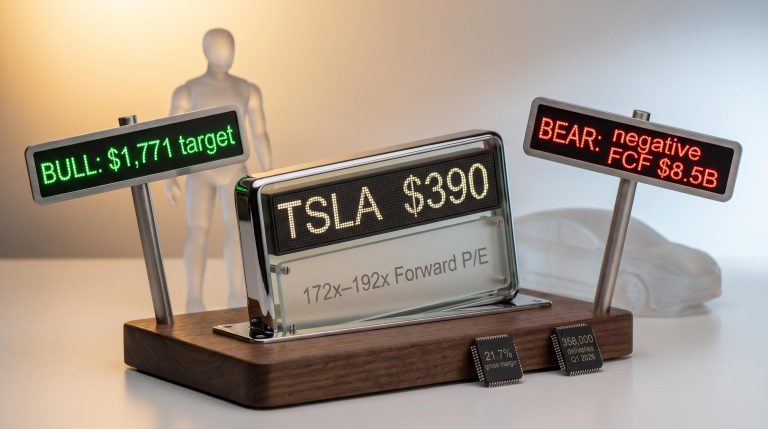
At Tesla’s current price of roughly $410, two credible analysts have targets that sit at opposite ends of the same spectrum: $403 and $1,771. That gap is not noise. It is the entire problem of valuing a company mid-transformation, and it illustrates why stock valuation analysis for growth-oriented companies demands a different toolkit than backward-looking multiples alone.
Tesla’s Q1 2026 earnings beat consensus on both revenue and adjusted earnings per share, yet the stock fell the following session. The market’s reaction reflects a tension that applies far beyond a single automaker: when a share price is built on a future that has not arrived yet, how does an investor decide whether the price is reasonable? This article uses Tesla’s actual Q1 2026 numbers, analyst targets, and scenario inputs as a worked case study to teach a transferable methodology. The framework covers how to construct bull and bear cases, stress-test assumptions across three variables, and understand why the price paid at entry shapes every outcome that follows.
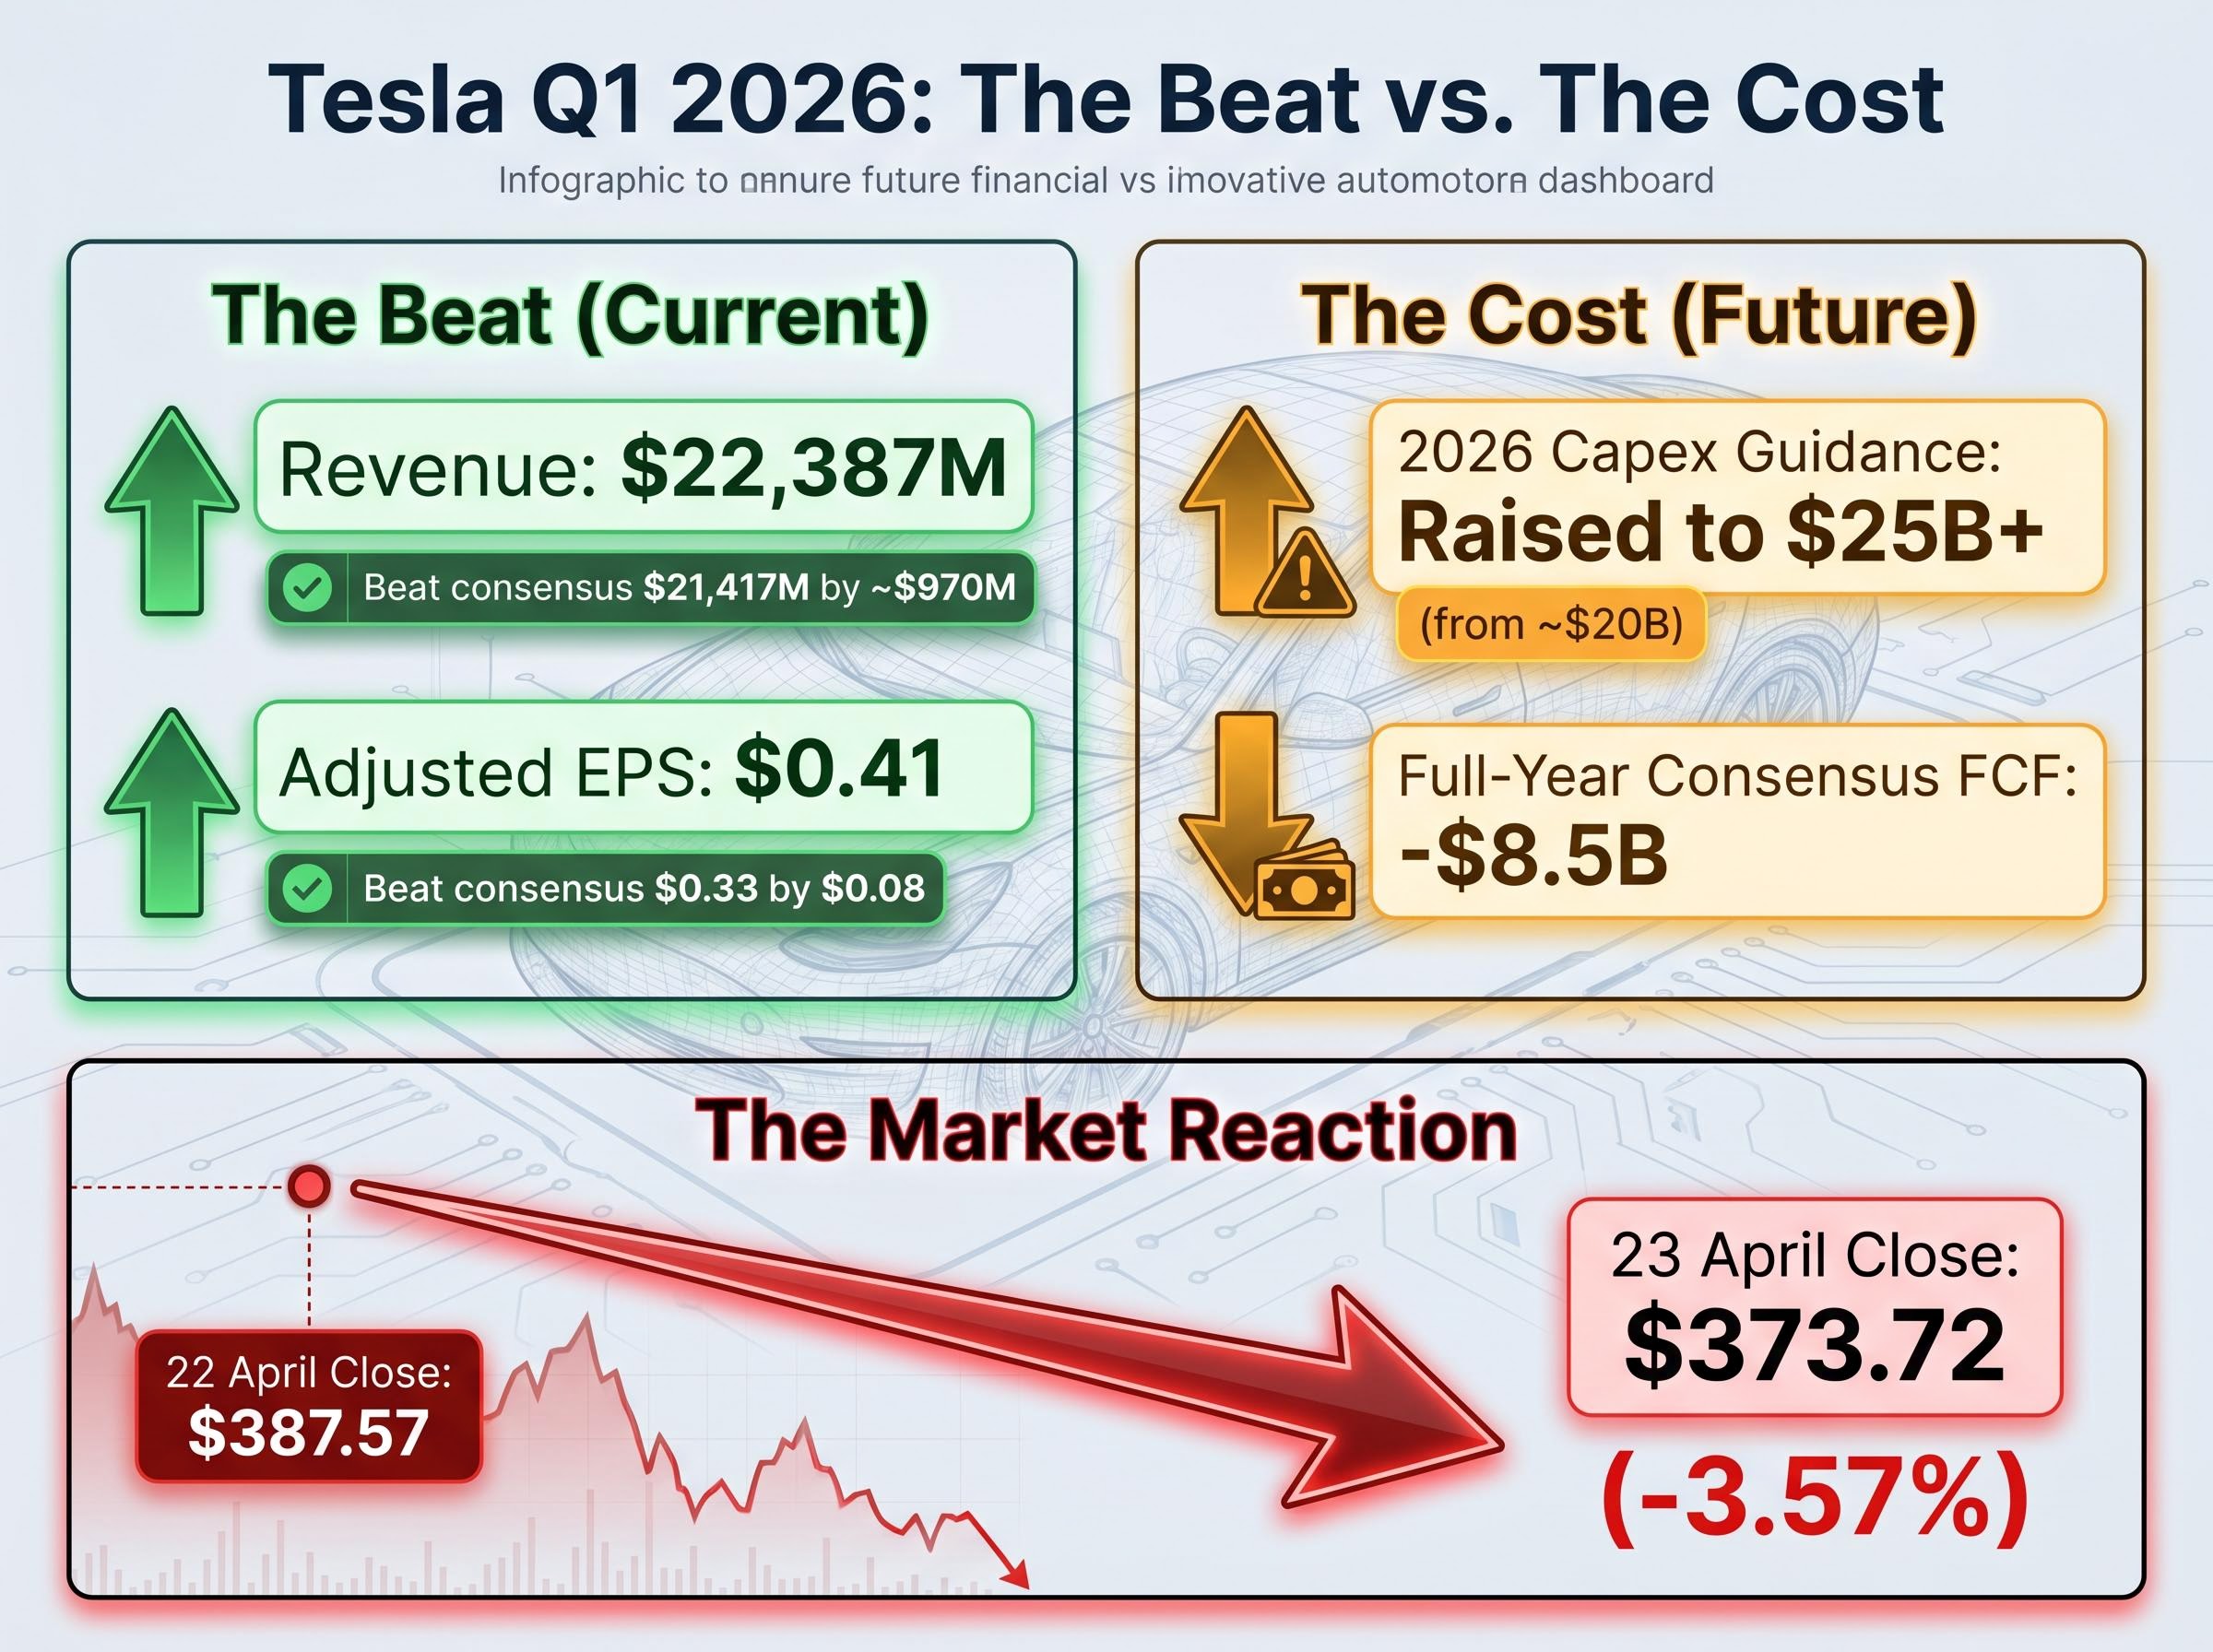
Tesla reported Q1 2026 revenue of $22,387M against an official consensus estimate of $21,417M, a beat of approximately $970M. Adjusted earnings per share came in at $0.41 versus the $0.33 consensus. By any near-term measure, the quarter delivered.
The stock fell anyway. On 23 April 2026, shares closed at $373.72, down -3.57% from the 22 April pre-earnings close of $387.57.
Implied volatility crush helps explain a persistent puzzle in growth stock investing: a company can beat consensus on every reported metric and still see its share price fall in the session that follows, because the options market had already priced in a magnitude of surprise that the actual results, however strong, did not fully deliver.
The four post-earnings signals that moved the market told a split story:
Tesla’s next-twelve-months (NTM) price-to-earnings ratio sits at 180.4x. Auto peers BYD and GM trade at roughly 7.2x EV/EBITDA. That spread is the market’s way of saying Tesla’s share price is not a bet on the car business.
The revenue and EPS beats confirmed the core auto business is recovering. The capex and FCF guidance revealed the cost of the transformation bet. The share price fell because, at current levels, recovery in the existing business is not what investors are paying for.
Standard valuation metrics, price-to-earnings ratios, EV/EBITDA multiples, are anchored in what a company earns now or in the near term. For a business in strategic transition, these metrics describe the present accurately but the future poorly. When the question is not “what does this company earn?” but “what kind of company is this becoming?”, the analytical task shifts from multiple comparison to forward scenario construction.
The distinction matters because different business types carry fundamentally different economics. An automotive manufacturer is capital-intensive, operates on single-digit margins, and trades at cyclical multiples. An AI or software platform business, at scale, is capital-light, high-margin, and commands recurring-revenue multiples that can be an order of magnitude higher.
Software platform multiples have been repriced materially in 2025-2026 as AI infrastructure costs compress the margins that traditionally justified premium revenue multiples, meaning the 30-50x earnings range the bull case assigns to a fully realised Tesla AI platform rests on assumptions about margin sustainability that the broader SaaS sector is currently failing to deliver.
Tesla’s last-twelve-months (LTM) EBIT margin sits at 4.9%, down from a 2022 peak of 16.8%. Under an auto-only framework, the stock looks expensive by any conventional measure. Wedbush’s $600 target and ARK Invest’s $2,000+ by 2030 target reflect a different set of assumptions entirely: that Tesla will become something other than an automaker.
| Business Type | Margin Profile | Capital Intensity | Appropriate Multiple | Primary Value Driver |
|---|---|---|---|---|
| Traditional Auto | 5-10% net margin | High | 5-10x EV/EBITDA | Unit volume, pricing power |
| Auto Plus AV/Software | 12-20% blended margin | Medium (transitioning) | 15-30x earnings | Software attach rate, AV deployment |
| Pure AI/Robotics Platform | 25-40% net margin at scale | Low at maturity | 30-50x earnings | Platform adoption, recurring revenue |
When a stock trades at a multiple far above what its current business justifies, the difference represents embedded optionality: the probability-weighted value of future business lines that do not yet generate cash flow. In plain terms, it is the portion of the share price that is a bet on what the company might become, not what it earns today.
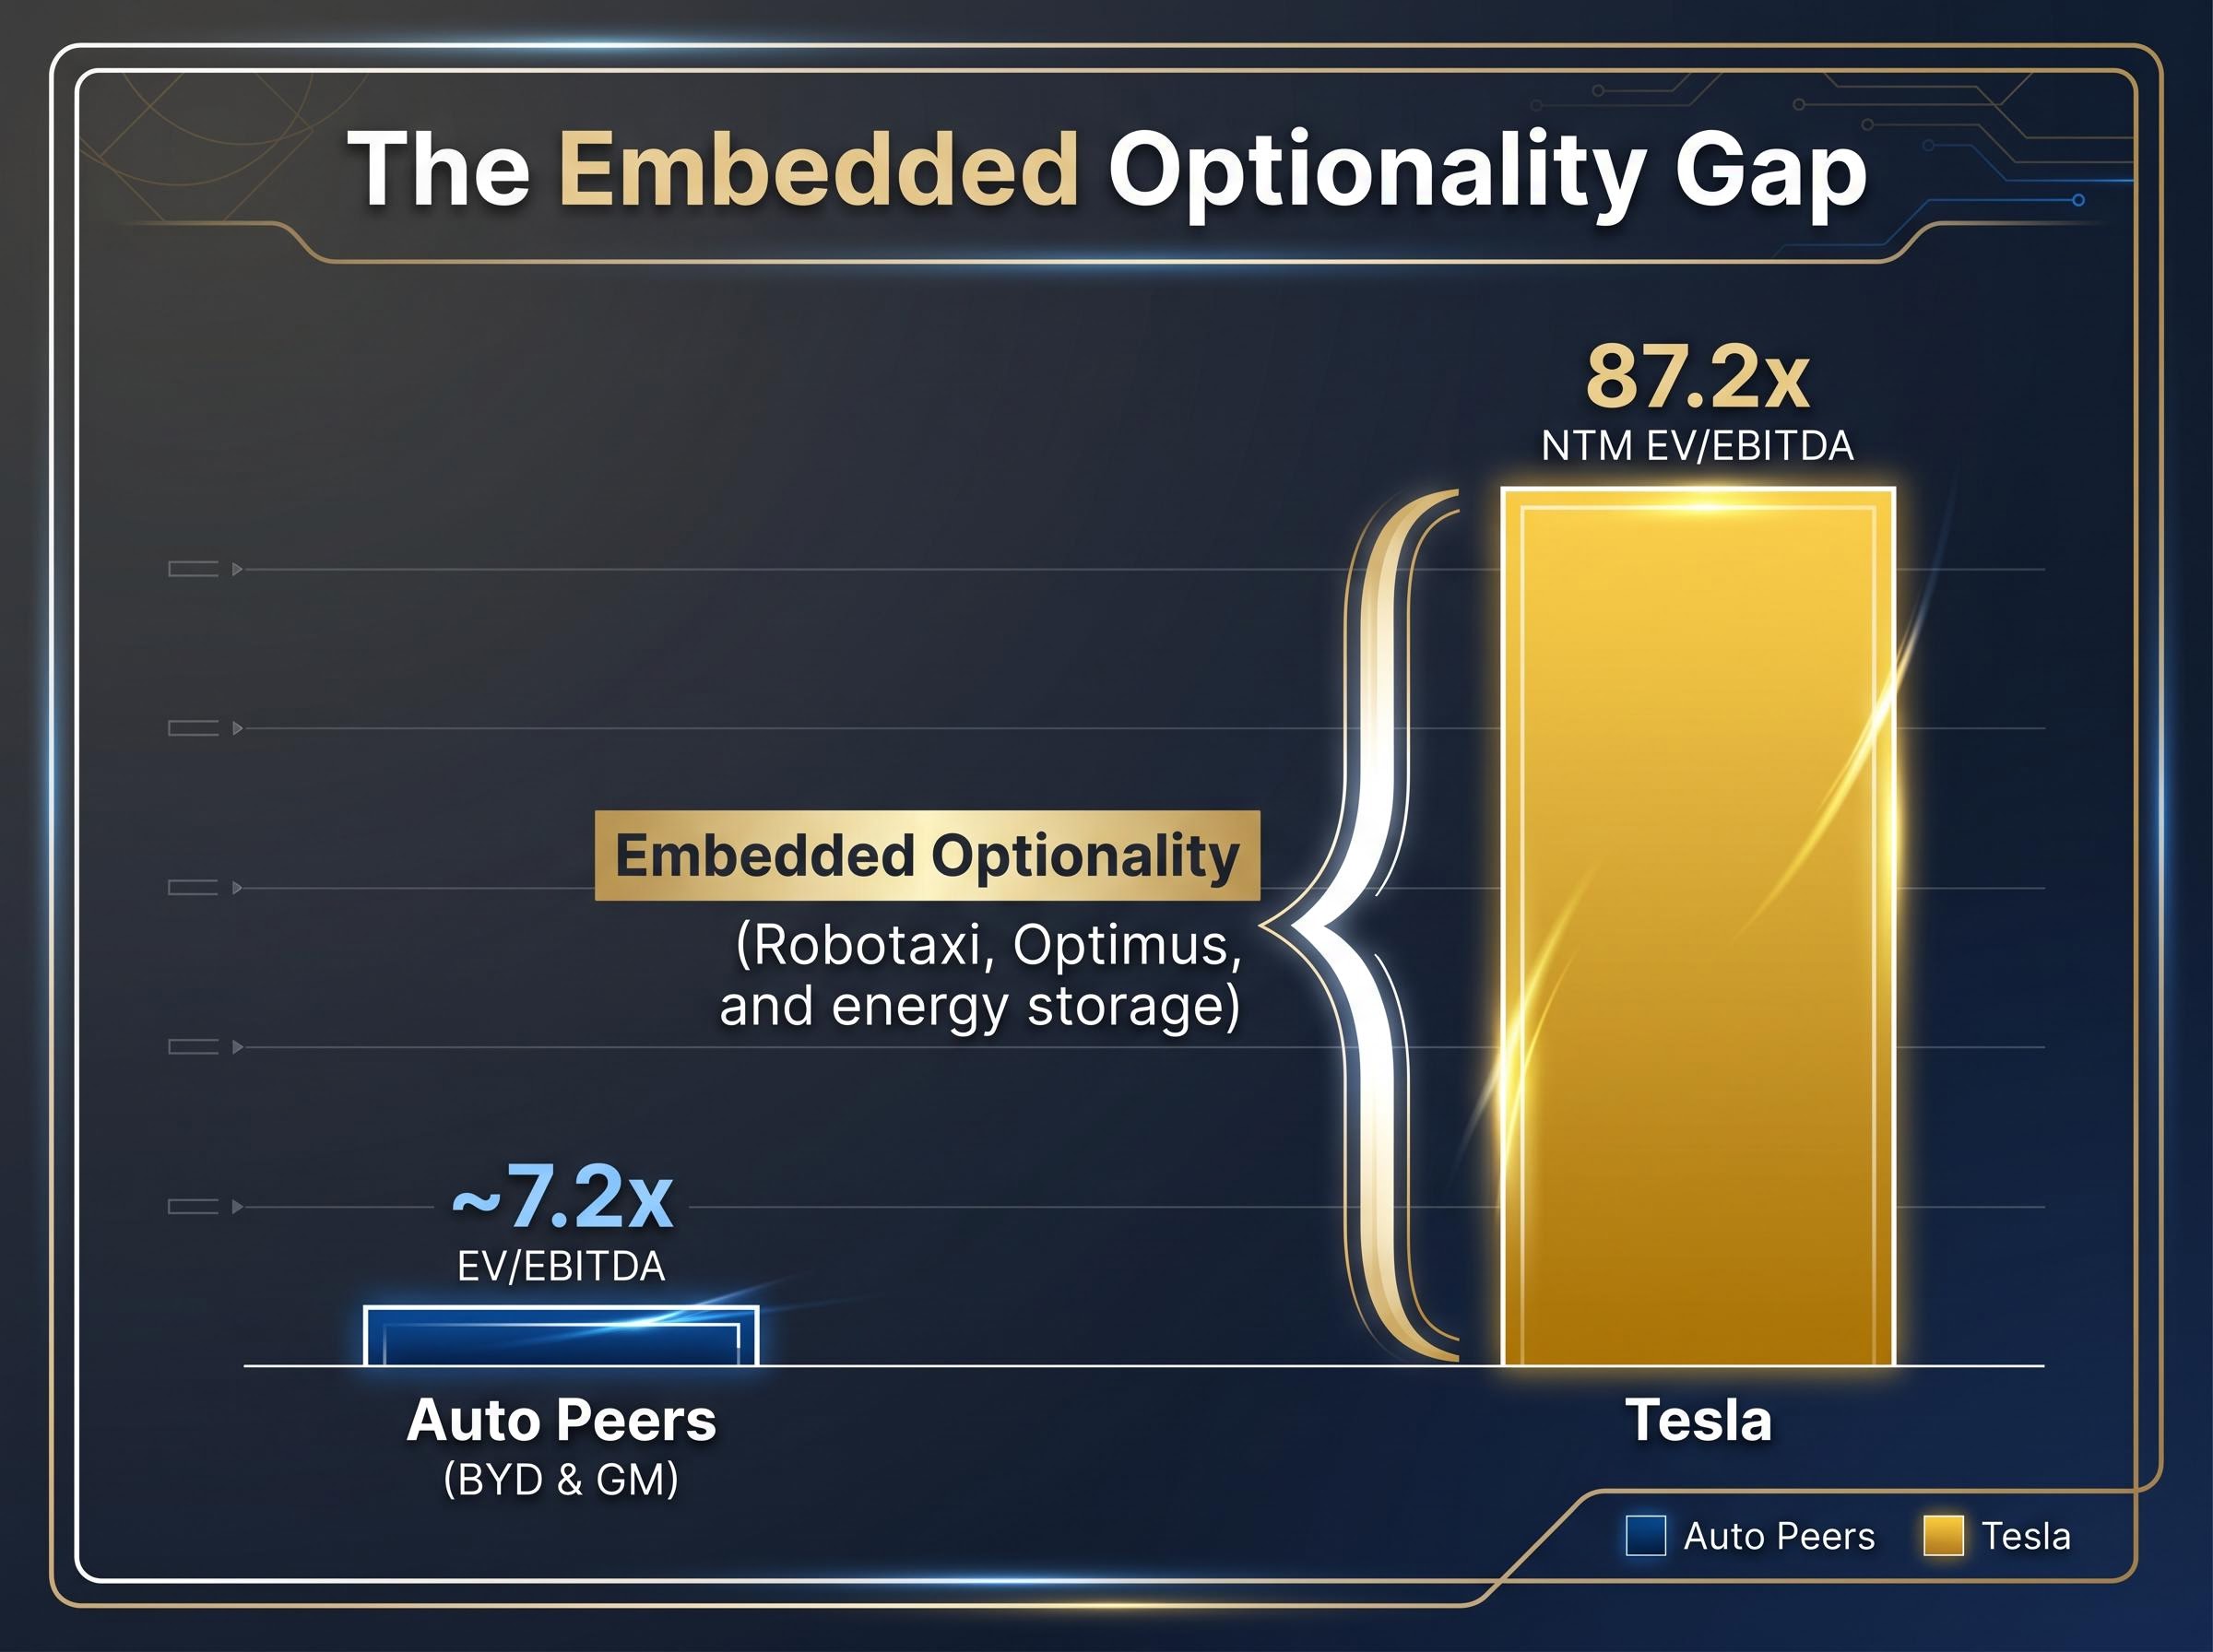
For Tesla, the gap between what auto-only fundamentals would imply (something closer to 7.2x EV/EBITDA) and where the stock actually trades (87.2x NTM EV/EBITDA) is the market’s embedded probability assignment for Robotaxi, Optimus, and energy storage reaching scale. The investor’s job is to assess whether that implicit probability is reasonable, too generous, or too stingy. The next three sections provide the tools to make that assessment.
Scenario analysis for a transitioning company reduces to three primary inputs projected across a time horizon, typically 10 years: the revenue growth rate, the net profit margin at maturity, and the valuation multiple applied at exit. Small changes in any one of these compound across a decade into radically different outcomes.
The bull case for Tesla assumes the AI and robotics businesses reach scale. The bear case assumes they do not, and Tesla remains principally an automaker competing on thinning margins.
| Variable | Bear Case | Bull Case | Why It Differs |
|---|---|---|---|
| Revenue Growth (annualised) | 6-12% (midpoint ~9%) | 20-35% (midpoint ~27%) | Bear assumes auto-only growth; bull includes Robotaxi and Optimus revenue streams |
| Net Margin at Maturity | 8-14% | 20-30% | Bear reflects auto-industry margins; bull reflects software/platform economics |
| Exit Multiple (P/E) | 18-22x | 25-35x | Bear applies mature industrial multiple; bull applies technology platform multiple |
| Implied Annualised Return (10-year) | Negative from ~$375-$380 entry | 11-35% from ~$375-$380 entry | The same entry price produces opposite outcomes depending on which business Tesla becomes |
The bull case implies annualised returns of 11-35% over a decade, depending on where within the input ranges the actual trajectory falls. The street consensus target of $403-$406 and the TIKR advanced model mid-case of $1,771 anchor the two ends of this distribution in real analyst outputs.
Under the bear scenario, at an entry price of approximately $375-$380 per share, every projected return outcome was negative. The bear case does not require a catastrophe. It requires only that the AI and robotics businesses fail to deliver at scale.
The wide spread between these outcomes is not analyst confusion. It is the mathematically necessary result of genuine uncertainty about which business Tesla becomes. Each input assumption reflects a distinct view on that question, and the compounding effect of those views over a decade produces the range investors are actually navigating.
Scenario analysis answers the question “what could happen?” Entry price determines what that answer means for the individual investor’s returns. The same bull case produces materially different outcomes depending on when the position was established.
Tesla has traded across a wide range in recent years: approximately $100 per share a few years prior, near $450 at its peak, and roughly $410 at the time of writing. Forward analyst consensus projects EPS growing more than 5x from current levels. That growth, if it materialises, must still be discounted back to whatever price the investor paid.
Three entry points illustrate the mechanics:
The compounding effect of overpaying works against the investor in both directions. When entry price is high relative to what the current business justifies, even accurate predictions about future growth can generate mediocre returns, because a larger portion of that growth was already priced in at purchase.
Long-term compounding mechanics make entry price a more consequential variable than most investors intuitively appreciate: the second decade of a compounding position generates nearly double the dollar gains of the first decade on the same initial capital, which means an investor who overpays at entry surrenders a disproportionate share of that second-decade acceleration.
Timeline risk and the discount rate: Elon Musk has a documented history of ambitious timelines that have not materialised on schedule. The 2016 claim that all Tesla vehicles had hardware sufficient for full self-driving, the 2019 projection of one million robotaxis by 2020, and the 2021 statement that Optimus would be ready by 2022 all missed their targets. This pattern does not invalidate the long-term thesis, but it directly affects the discount rate applied to future cash flows. The further into the future the payoff is pushed, the less it is worth at the point of purchase.
Scenario analysis is not a one-time exercise. It is a framework for interpreting new information as it arrives. Each quarterly report, competitive development, or regulatory shift should move the investor’s probability weighting between scenarios, not trigger a binary all-in or all-out response.
Tesla’s next earnings call on 22 July 2026 is the first scheduled opportunity to update the framework. The metrics below serve as leading indicators for whether the bull or bear case is gaining weight.
| Signpost | Bull Case Signal | Bear Case Signal |
|---|---|---|
| Q2 auto gross margin (ex-credits) | Above 18%, confirming Q1’s 19.2% was sustainable | Below 18%, indicating Q1 was an outlier |
| Robotaxi operational status | Permits filed or service launched in at least one market | No permits, no operational service; timeline pushed again |
| FCF trajectory vs. capex | FCF burn decelerating despite $25B+ capex commitment | FCF burn accelerating with no revenue offset from new lines |
| Optimus production milestones | Commercial units delivered; revenue recognised | Contributions delayed beyond 2027; no material revenue |
| Competitive AV market share | Tesla narrows operational gap with Waymo | Waymo extends lead; Tesla remains pre-commercial |
Q1 2026 auto gross margin came in at 19.2%, above the 18% threshold that analysts have identified as the bull/bear inflection point. Whether Q2 confirms that figure as sustainable or reveals it as a one-quarter anomaly is the single most informative near-term data point.
Competitive developments are direct inputs into the probability weighting of the bull case, not background colour. Waymo raised $16B at a $126B valuation and is expanding to 12+ new cities in 2026, with an international launch planned in London by Q4 2026. As of March 2026, Tesla had no autonomous service operating in California and had not filed for the relevant permits. The California DMV approved new AV regulations on 28 April 2026, effective July 2026, which apply to commercial autonomous deployments.
The robotaxi permit gap between Tesla and Waymo is one of the most concrete quantifiable inputs available to investors stress-testing the bull case: Waymo holds active commercial deployment authorisation in California while Tesla held no equivalent permits as of May 2026, a regulatory asymmetry that directly compresses the probability weighting any rigorous model should assign to near-term autonomous revenue.
In humanoid robotics, Figure 03, Boston Dynamics Atlas, and Agility Robotics Digit are already in commercial deployment or entering serial production. Tesla’s Optimus has no material revenue in 2026, with contributions pushed to 2027 at the earliest.
An investor who ignores these competitive developments is effectively freezing their scenario probabilities at the point of original analysis. That produces mispriced conviction, because the probability that Tesla captures the autonomous and robotics markets is not static. It moves with every competitor milestone.
The gap between a $403 street consensus target, a $1,771 TIKR mid-case, and a $2,000+ ARK projection is not confusion. It is a precise map of how much the answer changes depending on which assumptions about Tesla’s business mix prove correct. The methodology does not predict which scenario will unfold. It forces intellectual honesty about what each price level implies.
Any investor in a transitioning company must be able to answer two questions clearly. First, which scenario’s assumptions am I implicitly accepting by paying this price? Second, do I believe those assumptions are probable enough to justify the risk?
The Tesla case is a template, not a special case. Any company whose current price embeds a future business model, whether in AI, biotech, energy transition, or fintech, requires the same three-part discipline:
This article is for informational purposes only and should not be considered financial advice. Investors should conduct their own research and consult with financial professionals before making investment decisions. Past performance does not guarantee future results. Financial projections are subject to market conditions and various risk factors.
—
Stock valuation analysis for growth companies is the process of estimating a company's worth by constructing forward scenarios across revenue growth, profit margins, and exit multiples, rather than relying solely on backward-looking ratios like P/E or EV/EBITDA that reflect current earnings rather than a future business model.
Tesla beat Q1 2026 revenue consensus by roughly $970M and adjusted EPS by $0.08, but the stock fell because management confirmed negative free cash flow for the remainder of 2026 and raised full-year capex guidance above $25 billion, signalling that the transformation bet is getting more expensive before it generates returns.
The Tesla bear case assumes the company remains an automaker, projecting 6-12% annualised revenue growth, 8-14% net margins, and an 18-22x exit multiple, which produces negative returns from a roughly $375-$380 entry price; the bull case assumes AI and robotics reach scale, projecting 20-35% growth, 20-30% margins, and a 25-35x multiple, implying annualised returns of 11-35% over a decade.
The five key signposts are Q2 auto gross margin relative to the 18% threshold, Robotaxi permit filings or service launches, the trajectory of free cash flow burn against the $25 billion-plus capex commitment, Optimus commercial revenue milestones, and Tesla's operational gap versus Waymo in the autonomous vehicle market.
Entry price determines what a given scenario means for individual returns: the same bull case that delivers strong compounding from a $100 entry generates only market-average or below-average returns from a $450 entry, because a larger share of projected future growth is already embedded in the higher purchase price.