Index Concentration Risk: What the KOSPI Crash Reveals
1 hr ago

National Australia Bank shares trade at around $36 on the ASX, yet feeding different assumptions into a single valuation formula can produce fair value estimates ranging from $19 to more than $85. That is not a flaw in the maths. It is the Dividend Discount Model doing exactly what it was designed to do: forcing an investor to make their assumptions explicit, then showing precisely what those assumptions imply. This guide uses NAB’s FY24 dividend data (total ordinary dividend of $1.69 per share, 100% fully franked) as a worked case study. By the end, readers will be able to apply the DDM formula step by step to any dividend-paying stock, understand why franking credits lift intrinsic value estimates for Australian investors, and identify which assumptions drive the largest valuation swings so they can stress-test their own models.
Every share purchase is, at its core, a bet on future income. The price paid today buys a claim on every dividend the company will distribute from now until it ceases to exist. The Dividend Discount Model formalises that idea: a share’s fair value equals the present value of all future dividends, discounted back to today.
For mature, stable dividend payers like the major ASX banks, the most commonly used variant is the Gordon Growth Model, a single-stage DDM that assumes dividends grow at a constant rate forever. It requires only three inputs:
The DDM intellectual foundations trace back to John Burr Williams, who formalised the present-value-of-dividends framework in 1938 as a direct response to the speculative price-momentum investing that preceded the 1929 crash, and that origin explains why the model is deliberately anchored to income rather than resale price.
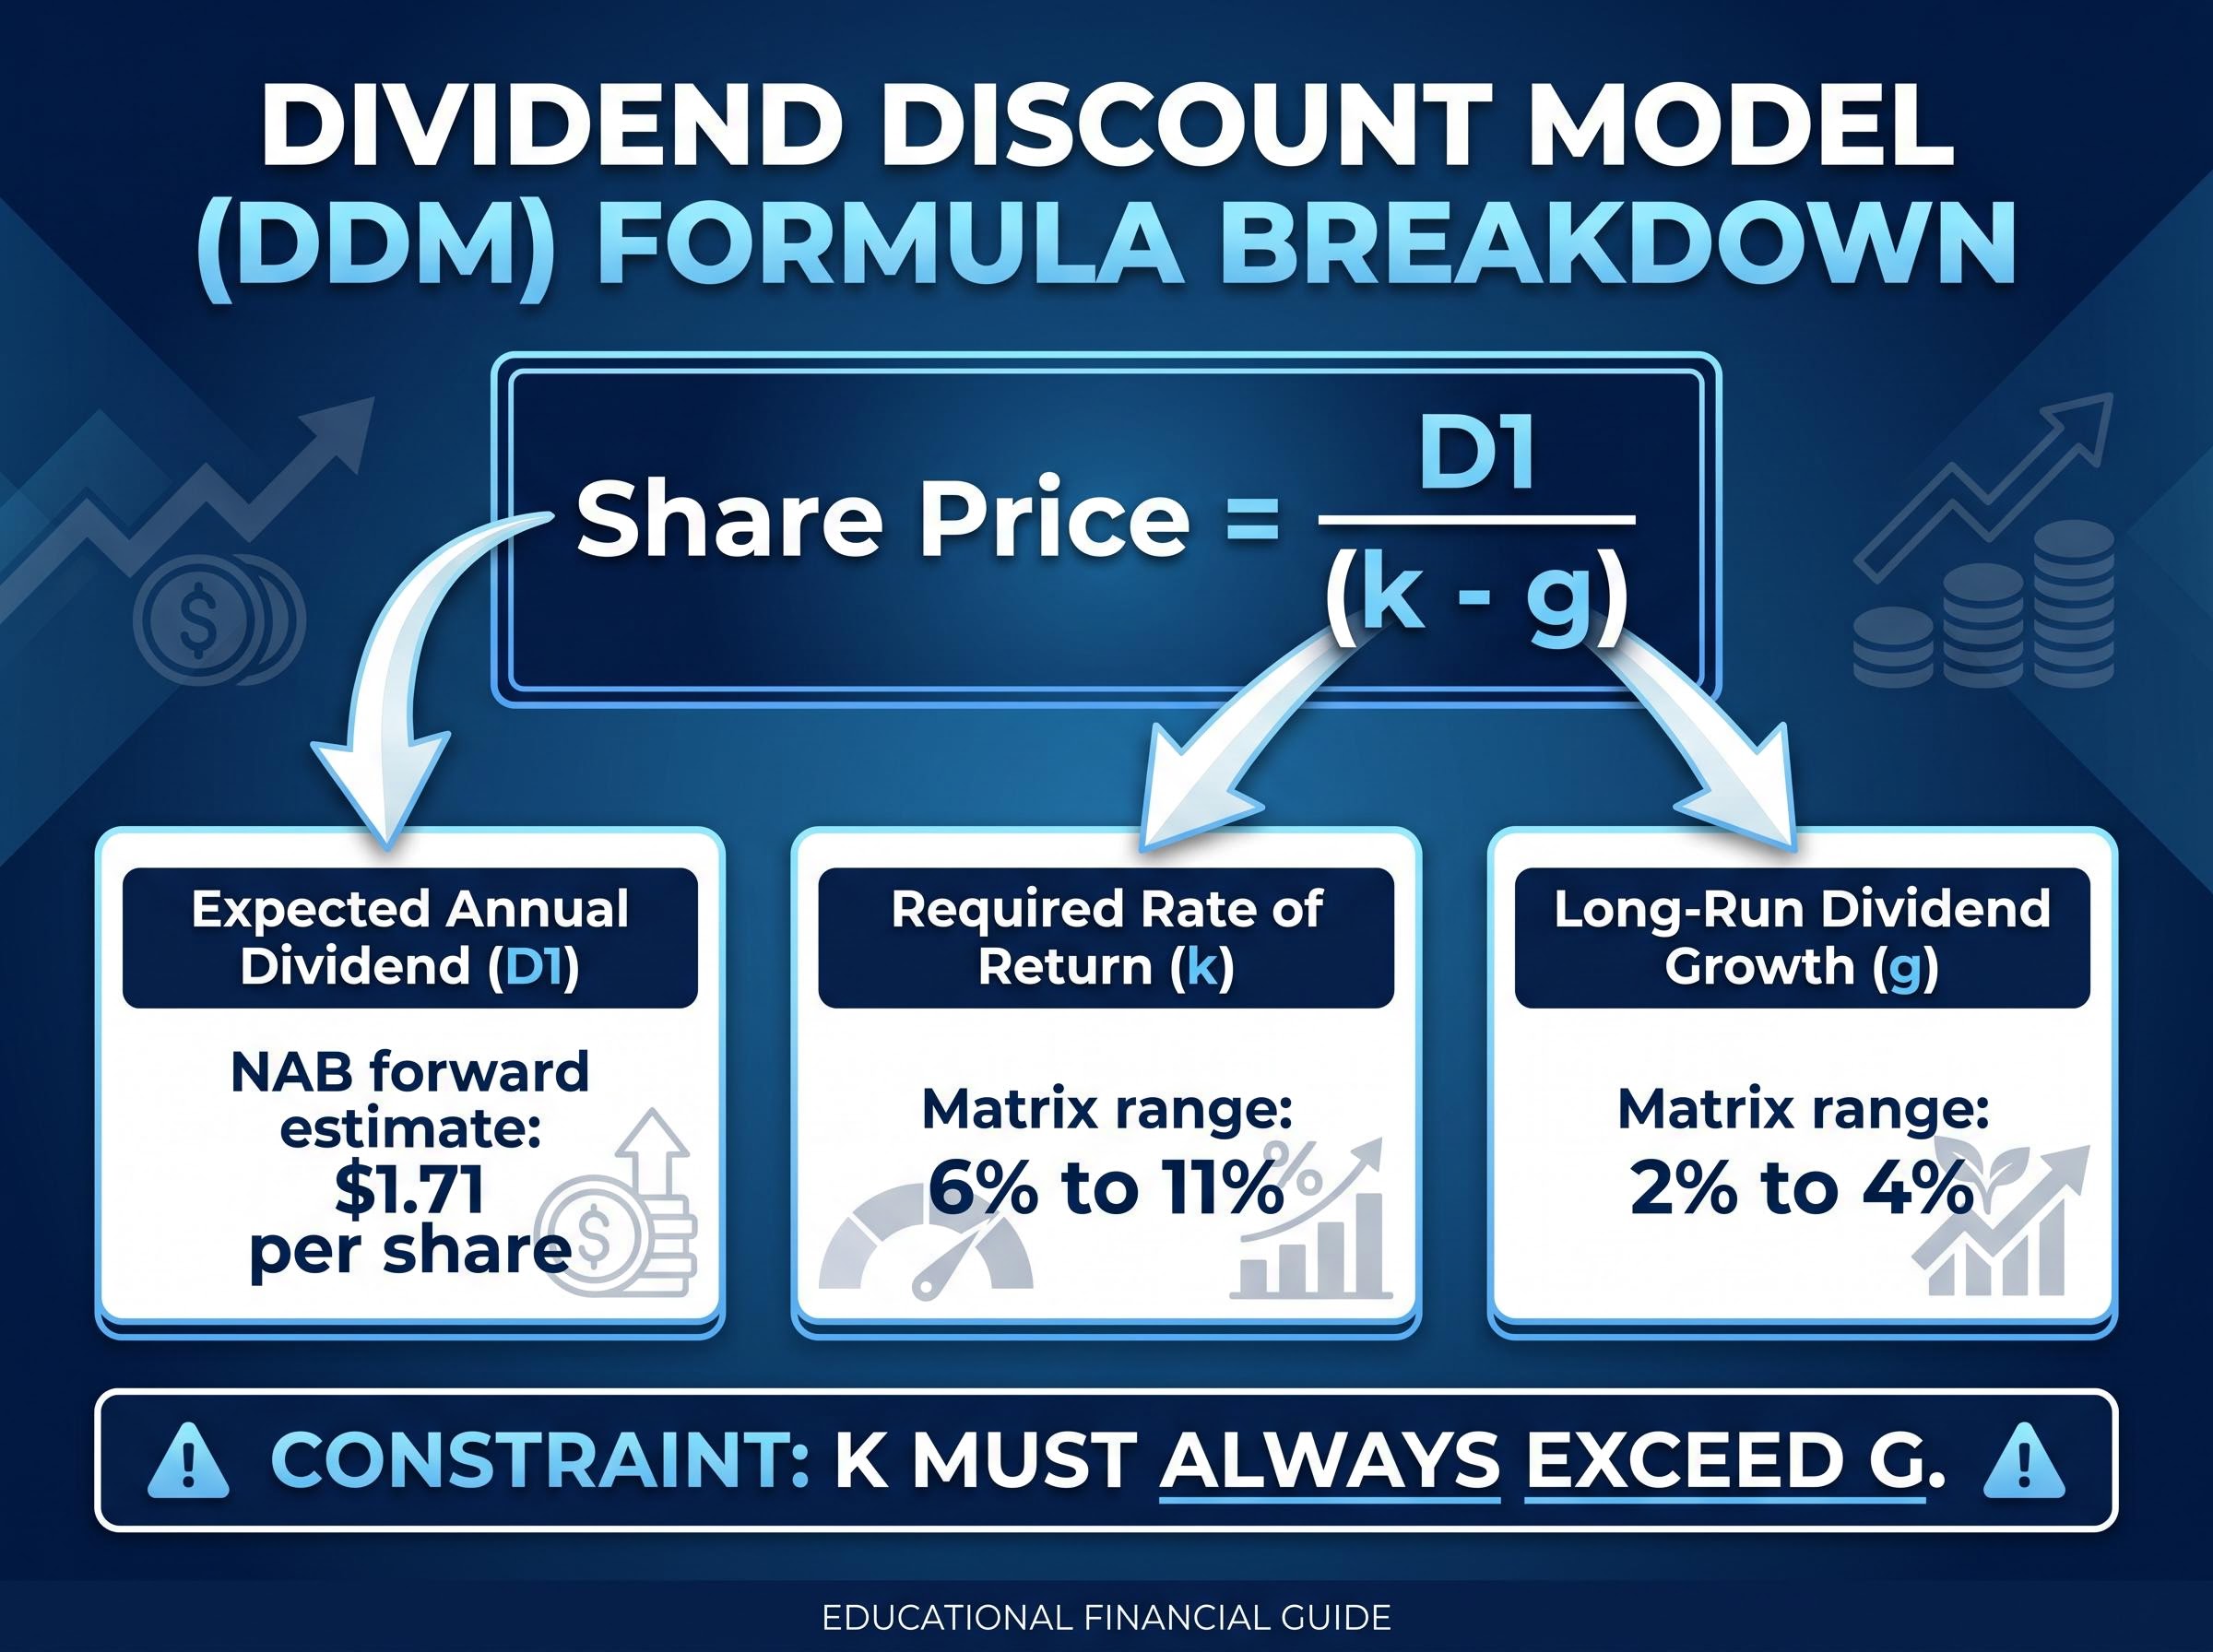
DDM Formula: Share Price = D1 / (k – g)
For NAB, the trailing FY24 total ordinary dividend was $1.69 per share. The forward estimate used in this guide’s worked example is $1.71 per share.
The formula computes a perpetuity, discounted at the spread between the required return and the growth rate. That spread, the gap between k and g, is the denominator. When it narrows, valuations rise sharply. When it widens, they compress. Understanding that single mechanic makes it immediately obvious why small changes in either assumption can swing the output by tens of dollars.
The formula is simple. Choosing defensible inputs is where most DDM mistakes are made, and it is where the model either earns its keep or leads investors astray.
The required rate of return is typically built from two components: a risk-free rate (proxied by the 10-year Commonwealth Government bond yield, available on the RBA website) plus an equity risk premium that reflects the specific stock’s risk characteristics.
A higher interest rate environment raises the risk-free rate, which in turn raises k and suppresses DDM valuations, even if dividends remain stable. For NAB as a systemically important, APRA-regulated bank, many practitioners apply a k in the 7%-10% range, though the scenario matrix in this guide extends from 6% to 11% to capture a wider set of investor return expectations.
Long-run dividend growth for a major regulated Australian bank is anchored to nominal GDP growth, which has historically run at approximately 4%-5% annually in Australia, and constrained by APRA’s capital adequacy requirements, which limit how much profit banks can distribute.
According to BetaShares, a common error is extrapolating a short run of high dividend growth into the perpetuity phase of the model, producing systematically inflated valuations. This guide applies growth rate assumptions of 2%, 3%, and 4% annually.
The constraints on each input in summary:
One critical requirement: k must always exceed g for the formula to produce a positive, finite result. When the spread narrows, small assumption changes can swing DDM fair values by 20-30% for mature, low-growth bank stocks. That sensitivity is not a bug. It is the model telling the user that assumptions in that range carry high uncertainty.
Start with the forward dividend estimate. NAB’s FY24 total ordinary dividend was $1.69 per share (85 cents interim plus 84 cents final, both 100% fully franked). The forward estimate used here is $1.71 per share, reflecting a modest uplift from the trailing figure. The forward estimate is the correct input because D1 represents the dividend expected over the next twelve months, not the one already received.
Now apply the formula across a range of assumptions. With D1 set at $1.71, divide by the spread between the required return and the growth rate for each scenario.
| Required Return (k) | g = 2% | g = 3% | g = 4% |
|---|---|---|---|
| 6% | $42.75 | $57.00 | $85.50 |
| 7% | $34.20 | $42.75 | $57.00 |
| 8% | $28.50 | $34.20 | $42.75 |
| 10% | $21.38 | $24.43 | $28.50 |
| 11% | $19.00 | $21.38 | $24.43 |
The dispersion is striking. At 4% growth and a 6% required return, the same formula values NAB at $85.50. At 2% growth and an 11% required return, the value falls to approximately $19.00. The formula has not changed. Only the assumptions have.
Averaged across all fifteen scenarios, the DDM produces a fair value of approximately $36.16 using the $1.71 forward dividend estimate, compared to NAB’s share price of $36.52 at the time of analysis.
That close alignment does not mean the model has found the “right” answer. It means that the market’s current price is consistent with the midpoint of a wide range of defensible assumptions. The scenario matrix makes the point viscerally: the DDM produces a range, not a verdict. The investor’s job is to decide which assumptions they find most credible and to understand what their chosen scenario implies about the return they are accepting.
ASX 200 dividend yields stood at approximately 3.3% in late 2025, well below the 10-year historical average of 4.3%, which provides market-level context for the NAB scenario matrix: if the index is broadly pricing in lower future yields than history suggests, mid-range DDM assumptions may already embed an optimism premium that investors should interrogate before accepting them as neutral.
Running a DDM on NAB using only the cash dividend ignores a genuine economic benefit that Australian tax law provides to eligible shareholders. For fully franked dividends, the franking credit represents corporate tax already paid on the profits distributed, and for investors who can utilise that credit (low-to-middle income earners, superannuation funds in accumulation phase, and retirees receiving franking credit refunds), it is real, legislatively backed value.
Ignoring it means systematically undervaluing fully franked Australian stocks.
The adjustment takes three steps:
The ATO franking credit allocation rules confirm that franking credits are calculated using the corporate tax rate applicable to the distributing entity, with non-base rate entities subject to the 30% rate that underpins the adjustment formula applied in this guide.
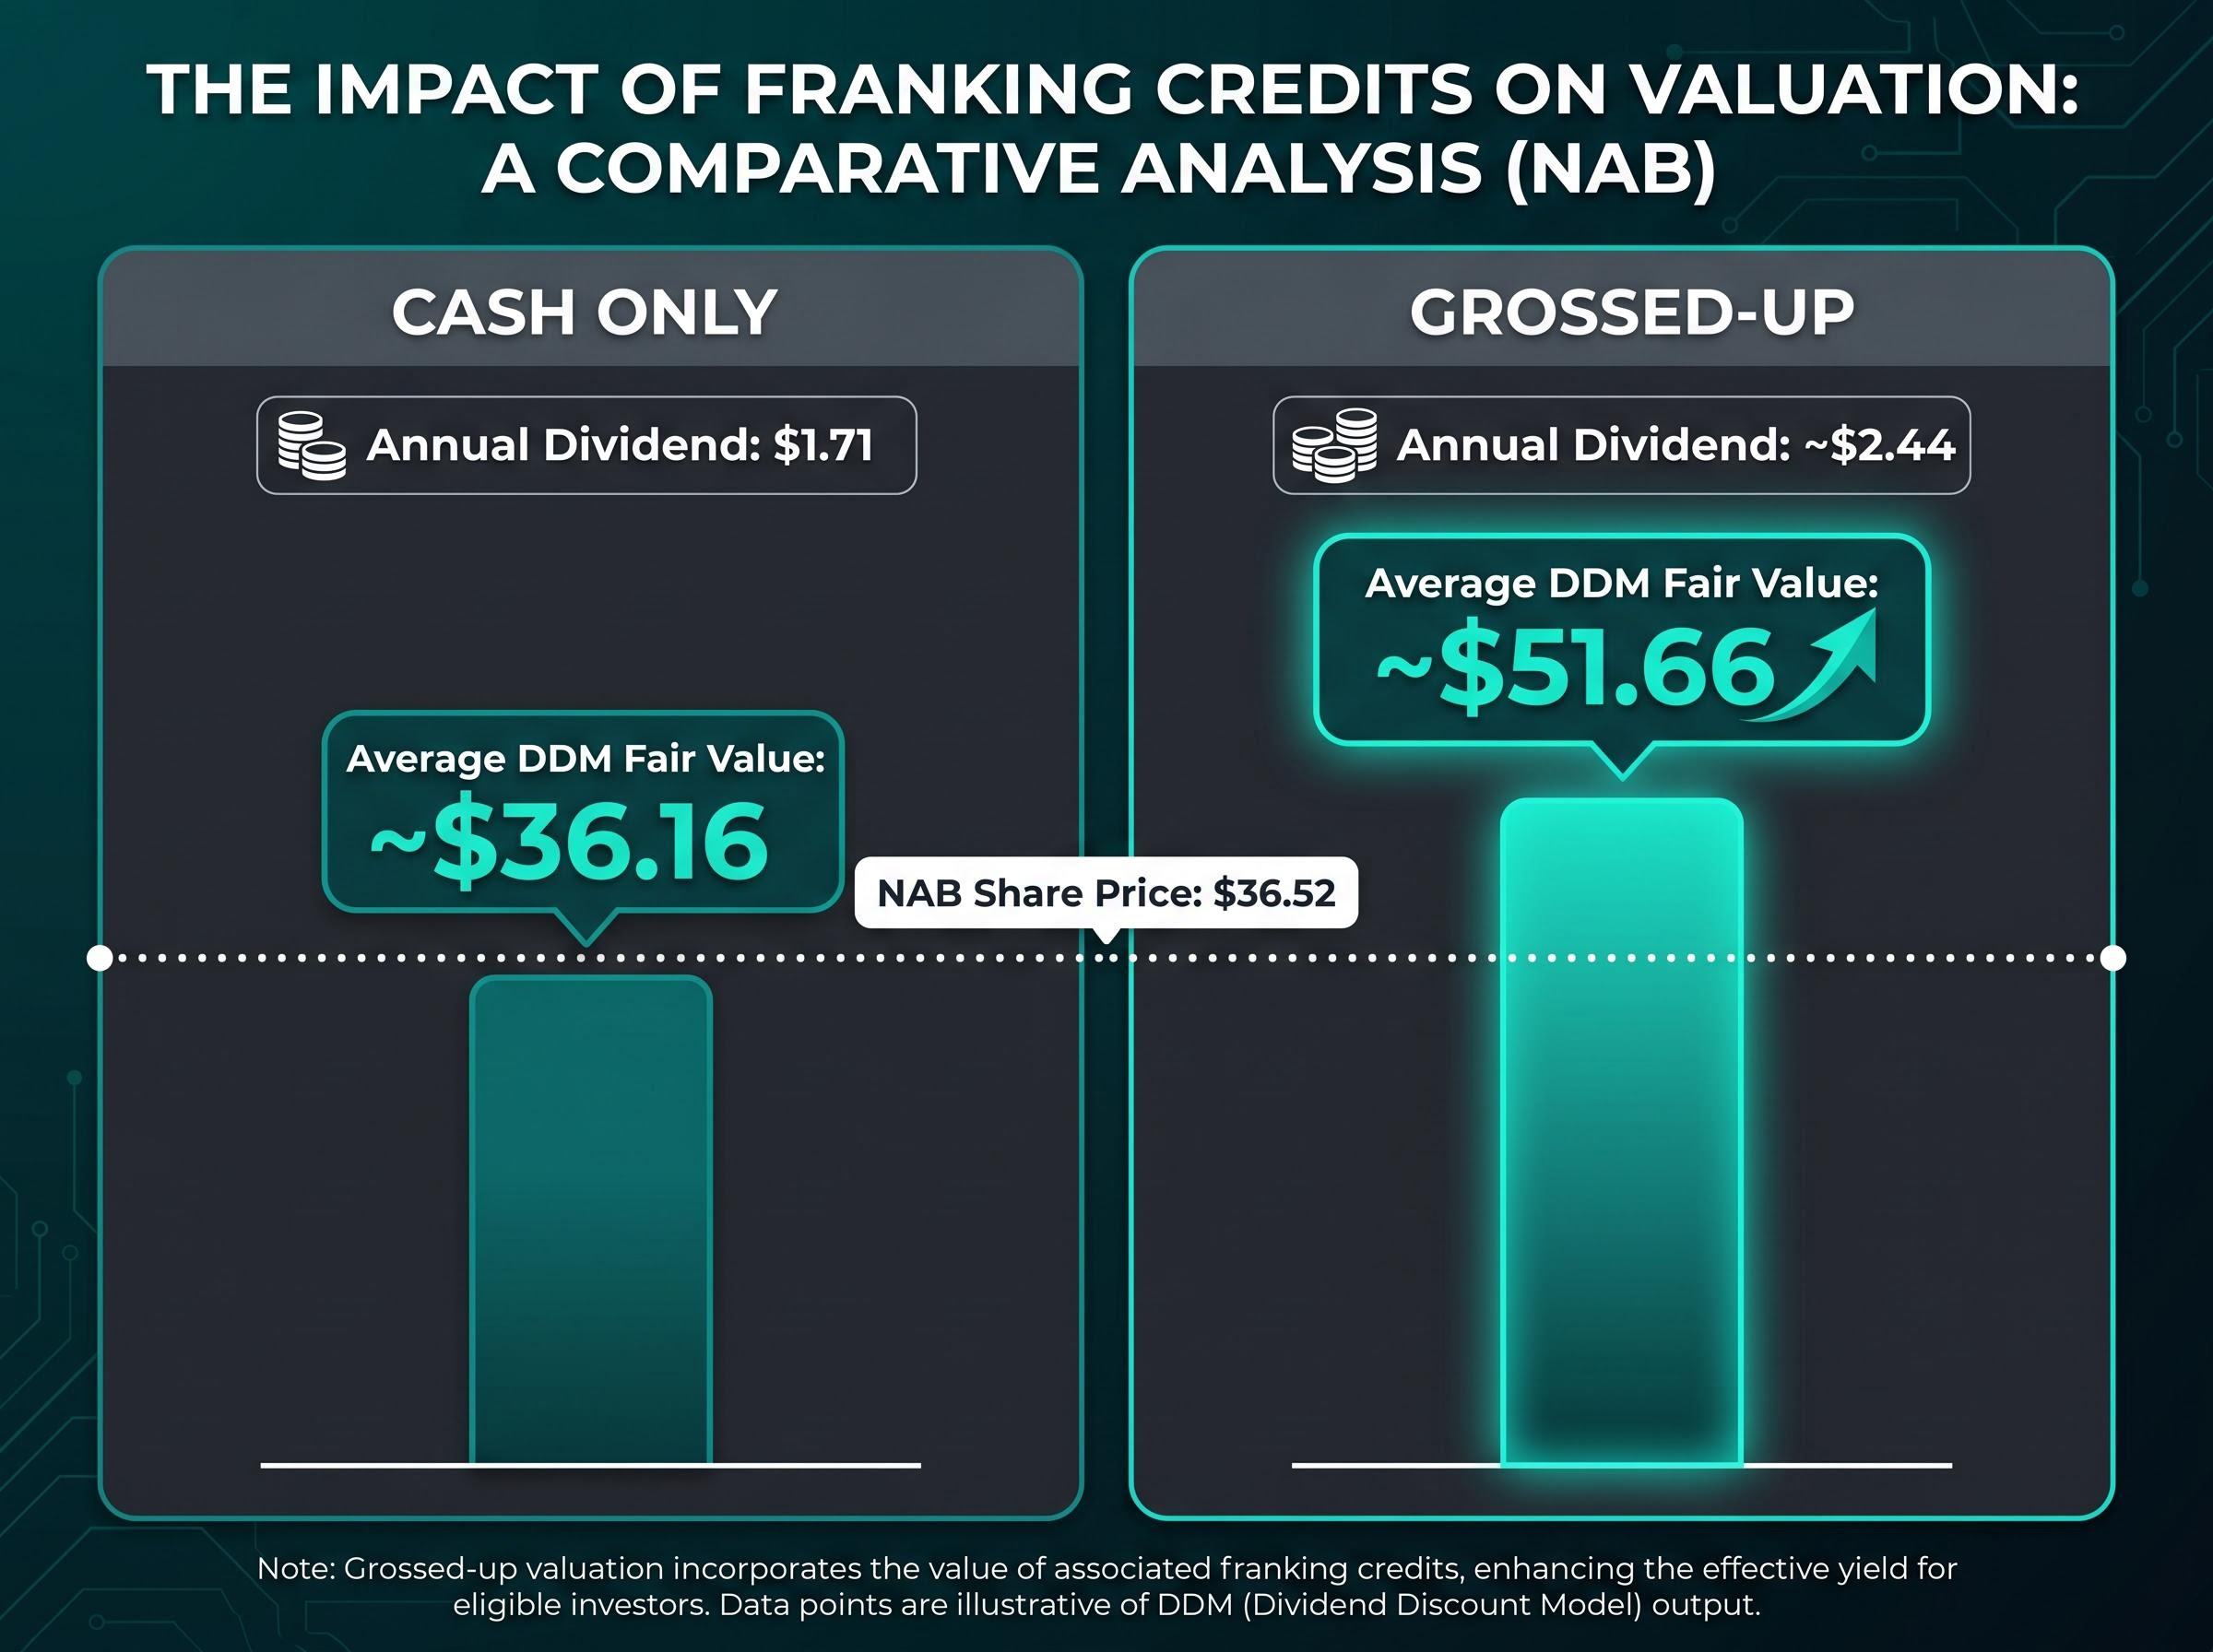
| Metric | Cash Only | Grossed-Up |
|---|---|---|
| Annual dividend per share | $1.71 (forward estimate) | ~$2.44 (forward, grossed-up) |
| Average DDM fair value | ~$36.16 | ~$51.66 |
The gap between the two outputs is substantial: $36.16 (cash dividend only) versus approximately $51.66 (grossed-up dividend). That difference is not a modelling quirk. It reflects the value of franking credits for investors who can fully utilise them.
Two caveats apply. First, the 45-day holding rule requires shares to be held for at least 45 days around the ex-dividend date for the investor to be eligible for the franking tax offset. Second, in a downturn, franking credits and cash dividends can both be reduced simultaneously, because franking credits depend on taxable profits. A DDM that assumes stable, fully franked dividends in perpetuity is therefore doubly optimistic during stress periods.
For Australian self-managed super fund (SMSF) investors and retirees, understanding this adjustment is particularly important. The grossed-up DDM captures the full pre-tax economic value of the dividend for those who can access the credit.
For SMSF members in pension phase, the grossed-up dividend yield is effectively the only economically complete measure of income from fully franked shares: because the 0% pension-phase tax rate allows the entire franking credit to be claimed as a cash refund from the ATO, headline cash yield figures systematically understate the actual return these investors receive.
The worked example may have built confidence in the framework, and the scenario matrix provides useful structure. But the model carries specific failure modes that investors using it on bank stocks need to recognise.
Bank earnings, and therefore dividends, are sensitive to the credit cycle, the interest rate cycle, and APRA’s evolving capital adequacy requirements. Any of these can alter payout capacity quickly and in ways that a constant-growth perpetuity model cannot capture. A DDM that assumes smooth, predictable dividends may materially misprice bank stocks when credit conditions turn.
According to BetaShares, five common DDM mistakes recur among retail investors:
The risk runs in both directions. Optimistic growth rates in rising markets produce overvaluation. Conversely, failing to test stress scenarios can leave investors unprepared for dividend cuts. NAB’s FY24 return on equity of 11.4% (above the sector average of 9.35%) and its CET1 capital ratio of 12.35% (above APRA requirements) provide context for the dividend’s sustainability, but neither metric guarantees future payouts.
ASIC MoneySmart guidance and ASX investor education materials both recommend using more than one valuation method, including earnings-based metrics such as price-to-earnings or return on equity analysis, alongside asset-based approaches. The DDM should function as one input in a broader toolkit, not a standalone answer.
At minimum, run three scenarios: a base case using mid-range assumptions, a bull case with lower k and higher g, and a bear case with higher k, lower g, and a dividend reduction. For bank stocks specifically, a stress scenario where dividends are cut and franking credits fall simultaneously is particularly instructive, because it tests the assumption that most DDM users leave unexamined.
The model is a structured way of thinking about value. Knowing its failure modes is what separates an investor who uses it well from one who uses it as a false source of precision.
The core insight of this guide is not a number. It is a discipline. The DDM gives investors a rigorous framework for asking: what would this stock need to deliver, year after year in perpetuity, for the current price to represent fair value? The answer to that question is more valuable than any single valuation output.
The NAB worked example illustrates the point. A cash-only averaged DDM produced a fair value of approximately $36.16. The grossed-up DDM, adjusting for franking credits, produced approximately $51.66. The share price sat at $36.52. The scenario range of $19 to $85 illustrates the model’s sensitivity to assumptions rather than a genuine range of probable outcomes; base-case assumptions cluster the realistic range much more tightly.
The same methodology applies to any ASX dividend-paying stock. The inputs, D1, k, and g, are the only moving parts. The discipline of selecting defensible inputs applies universally.
For investors wanting to build a complete analytical framework around the DDM outputs produced here, our dedicated guide to share valuation methods for ASX stocks walks through a five-step sequence combining price-to-sales screening, EV/EBITDA benchmarking, DCF analysis, and DDM application, with worked examples showing how each method cross-checks the others to reduce the risk of conviction errors.
For readers looking to apply this framework themselves, three practical next steps:
This article is for informational purposes only and should not be considered financial advice. Investors should conduct their own research and consult with financial professionals before making investment decisions. Past performance does not guarantee future results. Financial projections are subject to market conditions and various risk factors.
The Dividend Discount Model (DDM) values a share by calculating the present value of all future dividends, discounted back to today. The most common version, the Gordon Growth Model, uses just three inputs: the expected forward dividend, the required rate of return, and the long-run dividend growth rate.
Divide the forward dividend estimate (D1) by the difference between your required return (k) and the expected dividend growth rate (g). Using NAB's forward dividend of $1.71 per share, a required return of 8%, and a 3% growth rate produces a fair value of approximately $34.20 per share.
For fully franked dividends, the franking credit (calculated as the cash dividend multiplied by 30/70 at the 30% corporate tax rate) is added to the cash dividend to produce a grossed-up figure, which is then used in the DDM formula. For NAB, this adjustment lifts the average DDM fair value from approximately $36.16 (cash only) to approximately $51.66.
For major Australian banks, the long-run dividend growth rate is typically anchored to nominal GDP growth of around 4%-5% annually and constrained by APRA capital adequacy requirements. Analysts commonly apply growth rate assumptions of 2%-4% to avoid extrapolating short-run high growth into the perpetuity phase of the model.
The DDM assumes smooth, constant dividend growth in perpetuity, which makes it poorly suited to capturing the impact of credit cycle downturns, interest rate changes, or regulatory capital requirements that can reduce bank dividends quickly. ASIC and ASX guidance recommends using the DDM alongside other valuation methods such as price-to-earnings ratios and return on equity analysis.