How Zero Commissions Changed the Maths on Thematic ETFs
1 hr ago

$100 a month, invested consistently at 7% annual returns for 20 years, grows to roughly $52,000. The total amount you actually put in over those two decades is $24,000. The other $28,000 is money your money made.
That gap between what you contribute and what you end up with is the entire case for starting now, even if “now” means starting small. Most people who have not yet begun investing are not waiting because they lack access. They are waiting because they believe they need a larger starting amount before investing makes sense. That belief has a price, and the price is compounding time you cannot buy back.
Here is what the actual numbers look like when you invest $100 a month across 5, 10, and 20 years, why a savings account cannot replicate those results, and what the first concrete step looks like once you decide to begin.
The assumption most people carry is straightforward: bigger contributions produce bigger results. That is not wrong, but it misses the variable that matters more. Time, not size, is where compounding does its heaviest work.
Compounding operates on three connected inputs:
The reason time dominates is mechanical. Compounding is multiplicative, not additive. Returns are not applied only to what you contributed; they are applied to your contributions plus all prior growth. Each year, the base gets larger, and next year’s returns are calculated on that larger base.
That is why a five-year head start is worth far more than five extra years of contributions would suggest. Consider two investors, both putting in $100 a month at 7% annual returns. One starts today. The other waits five years.
| Scenario | Total Contributed | Final Portfolio Value |
|---|---|---|
| Start now (20 years) | $24,000 | $52,093 |
| Start 5 years later (15 years) | $18,000 | $31,696 |
The five-year delay costs $6,000 in missed contributions. But it costs nearly $20,400 in final portfolio value. The difference is generated entirely by lost compounding time, not by any change in what the investor paid in.
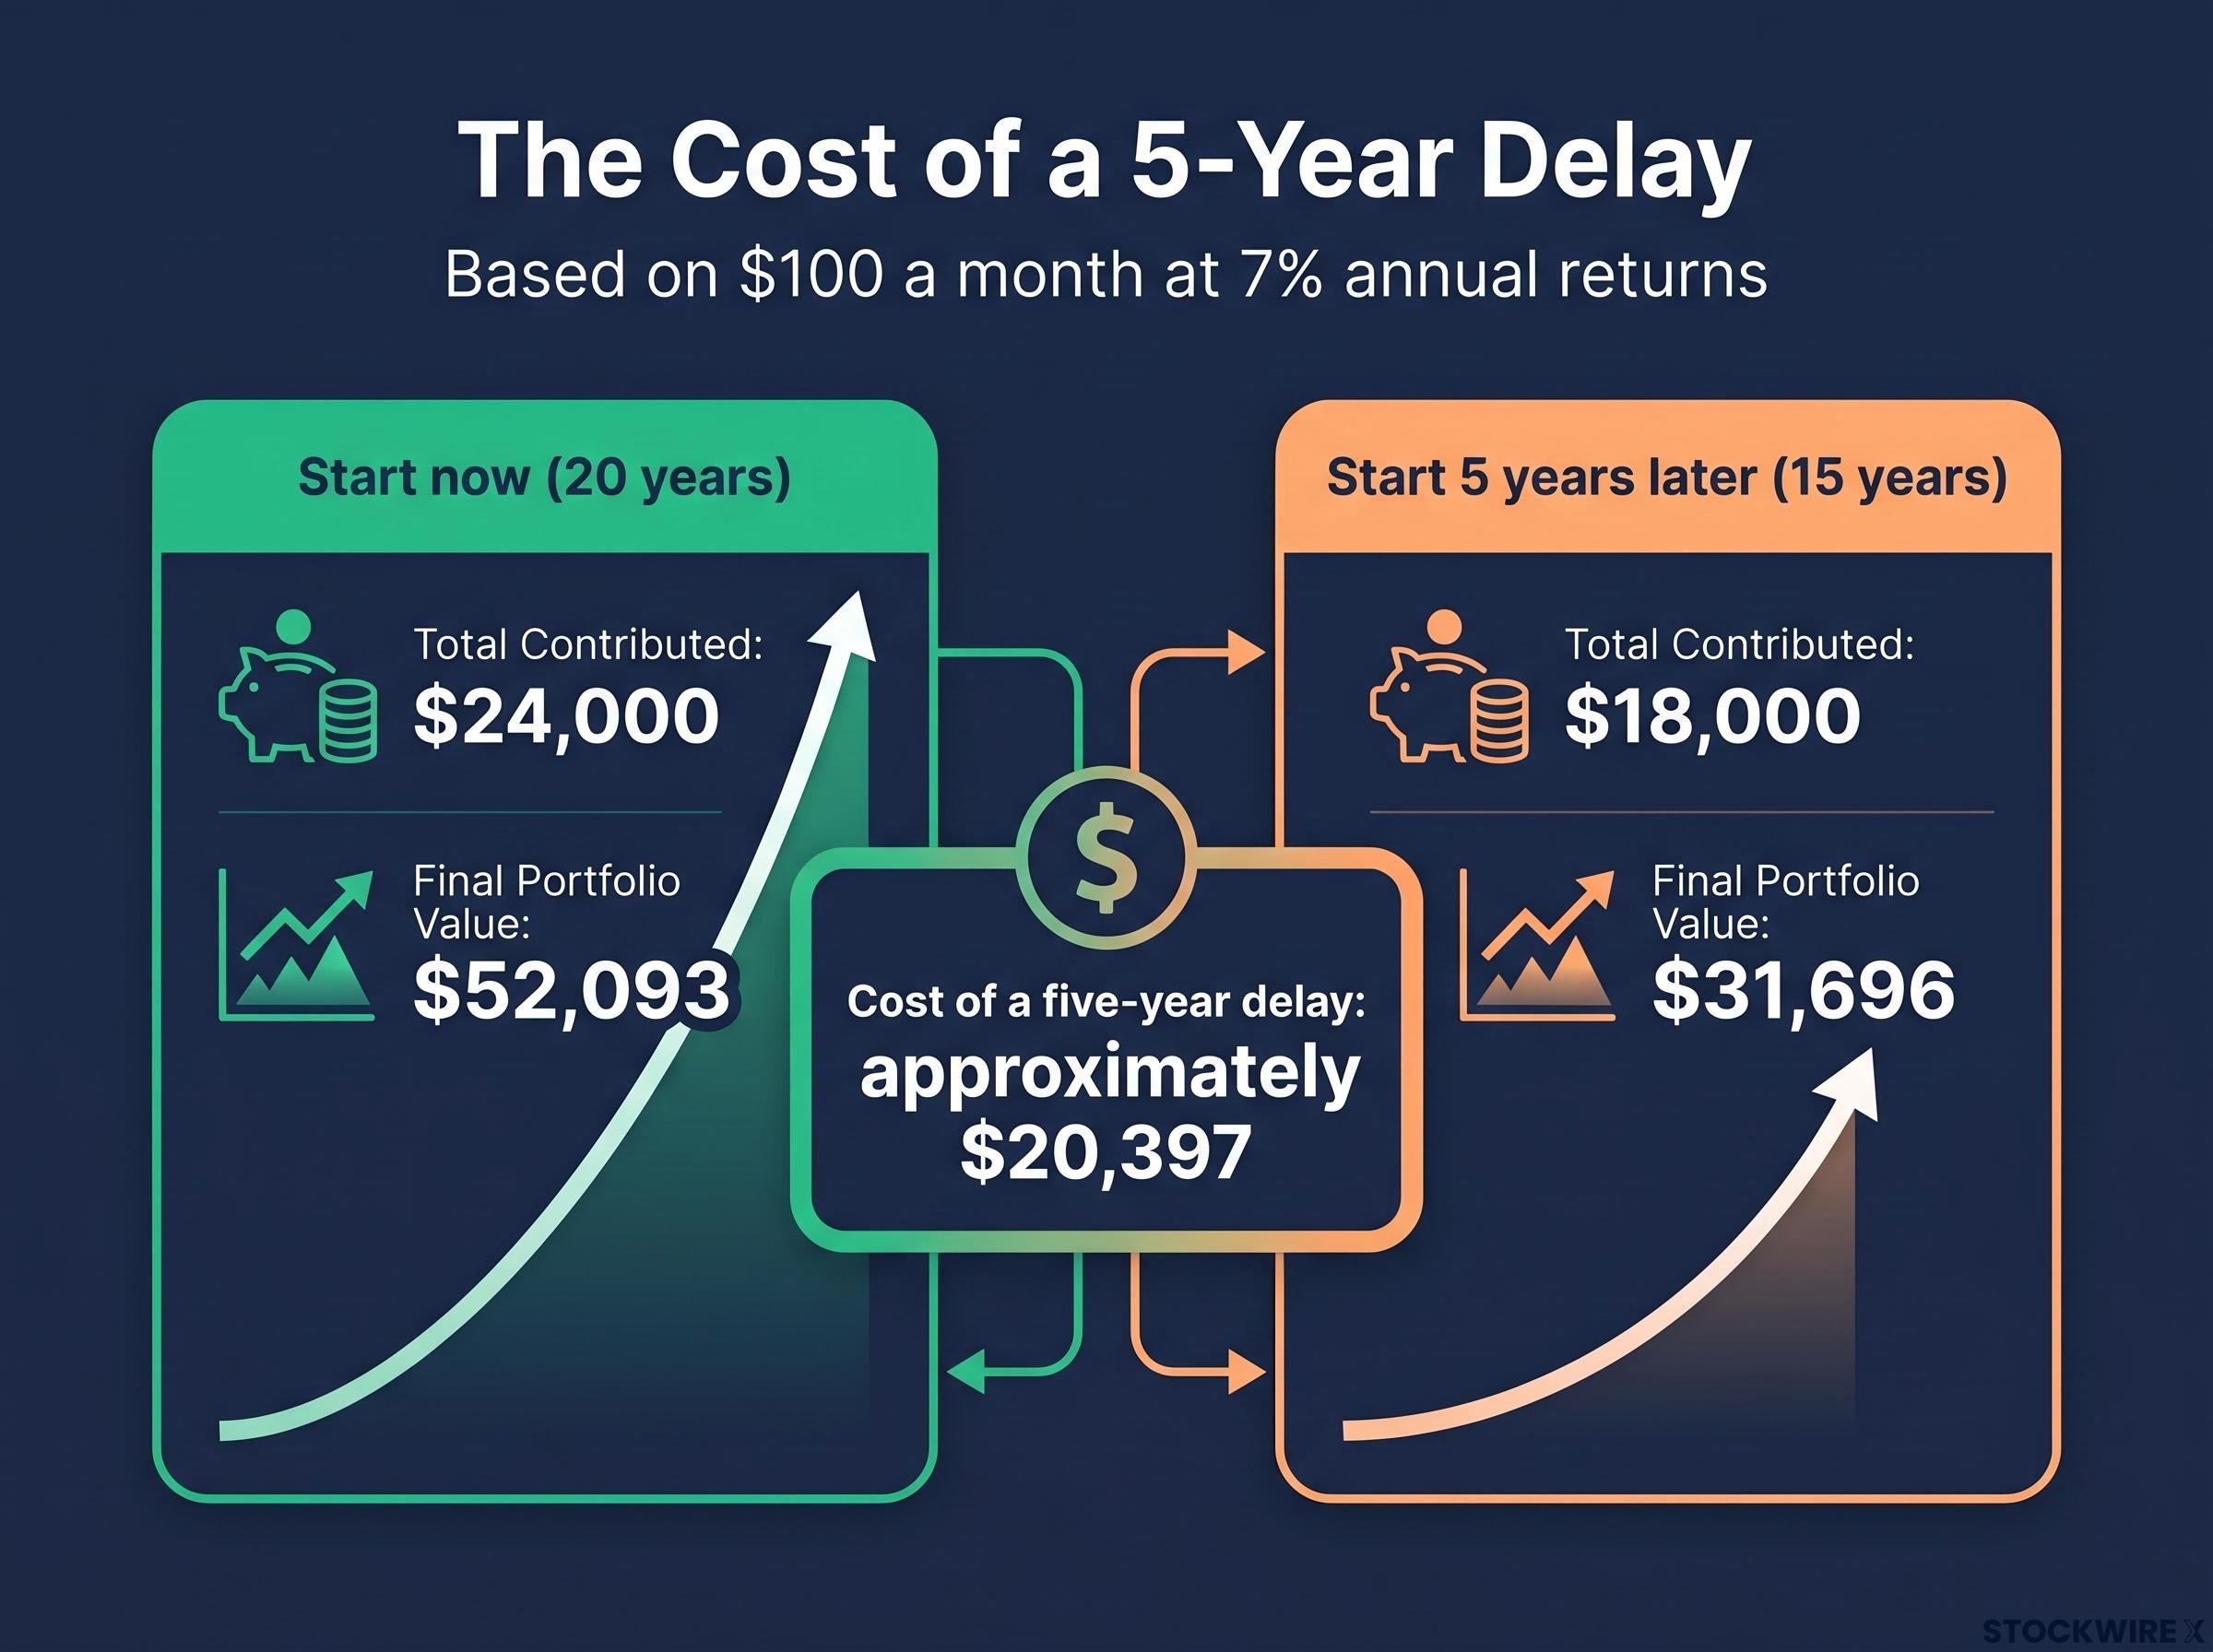
The cost of a five-year delay: approximately $20,397. That gap cannot be recovered by contributing more later, because the compounding years it depended on are gone.
Waiting is not a neutral choice. It is a decision with a specific, calculable price tag, and the price rises every month you hold the belief that you need more money before you can begin.
Passive investing outcomes over 30-year periods with identical monthly contributions illustrate the compounding gap from a different angle: a passive S&P 500 investor accumulates approximately $1,778,000 compared to $511,000 for a top-performing day trader contributing the same $1,000 monthly, with the gap driven almost entirely by tax drag and missed compounding time on active positions.
The table below shows what happens when you contribute $100 a month at a 7% annual return, a benchmark derived from the S&P 500’s long-term historical average as referenced by SoFi. These projections are illustrative, not guaranteed, and were prepared by POEMS/PSPL.
| Time Horizon | Total Contributed | Portfolio Value at 7% | Growth Above Contributions |
|---|---|---|---|
| 5 years | $6,000 | $7,159 | $1,159 |
| 10 years | $12,000 | $17,308 | $5,308 |
| 15 years | $18,000 | $31,696 | $13,696 |
| 20 years | $24,000 | $52,093 | $28,093 |
At year five, the growth above your contributions is modest: roughly $1,159. At year ten, it has climbed to about $5,300. But look at what happens between year ten and year twenty. Your contributions increase by only $12,000 over that decade. Your portfolio value jumps by nearly $35,000.
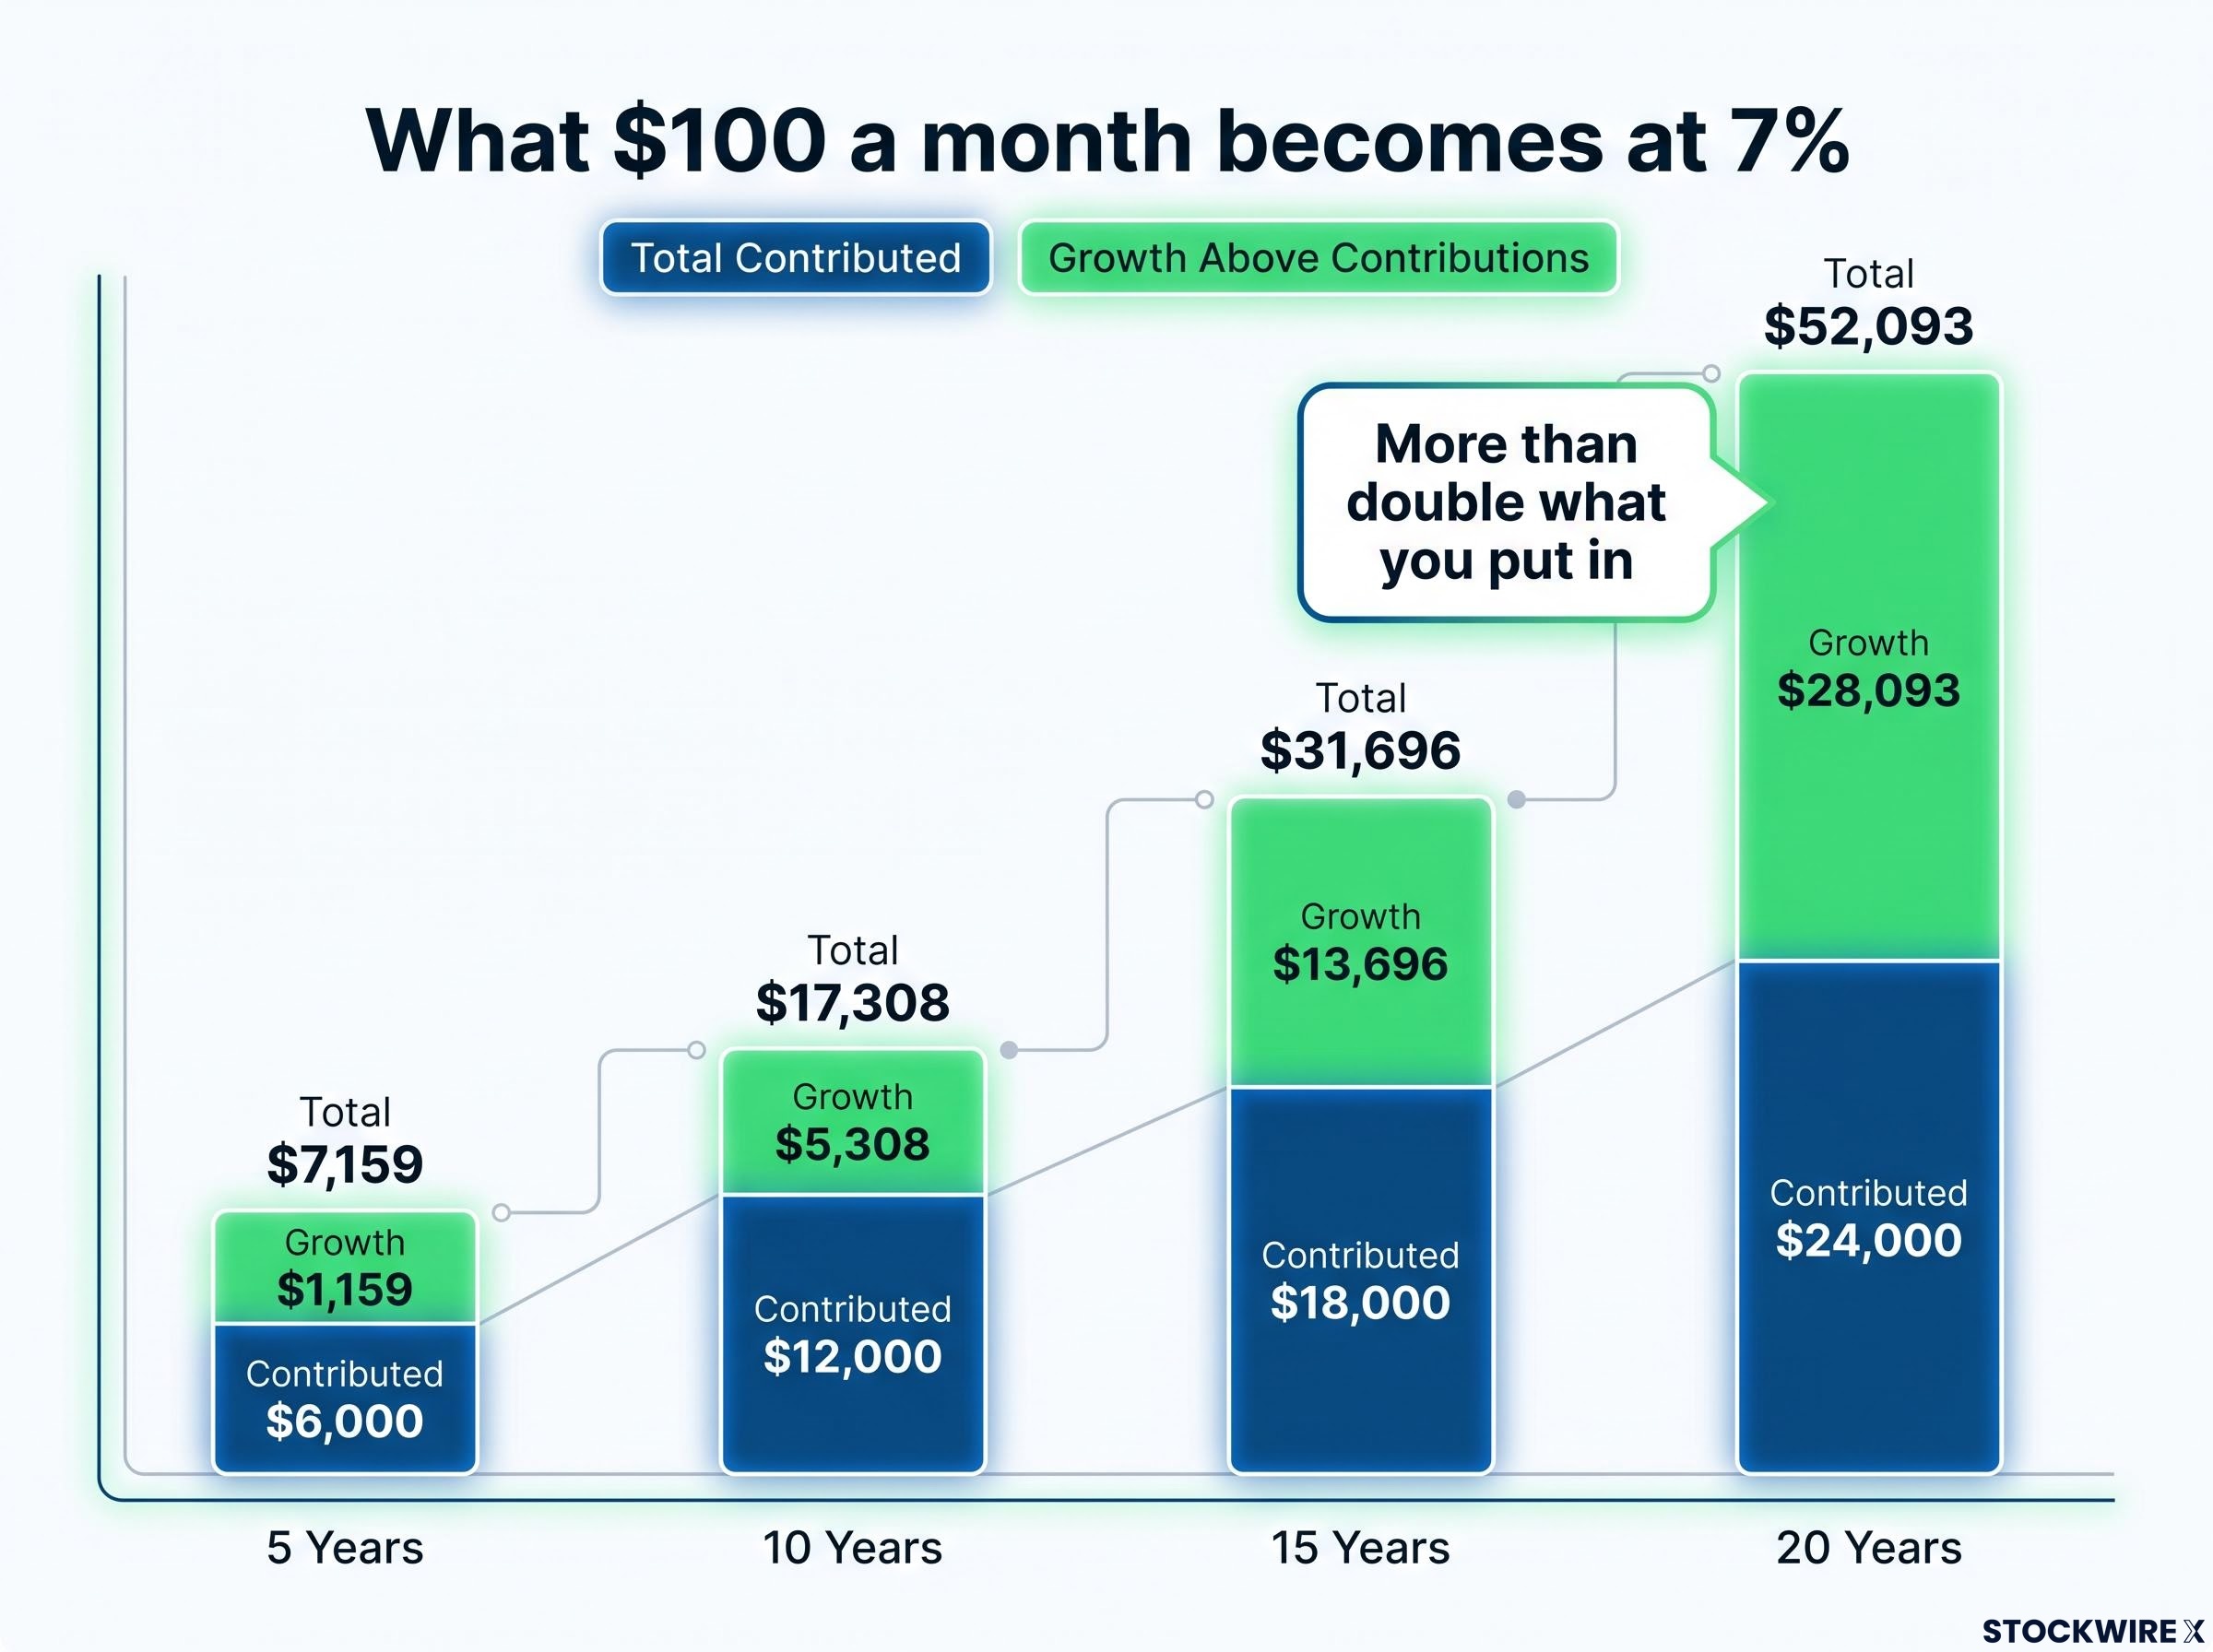
At the 20-year mark, approximately $52,093 from $24,000 contributed. Your portfolio is more than double what you put in.
The ratio of growth to contributions widens at each milestone. At five years, compounding is a minor tailwind. At twenty, it accounts for more than half your total balance. That acceleration is the entire reason the back half of a long investment window does far more work than the front half, and why starting early matters more than starting big.
The compounding mechanics that generate that acceleration are not unique to a specific asset class; diversified equities have delivered approximately 7% real annual returns since 1802, and the second decade of a compounding position generates nearly double the dollar gains of the first decade on the same initial capital.
The case for starting now is strong, but “now” applies specifically to your investable surplus, not to every dollar in your bank account. Three things should be in place before you set up a recurring investment:
Your emergency fund is not idle money. It is the insurance policy that keeps your investment plan intact. If you invest money you might need in six months and a market downturn or personal financial disruption forces a withdrawal, you crystallise a loss and break the compounding timeline the entire strategy depends on. The emergency fund protects your ability to stay invested through volatility.
The 7% annual return used throughout this article is a long-term historical average, not a year-by-year guarantee. Over short horizons of five years or fewer, equity markets can underperform cash savings or lose value outright. If your goal is inside five years, capital preservation vehicles may be more appropriate than equity exposure. The compounding projections here are most relevant to investors with 10-20 year horizons.
A savings account feels safe, and for short-term money it is. But for long-term wealth building, the comparison with an equity portfolio tells a very different story.
| Time Horizon | Savings Account (1.8%) | Investment Portfolio (7%) | Difference |
|---|---|---|---|
| 5 years | $6,273 | $7,159 | $886 |
| 10 years | $13,137 | $17,308 | $4,171 |
| 20 years | $28,863 | $52,093 | $23,230 |
At five years, the gap is less than $900. At ten years, it passes $4,000. At twenty years, it reaches $23,230. The difference does not grow linearly; it accelerates, because the forces widening it compound on each other:
At 1.8%, the vast majority of the savings account’s $28,863 after 20 years is simply your $24,000 in returned contributions. The account generated less than $5,000 in actual growth over two decades. The investment portfolio, by contrast, generated more than $28,000 in growth above contributions.
Savings account alternatives such as high-yield savings accounts, Treasury bills, and Series I bonds can close part of the gap for capital that genuinely needs to remain liquid; at current yields, a $50,000 balance in T-bills generates roughly $1,800-$2,500 annually compared to approximately $50 in a standard big-bank savings account.
That $23,230 gap at the 20-year mark represents the real-world cost of treating a long-term investment horizon as if it were a short-term safety buffer. It is a category error, and it has a specific dollar value.
Inflation reduces the purchasing power of future dollars. A 1.8% savings rate in an environment where inflation runs at 2-3% annually produces a negative real return. Your nominal balance grows, but the goods and services that money can buy shrink. Over a 20-year period, the savings account’s $28,863 represents materially less real-world purchasing power than the number suggests.
You now know what the numbers look like. The mechanism that produces those numbers on a consistent monthly schedule has a name: dollar-cost averaging, or DCA. DCA means investing a fixed dollar amount at regular intervals, regardless of what the market is doing on any given day.
The process works in three steps:
When prices are lower, your $100 buys more shares. When prices are higher, it buys fewer. Over time, this smooths your average cost per share without requiring you to predict whether the market is about to rise or fall.
That last point matters more than it might seem. Investors who wait for “the perfect entry point” routinely miss the strongest return periods. Missing just a handful of the best trading days in a given year can significantly reduce long-run returns. The market’s best days often occur close to its worst days, which means sitting on the sidelines during volatility usually means missing the recovery as well as the drop.
DALBAR investor behavior research consistently shows that retail investors earn significantly less than the market itself returns, precisely because attempts to time entry and exit points cause them to miss the concentrated bursts of recovery that follow periods of volatility.
When transaction costs attached a fee to every purchase, making small contributions frequently was financially inefficient. Removing that cost changes the calculation entirely: regular, modest investments no longer carry a structural penalty, and the mathematics of consistent monthly contributions can work without being offset at the point of entry.
Staying the course through regular contributions matters more to long-term outcomes than picking the right moment or constructing a complex strategy. Regular, disciplined investing outperforms tactical manoeuvring.
The practical implication: setting up a recurring monthly transfer into an investment account is not just a convenience feature. It is a structural defence against the behavioural patterns, buying high, selling low, that cause most retail investors to underperform the market itself.
The data in this article points to one conclusion. Time is the dominant variable in long-term wealth building. Contribution amount is secondary. The gap between starting now and starting five years from now, on identical $100 monthly contributions at 7%, is approximately $20,000: roughly $52,093 from 20 years versus $31,696 from 15 years.
The practical first step is straightforward. Identify your investable surplus. If your emergency fund is not yet in place, build that first. Once it is, set up a recurring monthly contribution into an investment account and let the compounding timeline begin.
$100 a month is a starting point, not a ceiling. As your income grows, each increase in contribution amount accelerates a trajectory already in motion. But the single variable that changes the outcome most is the start date.
Time, not amount, determines the outcome. The most financially rational response to everything in this article is to remove the delay and begin with what you have available now.
For readers ready to act on that first step, our dedicated guide to investing your first $1,000 walks through the specific brokerage account setup process, covering platform selection, index fund criteria, and the three mistakes that most commonly derail beginner investors before compounding has a chance to take hold.
This article is for informational purposes only and should not be considered financial advice. Investors should conduct their own research and consult with financial professionals before making investment decisions. Past performance does not guarantee future results. The 7% return assumption is illustrative, derived from the S&P 500’s long-term historical average, and actual returns will vary.
$100 a month invested at 7% annual returns grows to $52,093 over 20 years, with $28,093 of that total generated by compounding growth above your contributions. The starting amount matters far less than the length of time your money has to compound.
Dollar-cost averaging means investing a fixed dollar amount at regular intervals regardless of market conditions. When prices are lower your fixed contribution buys more shares, and when prices are higher it buys fewer, smoothing your average cost per share over time without requiring you to predict market direction.
On identical $100 monthly contributions at 7% returns, starting five years later reduces your final portfolio from $52,093 to $31,696, a difference of approximately $20,397 generated entirely by lost compounding time, not by any change in what you contributed.
A savings account at 1.8% generates less than $5,000 in actual growth on $24,000 contributed over 20 years, while an investment portfolio at 7% generates over $28,000 in growth above contributions over the same period. At 1.8%, inflation running at 2-3% annually produces a negative real return, so the nominal balance grows while purchasing power shrinks.
Three things should be in place first: a stable income that covers living expenses, an emergency fund of 3-6 months of expenses held in accessible cash, and a defined investable surplus. The emergency fund protects your ability to stay invested through volatility by ensuring you never need to liquidate positions at a loss to cover short-term needs.