
Passive Income Investing in Australia: What Actually Works
29 mins ago

The S&P 500 has returned approximately 10% annually in nominal terms since 1926. That single statistic represents nearly a century of compounding, yet most Americans never make their first investment because the process of getting started feels unnecessarily complicated. It does not need to be. A starting point of $1,000 is enough to open an account, buy a broadly diversified fund, and begin building wealth on the same trajectory that has rewarded patient investors for generations.
The barrier is rarely money. In 2024, roughly 30% of newer investors reported panic-selling during a market dip, not because the market was uniquely dangerous, but because they entered without a framework. This guide closes that gap before a single dollar is deployed. By the end, readers will know how to open a brokerage account, understand why index funds suit most beginners, read a basic stock quote, apply dollar-cost averaging, and recognise the three mistakes that derail most first-year investors. A same-day action checklist is included.
Investing is a commitment of capital that may not be accessible for months or years. Before opening any account, three prerequisites deserve attention, each taking less than five minutes to confirm.
FINRA’s “Five Tips for First-Time Investors” (April 2024) lists understanding risk tolerance and maintaining emergency savings as prerequisites for new market participants. The logic is straightforward: money invested in equities should not be money needed for rent, medical bills, or an unexpected job loss. An emergency fund covering three to six months of living expenses should be in place before any investable capital enters the market.
The second prerequisite is time horizon. An investor who needs the $1,000 back within 12 months faces a fundamentally different risk profile than one who can leave it untouched for a decade. Time horizon is the single most important variable a beginner can answer before selecting any investment vehicle.
The three primary instruments available to a first-time investor, shares, bonds, and ETFs, generate returns through fundamentally different mechanisms; understanding how each one works before selecting a vehicle is the layer most beginners skip in their rush to open an account.
The SEC’s Investor Bulletin (May 2024) recommends unleveraged investing for most beginners, noting that margin accounts can magnify losses and trigger forced selling at unfavourable prices.
Confirm these three checkpoints before proceeding:
A stock quote screen looks dense the first time. It is not. Every field on that screen answers a specific question, and once the parts have names, the screen becomes readable in seconds.
Consider pulling up a quote for a well-known S&P 500 ETF such as SPY or VOO. The following six fields appear on virtually every brokerage platform:
For a beginner holding a long-term index fund position, current price and 52-week range are the two most useful reference points during a quarterly portfolio check.
One additional metric worth understanding early is the price-to-earnings (P/E) ratio. P/E is calculated by dividing a company’s current share price by its annual earnings per share. A P/E of 20 means investors are paying $20 for every $1 of annual earnings.
P/E offers a rough sense of how expensive a stock is relative to what the company earns. However, it is context-dependent: a technology company growing at 30% annually may reasonably carry a higher P/E than a mature utility. At the beginner stage, P/E is worth noting but should not be used in isolation to make buy or sell decisions.
When buying an S&P 500 index fund, the reader is purchasing a proportional slice of all 500 companies’ quotes simultaneously. Understanding a single quote means understanding the building blocks of the entire fund.
Three brokerages consistently appear in beginner-focused evaluations: Fidelity, Charles Schwab, and Robinhood. On the dimensions that matter most to a first-time investor, they are closer than most comparison articles suggest.
| Feature | Fidelity | Charles Schwab | Robinhood |
|---|---|---|---|
| Account Minimum | $0 | $0 | $0 |
| Stock/ETF Commission | $0 | $0 | $0 |
| Fractional Shares Min. | $1 (Stocks by the Slice) | $5 (Schwab Stock Slices) | $1 |
| Beginner Education | Extensive research tools and educational library | Strong education platform plus 24/7 support and branch network | Limited; mobile-first design prioritises simplicity |
| Key Caution | Options carry per-contract fees | Options carry per-contract fees | App design may encourage frequent trading (SEC, January 2024) |
The single differentiating question: does the investor value educational depth and support infrastructure (Fidelity or Schwab), or mobile-first simplicity (Robinhood)? For a beginner deploying $1,000 into an index fund, all three platforms execute the task identically at zero commission.
The SEC’s “Investor Alert: Risks of App-Based Investing” (January 2024) warns that app features including gamification, push notifications, and options trading prompts may encourage excessive trading and risk-taking among new investors.
Before selecting any platform, verify the firm’s registration and disciplinary history through FINRA BrokerCheck, and confirm the brokerage is an SIPC member.
FINRA BrokerCheck allows investors to verify a brokerage firm’s registration status, licensing history, and any disclosed disciplinary actions before committing funds to an account, making it a practical first stop in the platform selection process.
The account opening process itself is mechanical:
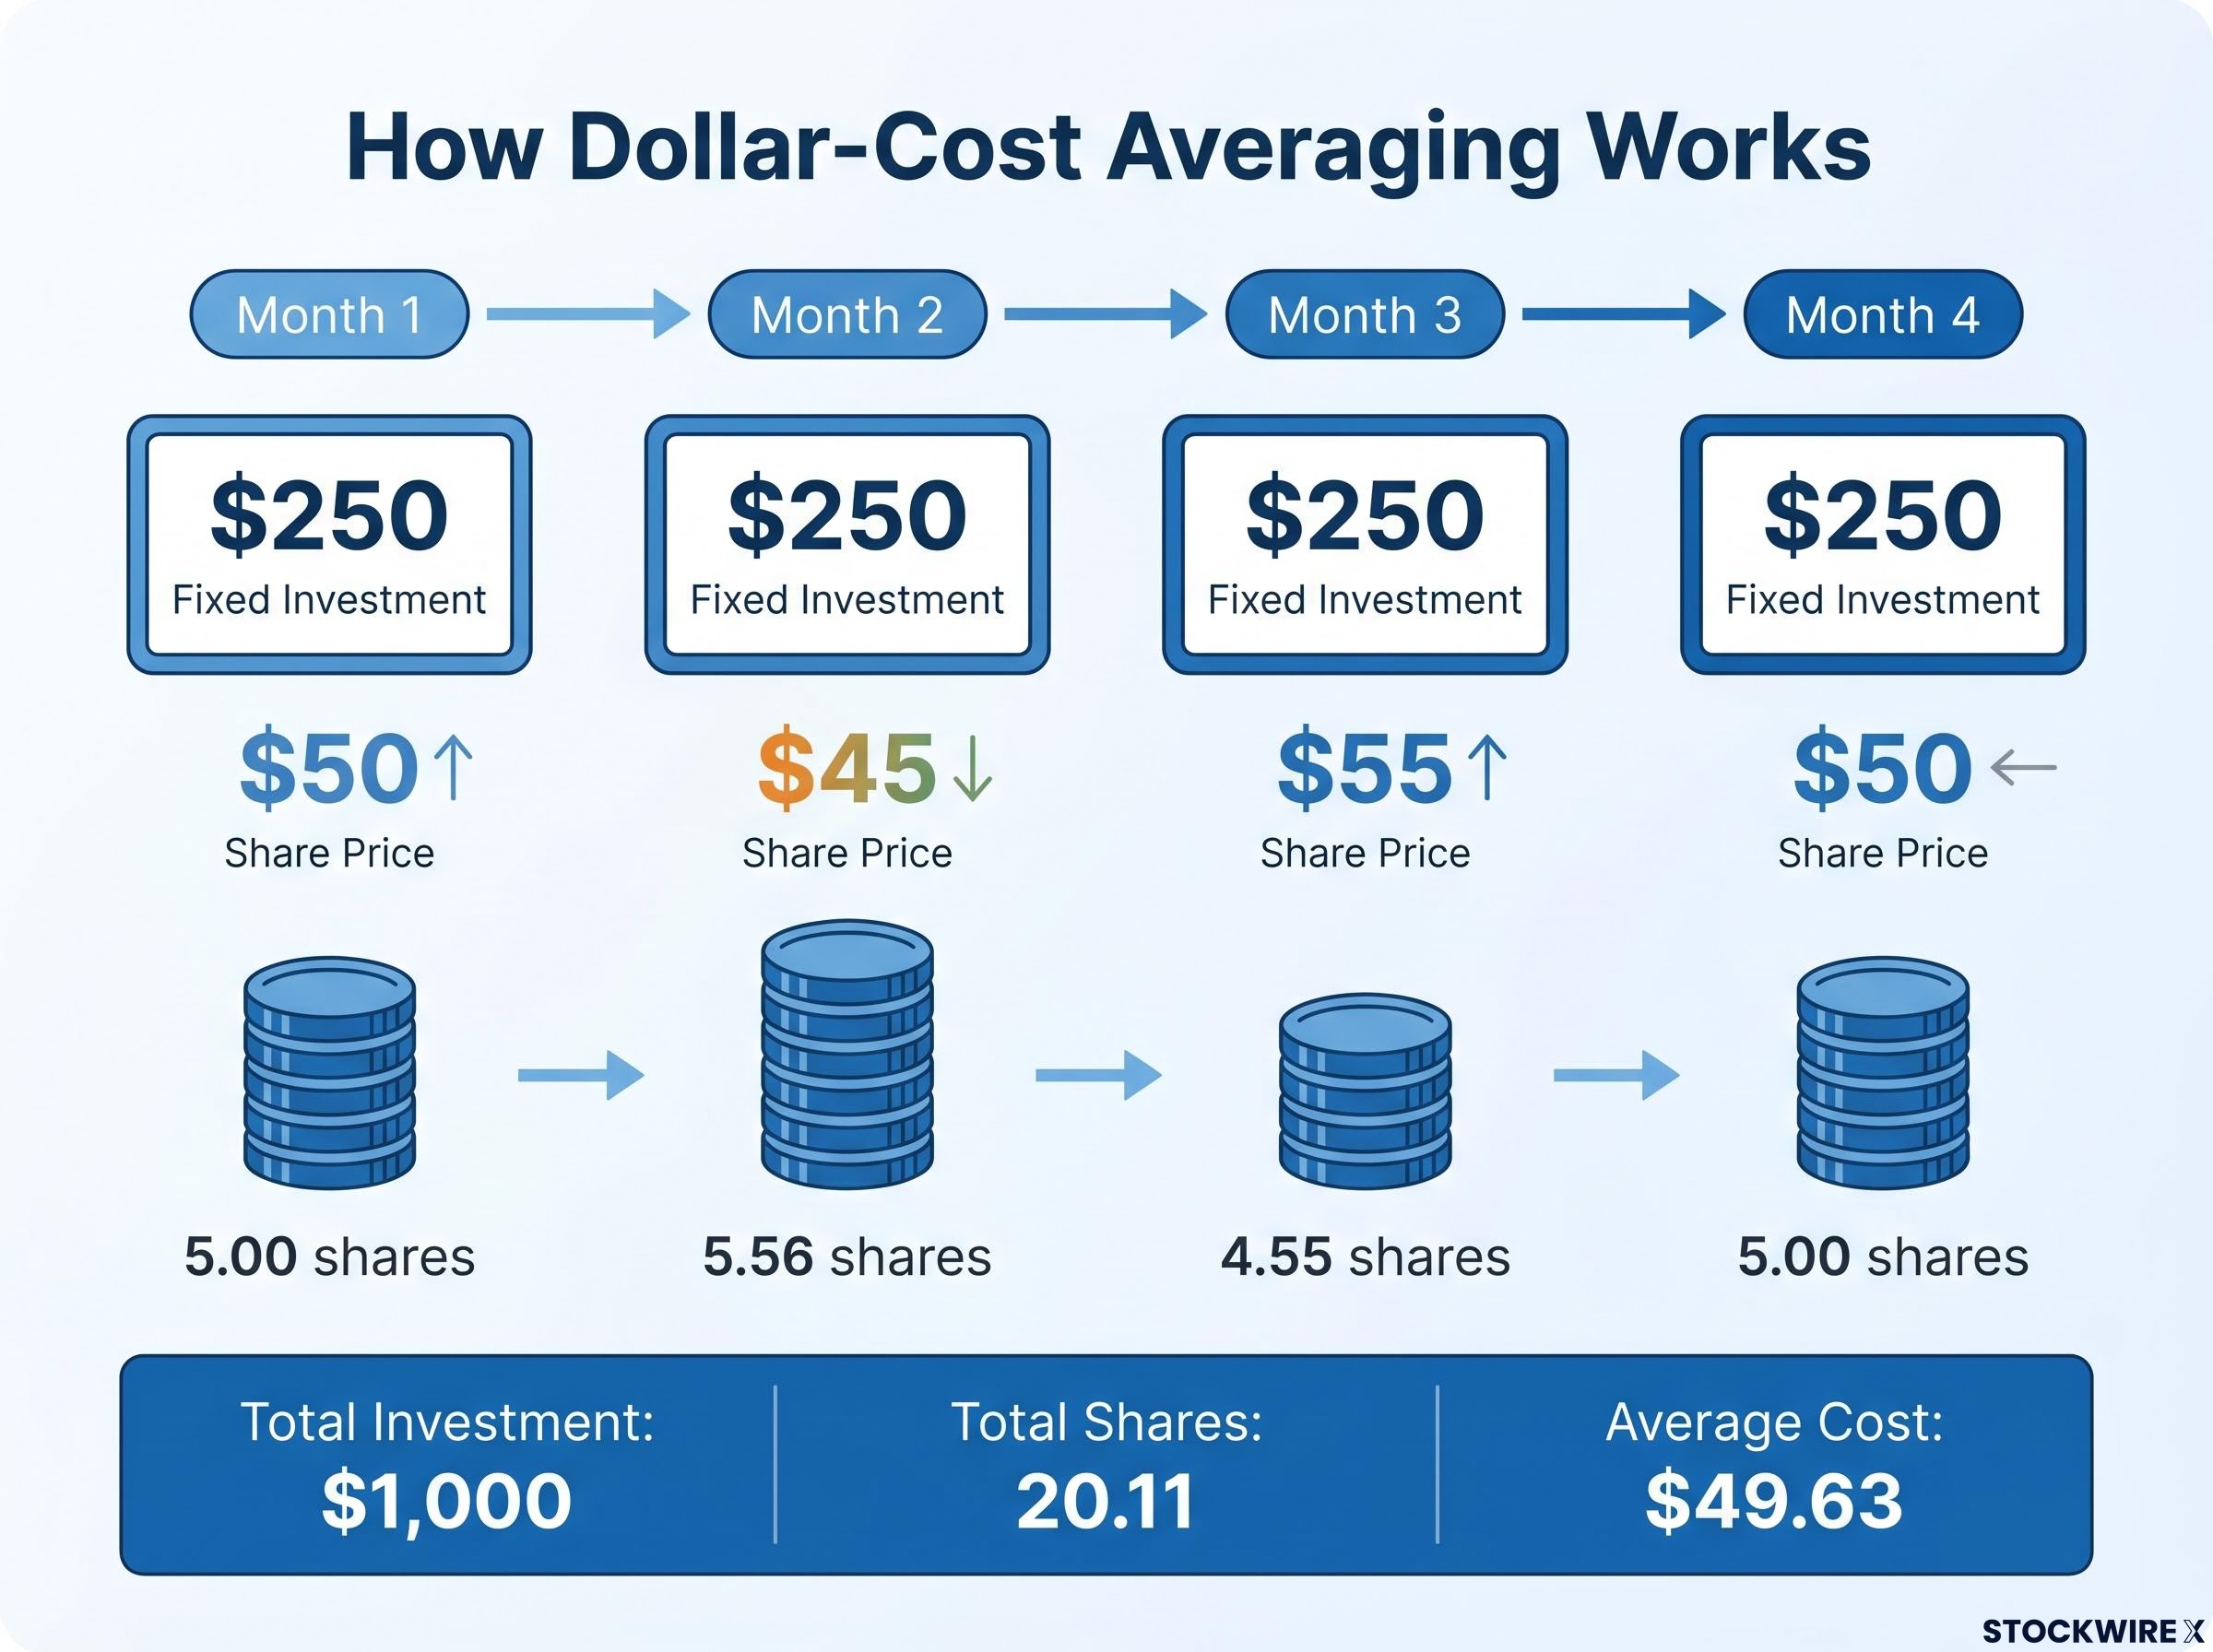
The question every new investor asks, “is now a good time to invest?”, has a practical answer. Dollar-cost averaging (DCA) means investing a fixed dollar amount at regular intervals regardless of market price. It converts a timing decision into a schedule.
Consider $1,000 split across four monthly instalments of $250:
| Month | Amount Invested | Hypothetical Share Price | Shares Purchased |
|---|---|---|---|
| 1 | $250 | $50 | 5.00 |
| 2 | $250 | $45 | 5.56 |
| 3 | $250 | $55 | 4.55 |
| 4 | $250 | $50 | 5.00 |
| Total | $1,000 | Avg. cost: $49.63 | 20.11 |
When the price dips in month two, the fixed $250 buys more shares. When it rises in month three, fewer shares are purchased. Over time, this mechanical process tends to smooth the average cost per share, reducing the psychological and financial risk of a single poorly-timed lump-sum entry.
Vanguard’s 2024 “How America Invests” report found that over 80% of retail clients made no trading changes during 2022-2023 volatility. The minority who did trade tended to sell after sharp declines, locking in losses. A scheduled DCA approach removes the temptation to react in those moments.
All three featured brokerages offer automatic recurring investment features, making DCA mechanically simple to maintain. Set it up in four steps:
For investors wanting to weigh DCA against lump-sum deployment before committing to a schedule, our dedicated guide to dollar-cost averaging data examines why lump-sum investing has outperformed DCA in 68-73% of historical periods, what the genuine behavioural case for DCA actually is, and how a hybrid approach can balance mathematical optimality with the consistency most retail investors need.
An index fund holds every stock in a given index, such as the S&P 500, in proportion to each company’s market weight. Buying one share of an S&P 500 index fund means owning a small slice of all 500 companies simultaneously. An individual stock, by contrast, concentrates the investment in a single company’s performance.
Concentration risk is the clearest structural argument for index funds over individual stocks: a single company failure in a five-stock portfolio destroys 20% of capital, while the same failure in a broad ETF where that company represents 1% of holdings produces only a fraction of a percent of portfolio drag.
The cost difference between index funds and actively managed funds is where the data becomes persuasive.
| Metric | Index Funds | Actively Managed Funds |
|---|---|---|
| Avg. Expense Ratio (2023) | ~0.05% | ~0.60%-0.66% |
| 30-Year Wealth Impact of Cost Gap | Baseline | ~20% reduction in ending wealth per 1% higher expense ratio |
| Active Manager Outperformance Rate | N/A | Most active stock pickers fail to beat broad indexes after costs |
| Best Suited For | Beginners, long-term investors, core portfolio holdings | Investors seeking specific sector exposure or active strategies |
According to Morningstar (March 2024), each 1-percentage-point increase in expense ratio reduces ending wealth by approximately 20% over a 30-year horizon. On a typical contribution stream, a 0.6% annual fee gap can erode tens of thousands of dollars.
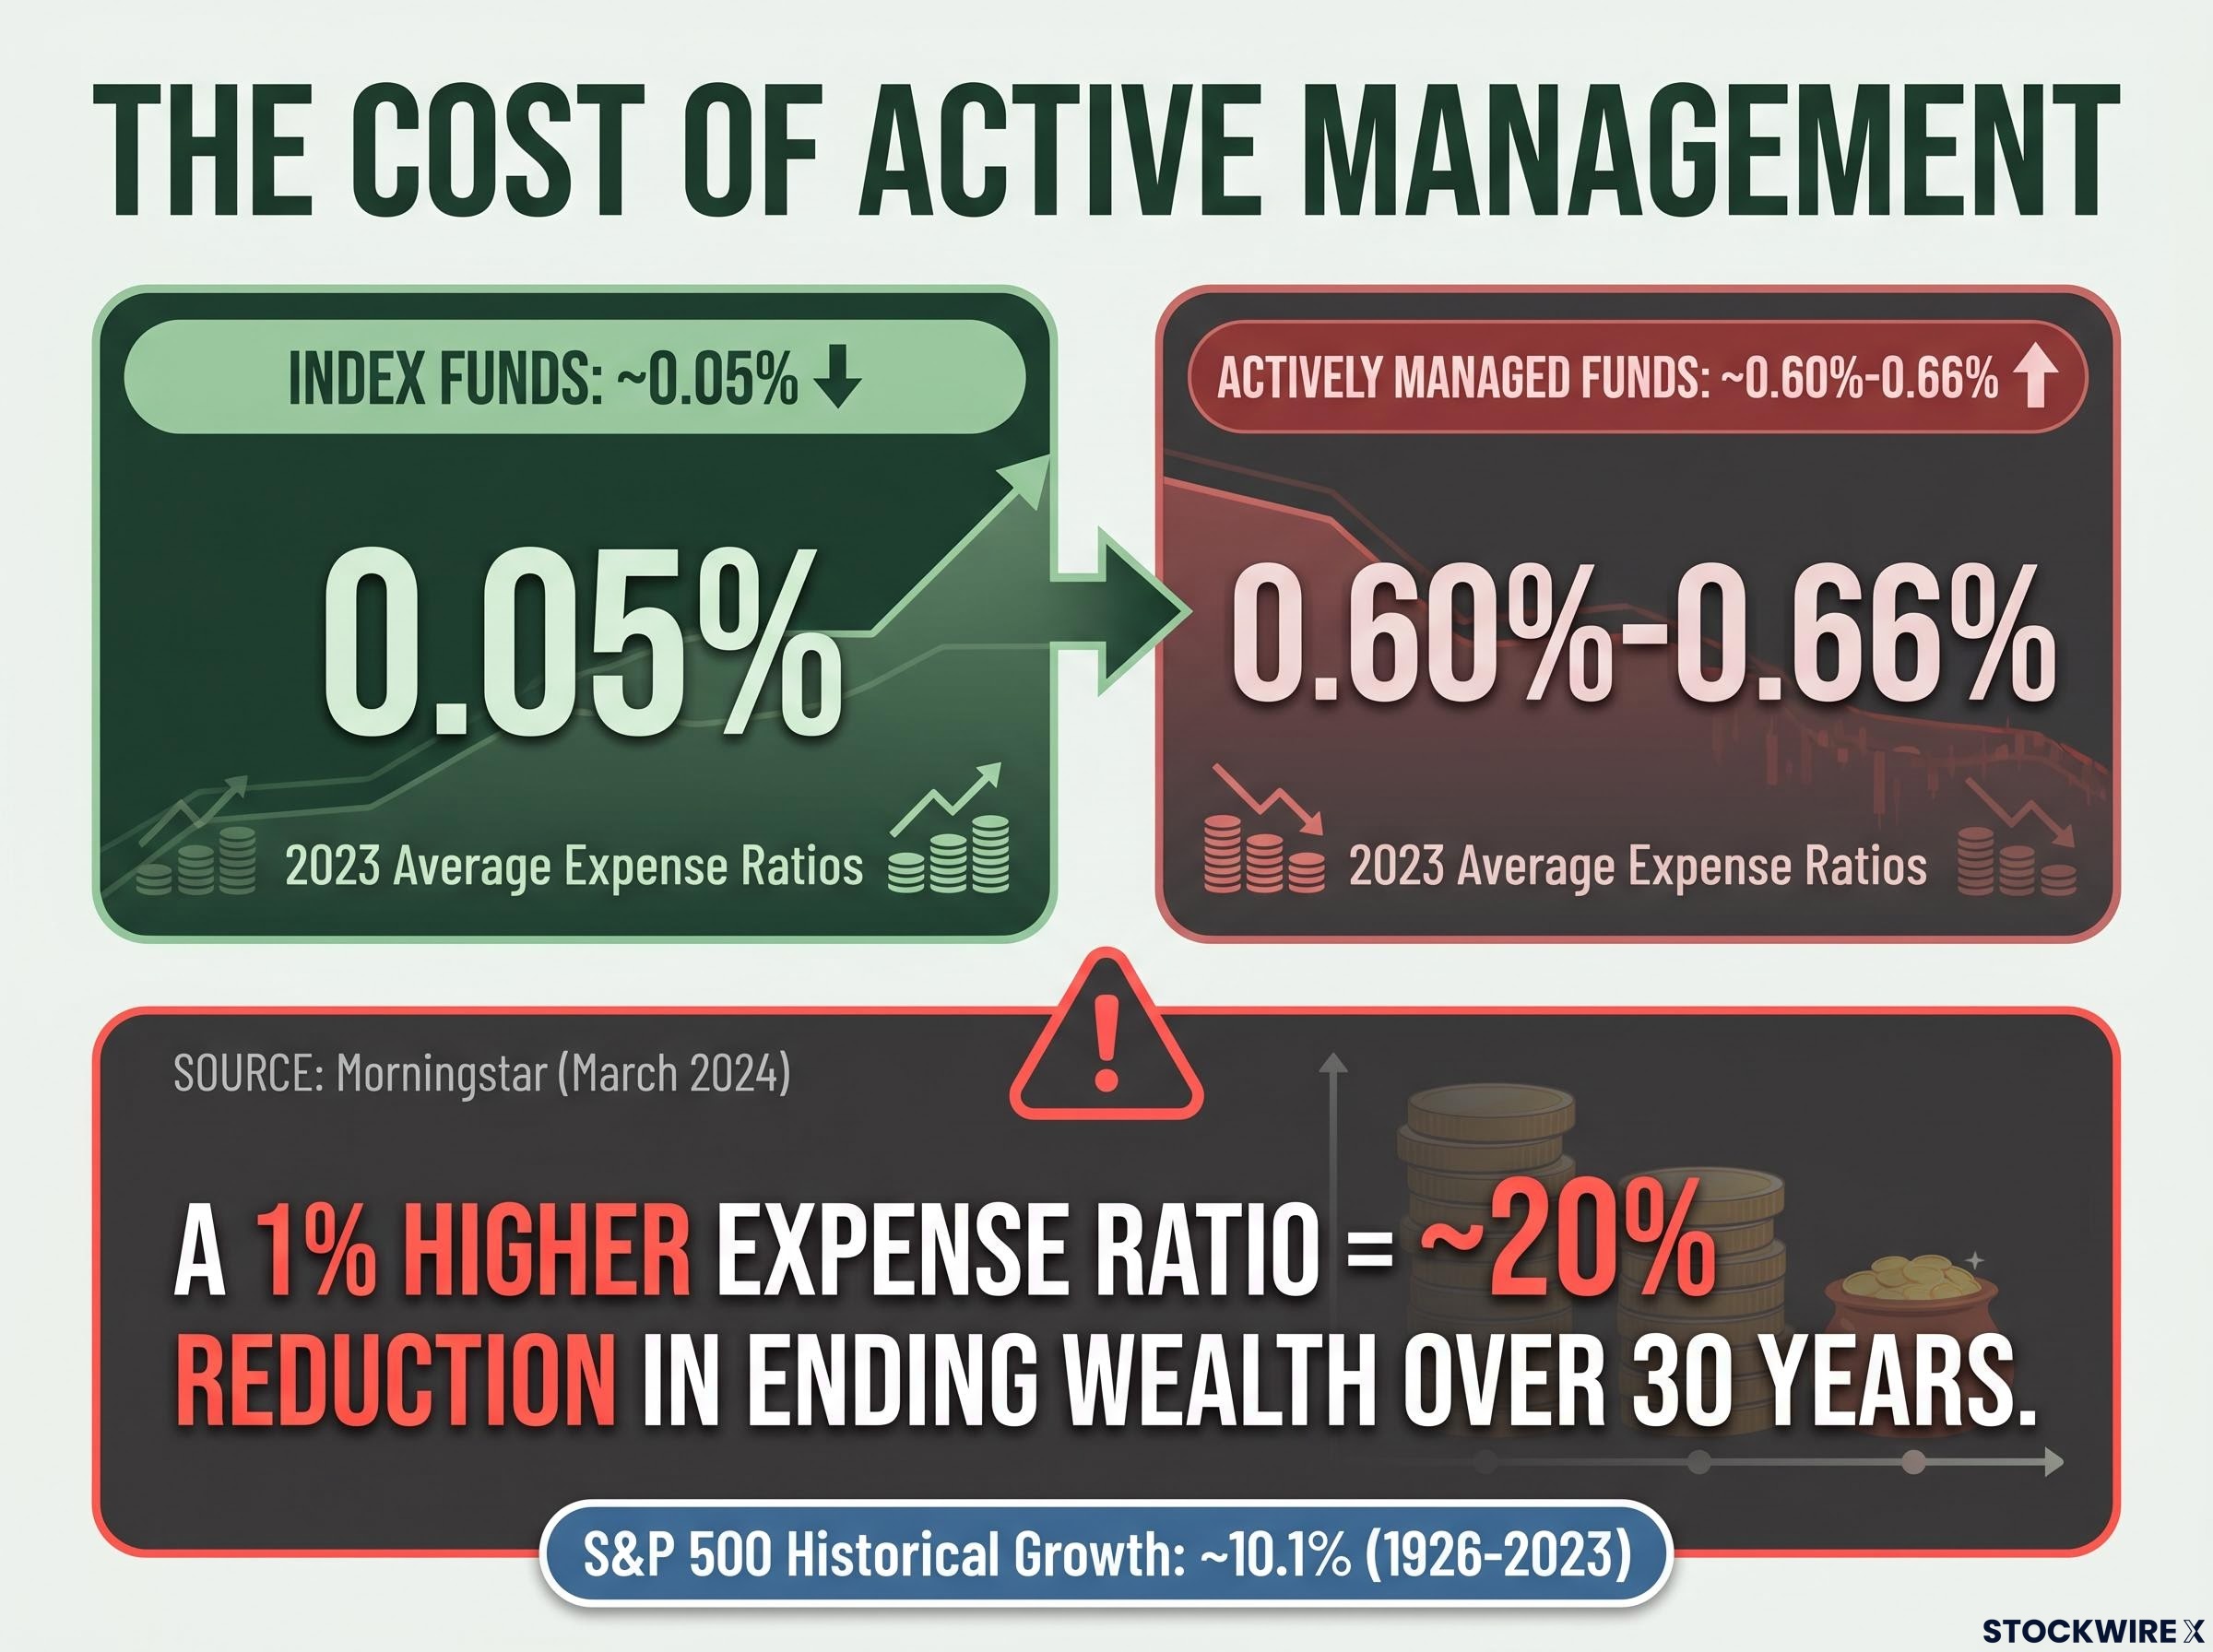
The S&P 500 has delivered a compound annual growth rate of approximately 10.1% in nominal terms from 1926 through 2023, according to Morningstar. Jason Zweig of The Wall Street Journal reported in May 2024 that the case for index funds is stronger than ever, with most active stock pickers failing to beat broad indexes after costs. Morningstar’s Amy Arnott recommended broad-market index funds as the default for new investors in March 2024, citing diversification, low cost, and simplicity.
Three reasons index funds suit beginners:
Vanguard’s “core and satellite” framework positions broad index funds as the portfolio foundation. Individual stocks, if desired, function only as a limited add-on after that core is established. For someone starting with $1,000, the core is the entire portfolio.
Every section of this guide has been structured to prevent what comes next. The three most common first-year mistakes are well-documented, and the framework covered above addresses each one directly.
According to the FINRA Investor Education Foundation (April 2024), approximately 30% of investors who began investing after 2020 reported selling during a market drop because they were worried about losing more money.
Vanguard’s data tells the other side: over 80% of experienced retail clients made no trading changes during 2022-2023 volatility. Those who held steady did not need to recover locked-in losses.
Behavioral return drag, the performance gap created by panic-selling, delayed re-entry, and missed employer matches, costs the average investor an estimated 1-2 percentage points in annual returns, a figure that compounds into a six-figure gap over a typical 30-year accumulation period.
The prescription is simple. Before placing a first purchase, write a one-sentence investment policy: “I will not sell during a decline of less than [a specific percentage].” The act of writing it down creates a decision anchor that reduces impulsive selling during volatile sessions.
Among newer investors surveyed by the FINRA Foundation in 2024, approximately 20% reported trading at least once per week, and roughly 40% traded at least once per month. A Federal Reserve Board working paper (February 2024) found that app-based brokerage users trade significantly more frequently than traditional brokerage clients, and that frequent trading correlates with lower risk-adjusted returns for small retail investors.
The DCA automation covered earlier solves this directly. Enable recurring purchases, set a quarterly-only review schedule, and remove the temptation to react to daily price movements.
According to Morningstar’s Ben Johnson (March 2024), each 1% increase in expense ratio reduces 30-year ending wealth by approximately 20%. Low-fee funds are more likely to outperform over time, and fund expenses remain one of the strongest predictors of future net returns.
Check every fund’s expense ratio before buying. Target below 0.20% for broad index funds. Reject anything above 1% when low-cost index alternatives exist, as Bankrate’s James Royal recommended in January 2024.
Every decision covered in this guide consolidates into a same-day action checklist:
The structural decisions covered in this guide, brokerage selection, index fund allocation, dollar-cost averaging, and fee awareness, compound over time in the same way that investment returns do. Good habits, maintained consistently, are worth more than a larger starting balance deployed without a framework.
The S&P 500’s approximately 10.1% nominal compound annual growth rate since 1926 is the long-run reward for disciplined, patient investing. That reward is not reserved for professionals or large accounts. It is available to anyone who builds the structure first and then lets time do the work.
The next step is not a bigger investment. It is executing the same-day checklist above and then leaving the portfolio alone for 90 days.
This article is for informational purposes only and should not be considered financial advice. Investors should conduct their own research and consult with financial professionals before making investment decisions. Past performance does not guarantee future results. Financial projections are subject to market conditions and various risk factors.
—
Open a brokerage account with a zero-minimum platform such as Fidelity, Charles Schwab, or Robinhood, then invest in a broad-market S&P 500 index fund with an expense ratio below 0.20%. Using dollar-cost averaging to split your $1,000 into regular monthly contributions reduces the risk of a poorly-timed lump-sum entry.
Dollar-cost averaging means investing a fixed dollar amount at regular intervals regardless of market price, so you automatically buy more shares when prices are low and fewer when prices are high. For example, splitting $1,000 into four monthly instalments of $250 can lower your average cost per share compared to investing the full amount on a single day.
Before investing, confirm you have an emergency fund covering three to six months of living expenses in a liquid account, establish a clear time horizon for when you might need the money back, and verify any brokerage you consider is an SIPC member. FINRA recommends these steps as prerequisites to ensure invested capital is money you can afford to leave in the market.
Index funds spread your money across hundreds of companies in a single purchase, eliminating the concentrated risk of a single-company failure destroying a large portion of your capital. Their average expense ratio of around 0.05% is far below the 0.60%-0.66% typical of actively managed funds, and Morningstar data shows that each 1% increase in expense ratio reduces 30-year ending wealth by approximately 20%.
A stock quote shows six key fields: the ticker symbol, current price, day's range, 52-week range, volume, and market capitalisation. For a beginner holding a long-term index fund, the current price and 52-week range are the two most useful reference points to check during a quarterly portfolio review.


