
A trader runs a scanner, spots an IV Rank reading of 80, and sells a put feeling like the setup is confirmed. The credit lands in the account at $0.90. Only after the fact does the realisation arrive: the absolute volatility on that name was sitting in the low teens, and the premium collected was never going to justify the capital tied up for three weeks. That is not a rare mistake. It is one of the most common traps in premium selling, and it comes from treating a relative metric as if it answers a question it was never built to answer.
IV Rank and IV Percentile are genuinely useful. They direct attention. They tell a trader where current volatility sits inside its own recent history, which is a sensible way to surface candidates worth a second look. The problem is that screening and deciding are two different steps, and conflating them quietly erodes return on capital one undersized credit at a time.
This piece lays out an implied volatility premium selling framework built around a different primary input: absolute IVX rather than relative rank. The argument runs through real ticker contrasts and specific volatility thresholds, and by the end you will have a clean decision sequence that separates trades genuinely worth taking from the ones that only look attractive on a scanner.
IV Rank tells you where volatility sits, not whether it is high enough to matter
The intuitive assumption is that a high IV Rank reading is reason enough to sell premium. It feels like confirmation. The metric is elevated, the scanner flags it, the trade gets entered. The trouble is that the assumption rests on a misunderstanding of what the number actually measures.
IV Rank is a 52-week relative figure. It tells you only where current IVX sits between its own high and low over the past year. It says nothing about the absolute level, and the absolute level is what determines how many dollars of premium land in the account.
The mechanics behind how platforms derive that IVX number matter more than most traders realise: implied volatility basics established through reverse-engineering the Black-Scholes model from live prices mean the figure is a collective market expectation, not a backward-looking average, and every Greek and probability estimate downstream shifts the moment that single input moves.
That design creates a structural blind spot in two specific situations:
- Event-driven spikes in the lookback window. If the prior year included a volatility shock, a meme-stock squeeze or a major FDA catalyst, current absolute IVX can remain genuinely high while the rank reads as moderate, because the comparison point is that earlier extreme.
- Prolonged low-volatility regimes. When the 52-week baseline is compressed, even a modest uptick in IVX can score as “high” on the rank scale, flattering a name whose absolute volatility is still thin.
Relative frameworks are built on exactly these bands. Lambda Finance’s March 2026 guidance segments IV Rank into 0-30% for buying premium, 50-70% for selling, and 70-100% for aggressive selling. QuantWheel adds a supplementary relative filter in its March 2026 note, screening for an IV-to-HV ratio above 1.2. Both are reasonable attention-directing tools. Neither tells you whether the premium on offer is worth collecting.
StoneX makes the point plainly: “high implied volatility” is subjective, and what counts as high depends entirely on an instrument’s normal deviation. A 10% reading may be elevated for one share and unremarkable for another.
This is where raw IVX earns its place as the final input. It directly sets the dollar size of the premium and therefore the return on capital. A trader leaning only on relative rank can pass every screening test and still walk away with a credit too small to justify the buying power committed, which is the practical cost of treating a screening tool as a decision tool. Consider TLT as a preview: at an IV Rank near 43, its absolute IVX was still only around 13%. The rank said “moderately elevated.” The dollars said “not worth it.”
When big ASX news breaks, our subscribers know first
What the RKLB versus XEL comparison actually shows about premium value
The cleanest way to see IVX do its work is to hold everything else constant. Take two stocks trading at nearly the same price and let implied volatility be the only variable that moves. That is effectively a controlled experiment, and Rocket Lab (RKLB) against Xcel Energy (XEL) supplies it.
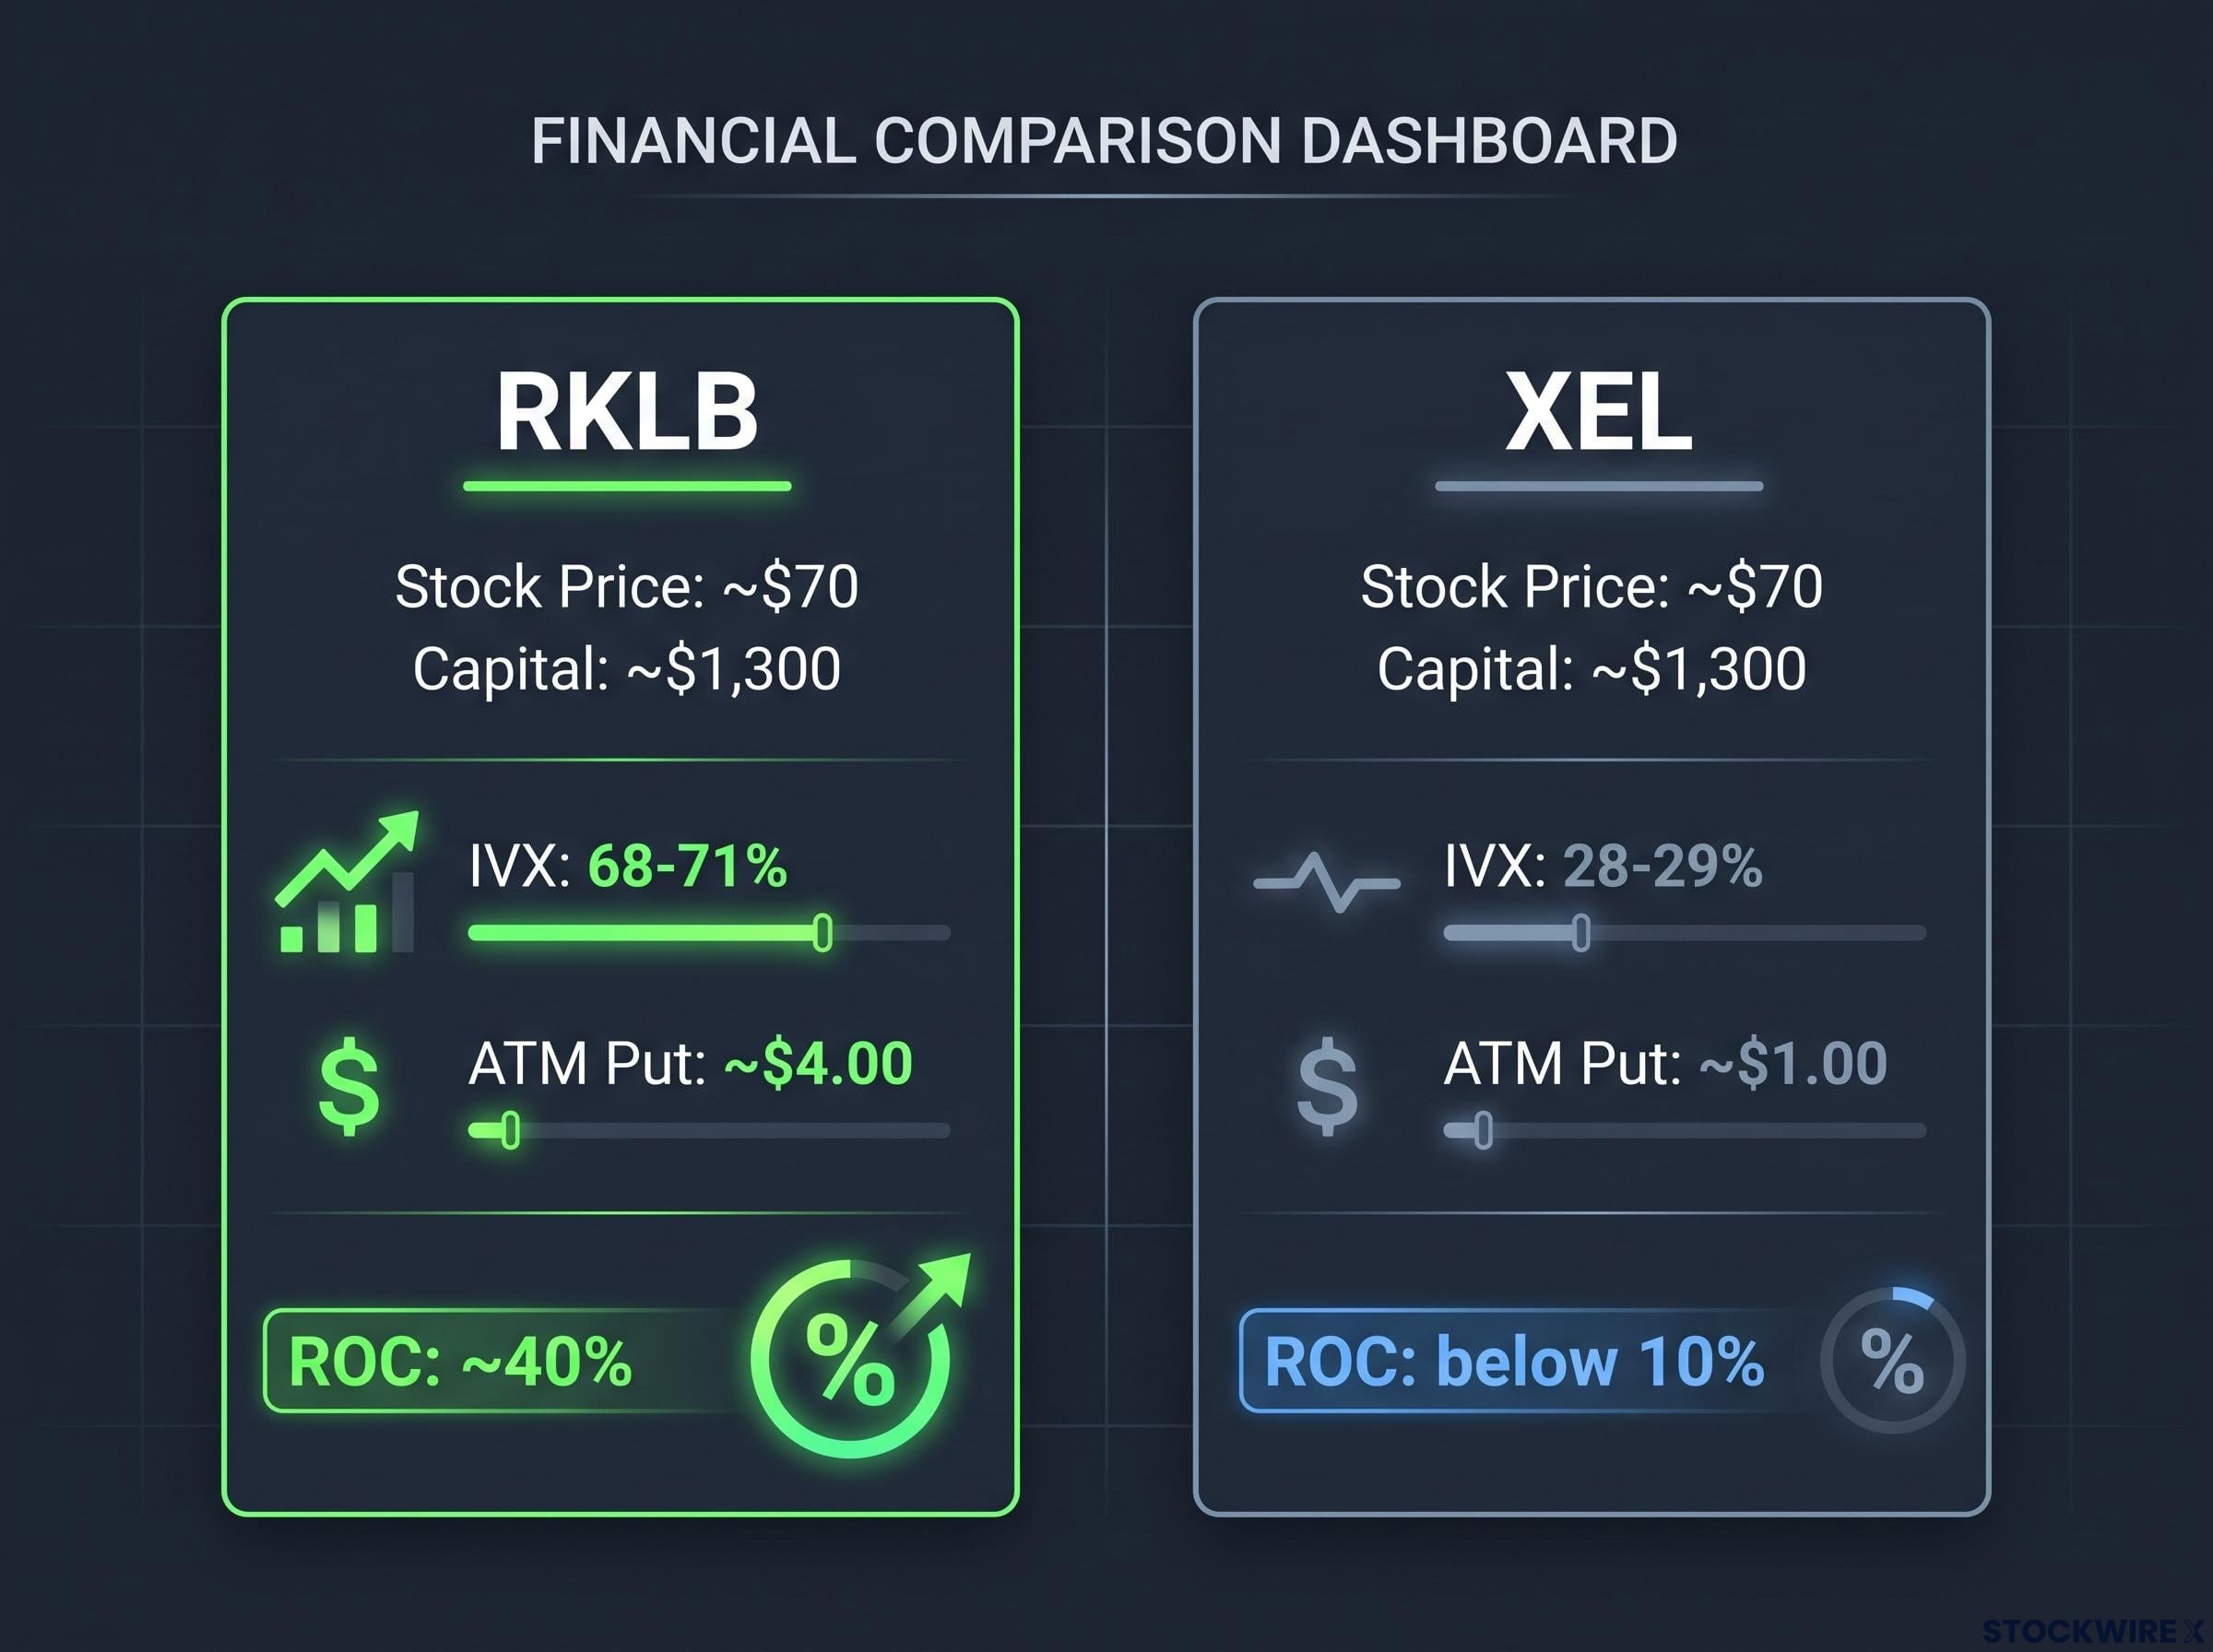
Both traded around $70. On the original platform data at the time of recording, RKLB carried an IVX of 68-71%, and its at-the-money put in a roughly 23-day cycle priced near $4.00. That setup required about $1,300 in buying power and generated a return on capital approaching 40%.
The return on capital calculation that makes RKLB’s 40% figure meaningful uses buying power as the denominator, not maximum possible loss; a trader who divides credit by the wrong base will consistently overstate the quality of high-IVX trades and understate how much capital is actually committed per cycle.
XEL sat at the same $70 with an IVX of 28-29%. The equivalent at-the-money put priced near $1.00 on the same $1,300 of capital, returning below 10%.
| Ticker | Stock Price | IVX | ATM Put | Approx. ROC |
|---|---|---|---|---|
| RKLB | ~$70 | 68-71% | ~$4.00 | ~40% |
| XEL | ~$70 | 28-29% | ~$1.00 | below 10% |
| PayPal | ~$52 | ~35% | mid-range | mid-range |
The same $1,300 produced roughly four times the premium in RKLB versus XEL, and the only thing that changed was implied volatility. That tells you something uncomfortable about capital efficiency in premium selling: the outcome is almost entirely a function of where you deploy, not how much. PayPal, cited near $52 with around 35% IVX, sits in the middle of that landscape, a reminder that most names fall somewhere between the two extremes.
The twist is in RKLB’s rank. At the time, its IV Rank was near the low end of its range, having peaked closer to 120% earlier in the year. A rank-first screener would have deprioritised it. The absolute IVX, meanwhile, was handing a seller nearly 40% on capital. That is precisely the disconnect this framework is built to catch.
The implication is close to a rule of thumb: roughly double the IVX produces roughly double the available premium across comparable expirations and strikes. The stock price is a distraction. The volatility is the signal.
The 50-100% IVX sweet spot and when low volatility changes the playbook entirely
A preferred operating range gives the framework teeth. For premium selling, that range is an absolute IVX of roughly 50% to 100%. Below the floor, premiums are too thin to hit meaningful return-on-capital targets. Above the ceiling, tail risk begins to dominate the distribution and the seller is no longer being paid fairly for the exposure. The zone in between is where the structural edge is cleanest.
The logic of the lower boundary becomes obvious when you look at what happens if you ignore it.
When the low-volatility environment calls for a strategy switch
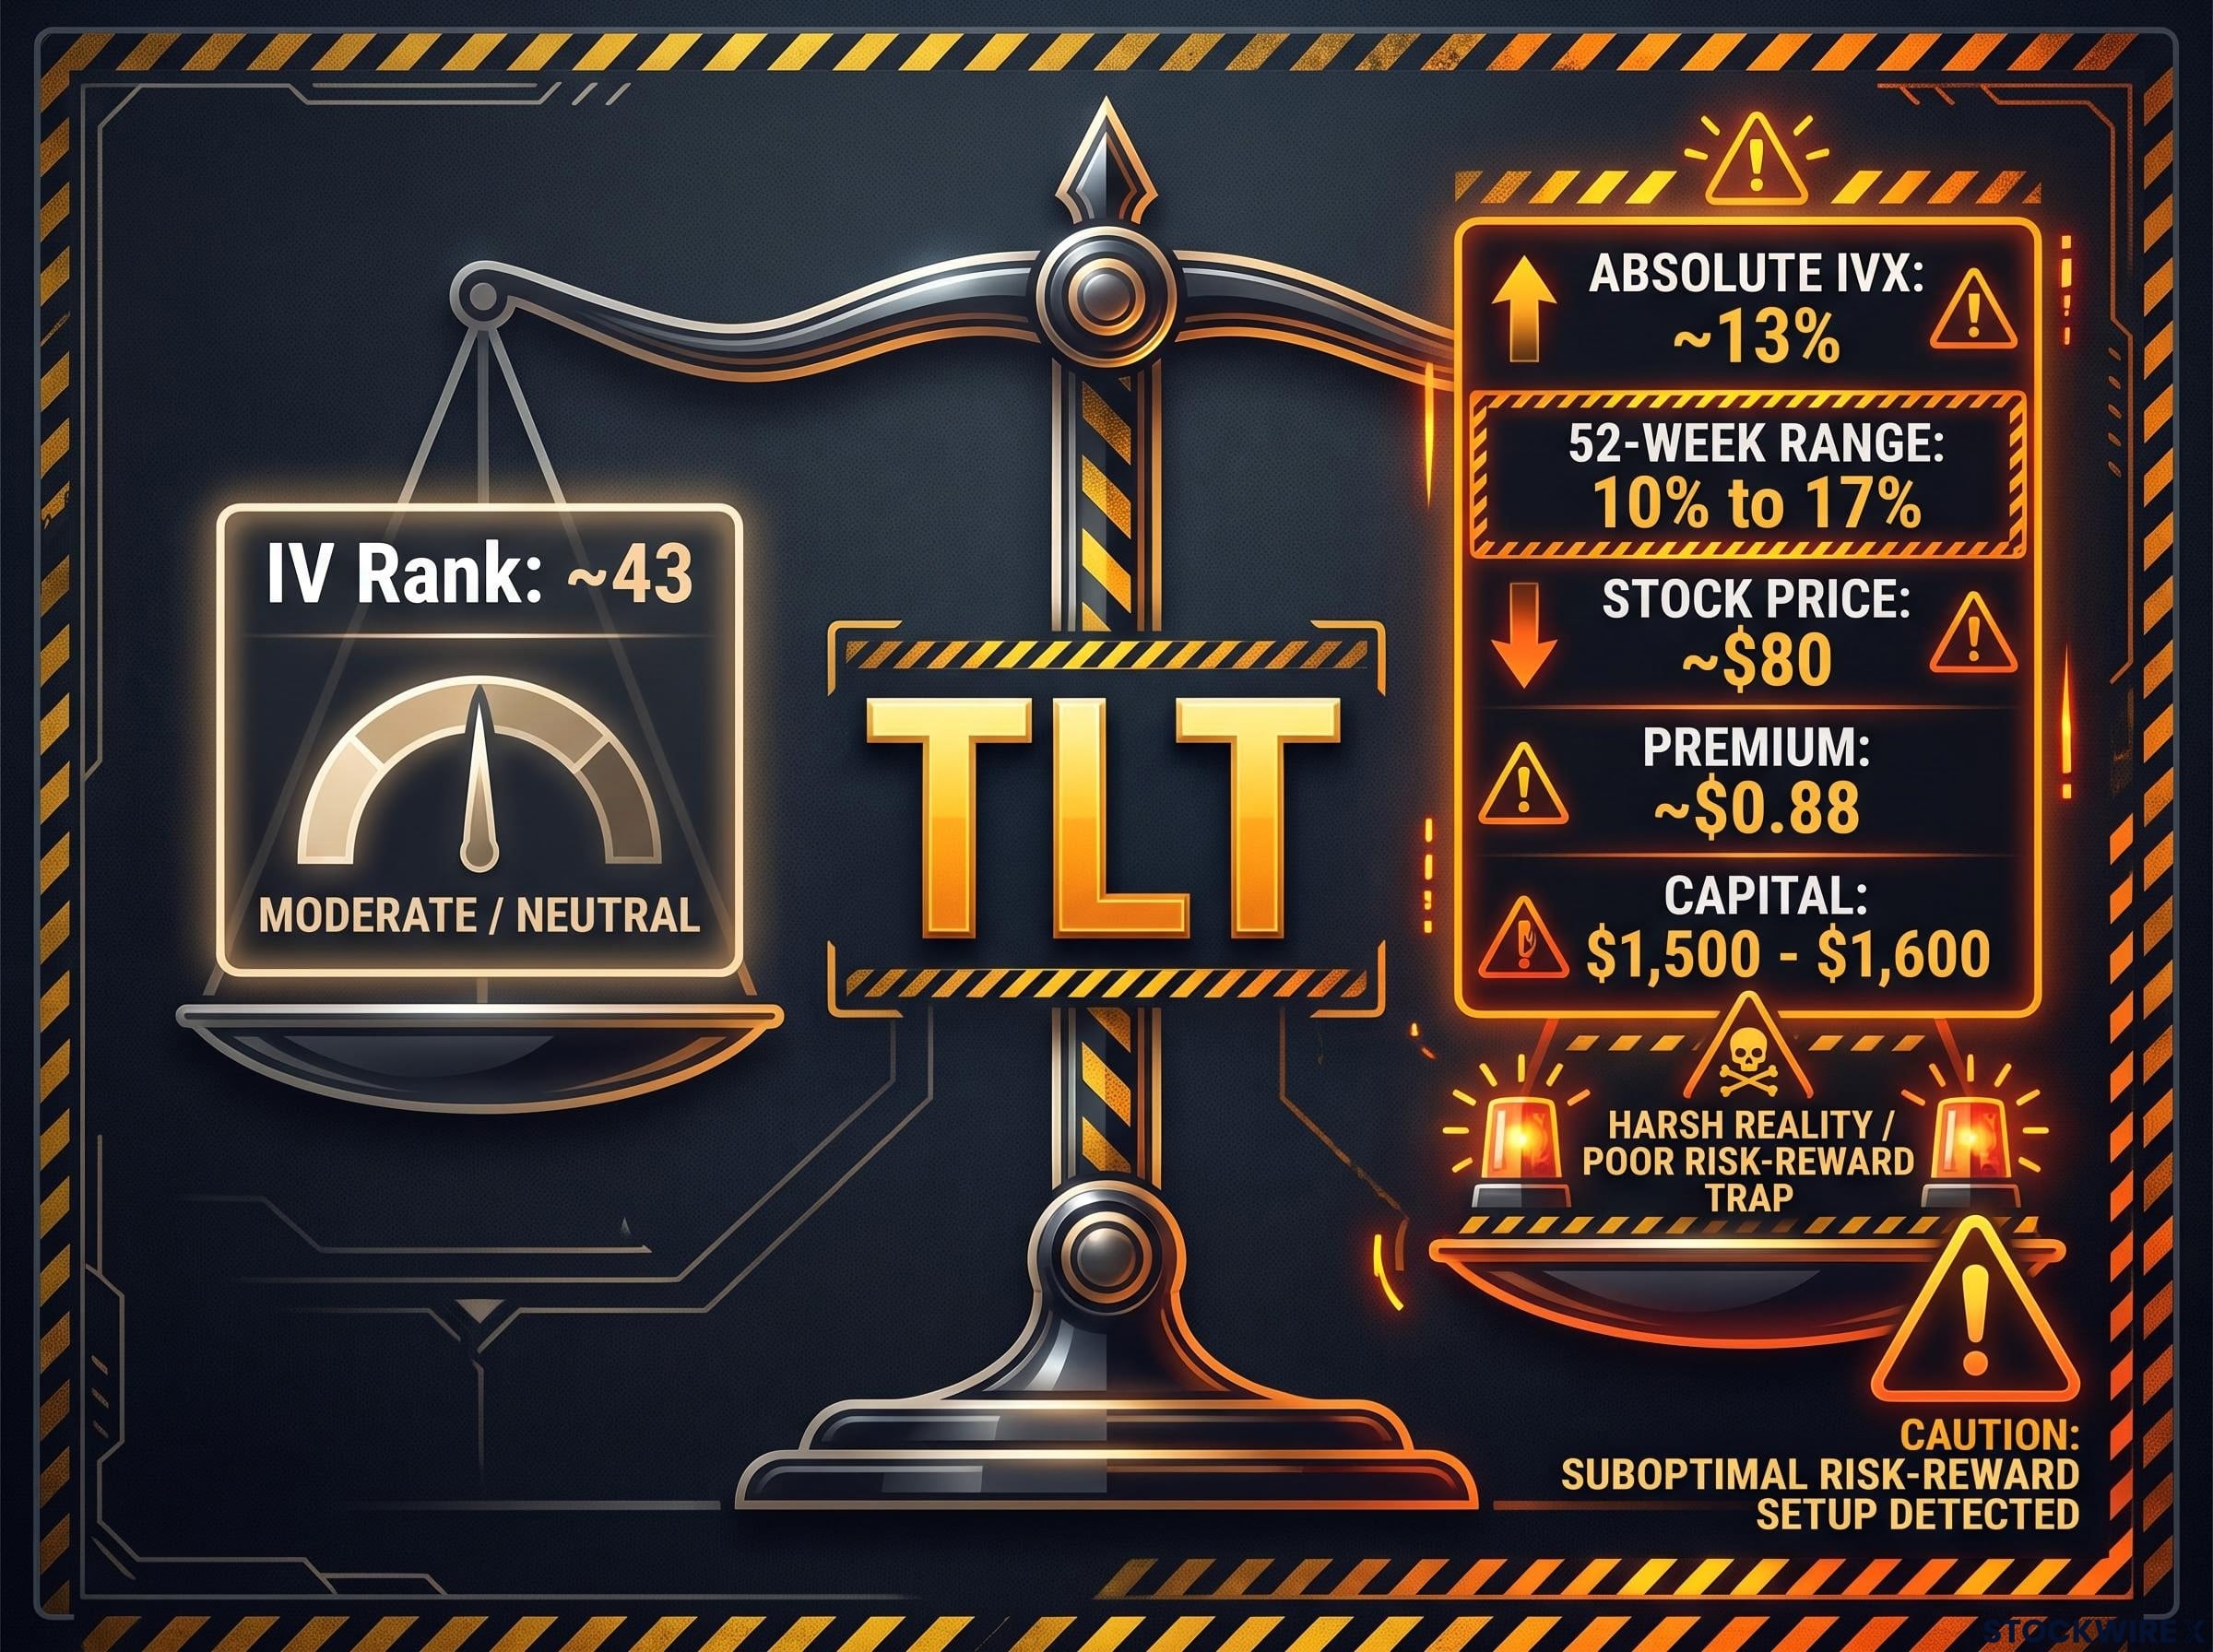
TLT, the iShares 20+ Year Treasury Bond ETF, is the cautionary case. It traded around $80 with an IVX of roughly 13%, inside a narrow 52-week range of about 10% to 17%. Its IV Rank at the time of recording was approximately 43, which a rank-first scan might read as mildly interesting.
The dollars tell the real story. At-the-money options traded below $1.00, with a premium near $0.88 against $1,500-$1,600 in required capital. That is near-zero return for real buying power committed.
Even if TLT climbed to a 100 IV Rank, its absolute IVX would likely only reach about 18%, still well short of the preferred threshold. The ceiling of its entire volatility range sits below where premium selling makes sense.
There is a further wrinkle. A five-percentage-point contraction in IVX barely registers on a TLT position, whereas the same contraction in a high-IV name like RKLB moves the needle meaningfully. The margin for a premium seller in thin volatility is simply too narrow to matter.
The correct response is not to force the trade. It is to switch vehicles. When IVX falls into the low teens, options become structurally cheap, and the edge flips from sellers to buyers. Defined-risk debit structures become the appropriate tool:
- Check the absolute IVX reading first, before anything else.
- Compare it against the roughly 50% floor for premium selling.
- If it sits below, pivot to a debit strategy rather than selling thin premium.
- Confirm capital efficiency against your return target before entering.
Preferred debit structures include long calls, bull and bear vertical spreads, and LEAPs for longer-dated directional exposure. Each caps downside to the premium paid while keeping the trader positioned for a directional move and for a potential mean-reversion of IVX back upward. This aligns with educator consensus from Investopedia, TastyLive, and Groww, and with Lambda Finance’s March 2026 recommendation of the 0-30% IV Rank band for buying rather than selling premium. TLT, in short, is not a low-risk premium trade. It is a structurally different environment where the edge belongs to buyers.
For investors wanting to work through the TLT case in full detail, our full explainer on premium selling in low-IV ETFs covers the specific debit structures, including the bearish ZEBRA, that replace the premium-selling playbook when IV falls below the viable threshold.
Why extreme implied volatility above 150-200% is also avoided, not chased
The upper boundary is less intuitive than the lower one. A thin-premium environment is easy to reject because the credit is visibly small. An extreme-volatility environment is dangerous precisely because the credit looks generous. The fat premium is the lure, and the risk underneath it is the trap.
Implied volatility in the 150-200% range and above does not appear because sellers are being handed free money. It appears because the market is genuinely pricing in a catastrophic or binary outcome. The premium reflects that probability, not seller generosity.
Three failure modes make these environments hazardous for premium sellers:
- The fat-premium illusion. The credit looks attractive in isolation, but the tail risk dwarfs it. The dollars received do not compensate for the size of the move being priced.
- Vega expansion pain. Groww warns that short-premium positions can suffer severe mark-to-market losses if IV expands further after entry, even when the underlying barely moves. Panic feeds on itself.
- Unlimited downside on undefined risk. Charles Schwab’s January 2026 commentary, alongside Investopedia and CMC Markets, notes that high IV directly reflects outsized expected price changes, leaving naked short options exposed to potentially catastrophic one-day losses.
Biotech names ahead of FDA decisions are the canonical example.
QuantWheel frames it directly: selling a put on a biotech stock carrying 120% implied volatility may look attractive on the credit received, but a 50% gap-down potential skews the risk-reward heavily against the seller.
That is the whole point. A 200% IVX reading is not a premium opportunity with bonus upside. It is a signal that the market has assigned real probability to an outcome that could render the option worthless or the seller insolvent. The sensible practical ceiling sits around 100% IVX, where premiums are rich but tail risk has not yet overwhelmed the edge. Knowing the top of the range protects against the loss scenarios that tend to arrive fast and without warning, which makes the upper boundary every bit as important as the floor.
Building a repeatable decision sequence around IVX rather than rank
Everything so far points toward a workflow rather than a principle. IV Rank and IV Percentile keep their role as first-pass filters that surface candidates worth examining. Absolute IVX then makes the actual call: sell premium, pivot to debit, or pass entirely.
Relative screens are commonly parameterised in practice. The TradingView IV Rank script from January 2025 sets programmatic bands of 0-10 very low, 10-35 normal, 35-50 almost high, 50-75 definitely high, and above 75 ultra high. Treat that as a screening layer, not a decision layer. QuantWheel’s IV/HV ratio above 1.2 adds a quality confirmation on top. Both narrow the field. Neither signs off on the trade.
The IVX reading maps onto three distinct zones.
| IVX Zone | Approx. IVX Range | Indicated Strategy | Example |
|---|---|---|---|
| Low IV | below ~20% | Debit structures | TLT |
| Sweet spot | 50-100% | Premium selling | RKLB |
| Extreme IV | above ~150% | Avoid or size down | Biotech FDA events |
Applied as a sequence, the workflow is short:
- Run an IV Rank screen to surface elevated-IV candidates.
- Check the absolute IVX level against the three-zone map.
- Select the strategy archetype that fits the zone.
- Confirm the return on capital clears your target before entry.
The RKLB versus XEL contrast grounds the whole thing in observed numbers. An IVX gap of roughly 40 percentage points produced a fourfold difference in premium on identical capital. A trader who runs this map consistently is not merely optimising individual trades; they are building the habit of deploying capital only where the structural edge is confirmed, which compounds into materially better risk-adjusted returns over time.
Credit spread mechanics extend the IVX framework directly into defined-risk structures, where theta works as a daily tailwind and the short strike’s delta encodes a specific probability of profit at entry, making the strategy a natural companion to naked put selling when a trader wants the same IV-driven edge with capped downside.
What IVX-first thinking actually changes about how you trade
The two metrics answer two different questions. Relative rank asks whether volatility is elevated compared to a name’s own history. Absolute IVX asks whether the environment is rich enough to make selling premium the right edge right now. Both matter. Only one makes the final call.
The behavioural change is concrete. A trader who screens on IVX first will reject a meaningful share of high-rank names that absolute volatility reveals as too thin, and will occasionally keep high-IVX names that rank screens would have filtered out. RKLB is the standing example: a low-end IV Rank, but a 68-71% absolute IVX that delivered nearly 40% return on capital. Rank-first filters it out. IVX-first keeps it in.
There is a probabilistic reason the sweet spot works. Lambda Finance’s March 2026 analysis notes that implied volatility overstates realised volatility roughly 85% of the time above a 50% IV Rank, which is the statistical basis for a consistent seller edge in that zone.
Three zones, applied across equities, ETFs, and sectors alike:
- Below 20% IVX: favour debit structures.
- 50-100% IVX: the premium-selling sweet spot.
- Above 150% IVX: avoid or reduce size materially.
The RKLB versus XEL comparison showed that the most consequential options decisions are not made at the strike or expiration level. They are made at ticker selection, which is exactly where IVX does its most important work. Adopting it as the primary variable does not add complexity; it removes a layer of ambiguity and replaces it with a cleaner input.
This article is for informational purposes only and should not be considered financial advice. Investors should conduct their own research and consult with financial professionals before making investment decisions. Options trading carries significant risk, including the potential for substantial or unlimited losses. Past performance does not guarantee future results, and the specific IVX, premium, and return figures cited reflect live platform data at the time of recording rather than current market conditions.