
There is a calculation making the rounds online right now, and it is persuasive enough to be changing how real families make real decisions. Take a $50,000 second income, strip out the taxes, the childcare, the commute, and the money you spend to make an exhausting double-income life bearable, and what you are left with is roughly $2,000 a year. About $1 an hour. Why bother working at all?
The formula circulates widely, and it looks rigorous. That appearance of rigour is exactly what makes it dangerous, because families are using a flawed shortcut to make a decision that plays out over decades. The problem is not that working parents should ignore their costs. The problem sits in two specific errors: a tax figure that is overstated by nearly $6,000, and a federal tax credit the formula leaves out entirely.
Here is the corrected math, line by line, built on 2025 IRS brackets and verified national data, plus a replicable structure you can run on your own household’s numbers. By the end you will know why the true figure is more than five times what the viral version claims.
What the viral calculation actually claims
The viral formula is seductive precisely because it shows its working. It does not just assert that a second income is not worth it. It walks you through the subtraction, and each line looks like it came from somewhere real.
Applied to a $50,000 annual second income, here is what the formula strips away:
- Taxes: approximately $18,000
- Childcare: approximately $15,000
- Commuting costs: approximately $8,000
- Convenience spending (takeaways, cleaners, the cost of being too tired to cook): approximately $7,000
- Net result: roughly $2,000 per year, or about $1 per hour
That final number is the whole point. At $1 an hour, staying in the workforce looks close to irrational, and families are genuinely using this figure to decide whether a second earner should step away from paid work.
Three of those five lines deserve respect. Childcare, commuting, and convenience spending are all genuine expenses that working parents actually incur. Nobody is inventing costs here. The critique is about scale and omission, not about pretending these pressures do not exist.
But the formula carries one more hidden assumption worth naming now. It treats the most expensive childcare years, when you have infants and toddlers in full-time care, as a permanent condition rather than a temporary, front-loaded phase.
This is where the formula’s precision becomes its weakness. Every figure is specific enough to feel researched, and that specificity is doing the persuasive work. The trouble is that two of the five lines are materially wrong, and once you correct them the conclusion collapses. Families running this calculation are not starting from a conservative estimate. They are starting from a distorted baseline, and knowing where the specific errors sit is the first step to running an honest version.
When big ASX news breaks, our subscribers know first
Why the tax figure is overstated by nearly $6,000
Start with the biggest error, because it is also the least intuitive. The viral formula assumes roughly $18,000 in taxes on the $50,000 second income. To see why that is too high, you need to understand how your second income is actually taxed.
A second income is not taxed at a flat rate applied to the whole sum. It is taxed based on where it sits within your household’s combined bracket structure, and a large slice of your total income never gets taxed at the federal level at all because of the standard deduction.
Here is the three-step method you can replicate:
- Apply the standard deduction first. For a married couple filing jointly in 2025, the standard deduction is $32,200. This reduces your taxable income before any bracket maths begins.
- Identify where the second income falls. Stack the second income on top of the first to find which marginal bracket it occupies.
- Calculate the incremental tax at that marginal rate, not an assumed effective rate on the full amount.
The 2025 federal brackets for married filing jointly, confirmed by the IRS and the Tax Foundation, are:
- 10% on taxable income from $0 to $23,850
- 12% on taxable income from $23,851 to $96,950
- 22% on taxable income from $96,951 to $206,700
Take a worked example: one partner earns $70,000, the other $50,000, for a combined $120,000. After the $32,200 standard deduction, the 22% bracket would only start biting above $100,800 of taxable income for this household. The entire $50,000 second income falls inside the 12% federal bracket. Federal income tax on that second income works out to $6,000, not the implied figure buried in the viral formula.
The viral formula overstated the tax burden on a $50,000 second income by approximately $5,700.
FICA and state income tax: completing the picture
Federal income tax is only one layer. To get an honest total you add two more.
FICA, which covers Social Security and Medicare, is a flat 7.65% of wages. It is not bracket-based, so it applies straight to the $50,000, producing $3,825. That number does not change with your household’s other income.
State income tax varies by where you live. Using Illinois and its flat 4.95% rate as the worked example, the state tax on the second income comes to $2,475. If you live in a state with no income tax, you drop this line entirely; if your state uses brackets, you substitute your own rate. The point is the method, not the Illinois figure.
Add them together: $6,000 federal plus $3,825 FICA plus $2,475 state equals $12,300. That is roughly one quarter of gross pay, not the one-third-plus the formula assumes. For this household, the viral version invents nearly $5,700 in phantom tax losses before the calculation even reaches childcare, which means families using it are starting in a hole that does not exist.
Dual-income tax exposure becomes more complex as household earnings grow: frozen surtax thresholds for the Net Investment Income Tax and Additional Medicare Tax can pull combined incomes of $200,000-$250,000 into territory most couples never anticipated, a structural feature of the US tax code that rewards households who model their combined bracket position rather than each income in isolation.
The two corrections the viral formula skips entirely
Overstating tax is one kind of error. Leaving things out is another, and the formula does both. There are two items it ignores completely, and each one lifts the true value of your second income in a separate step.
The first is the federal child and dependent care tax credit. This is not a deduction that shrinks your taxable income. It is a credit, meaning it comes straight off the tax you owe, dollar for dollar. At the example household’s income level, the credit reimburses 35% of the first $3,000 in qualifying childcare expenses, a direct $1,050 reduction in tax owed.
The IRS credits and deductions for individuals page confirms the 2025 standard deduction, the Child and Dependent Care Credit rate, and the qualifying expense limits that determine how much of your childcare costs are offset dollar for dollar against your federal tax bill.
The childcare figure itself also needs correcting. Child Care Aware of America puts the 2025 national average annual childcare cost at $13,184, not the $15,000 the formula uses. Apply the $1,050 credit to the corrected cost and your net childcare expense drops to $12,134.
Now rebuild the whole calculation with honest inputs. Here is every line, side by side.
| Line item | Viral figure | Corrected figure | Source |
|---|---|---|---|
| Taxes on $50,000 second income | ~$18,000 | $12,300 | IRS brackets; FICA; Illinois flat rate |
| Childcare (gross) | $15,000 | $13,184 | Child Care Aware of America (2025) |
| Childcare tax credit | Not applied | -$1,050 | Federal child and dependent care credit |
| Net childcare cost | $15,000 | $12,134 | Calculated |
| Commuting costs | $8,000 | $8,000 | Unchanged |
| Convenience spending | $7,000 | $7,000 | Unchanged |
| Net annual value of second income | ~$2,000 (~$1/hr) | $10,566 (~$5.28/hr) | Corrected calculation |
| Employer retirement match | Not included | $1,500 | Vanguard How America Saves |
| Total value including match | ~$2,000 | $12,066 | Corrected + match |
With corrected taxes of $12,300, net childcare of $12,134, commuting at $8,000, and convenience spending at $7,000, total costs come to $39,434. Subtracted from $50,000, that leaves a net annual value of $10,566, or about $5.28 an hour.
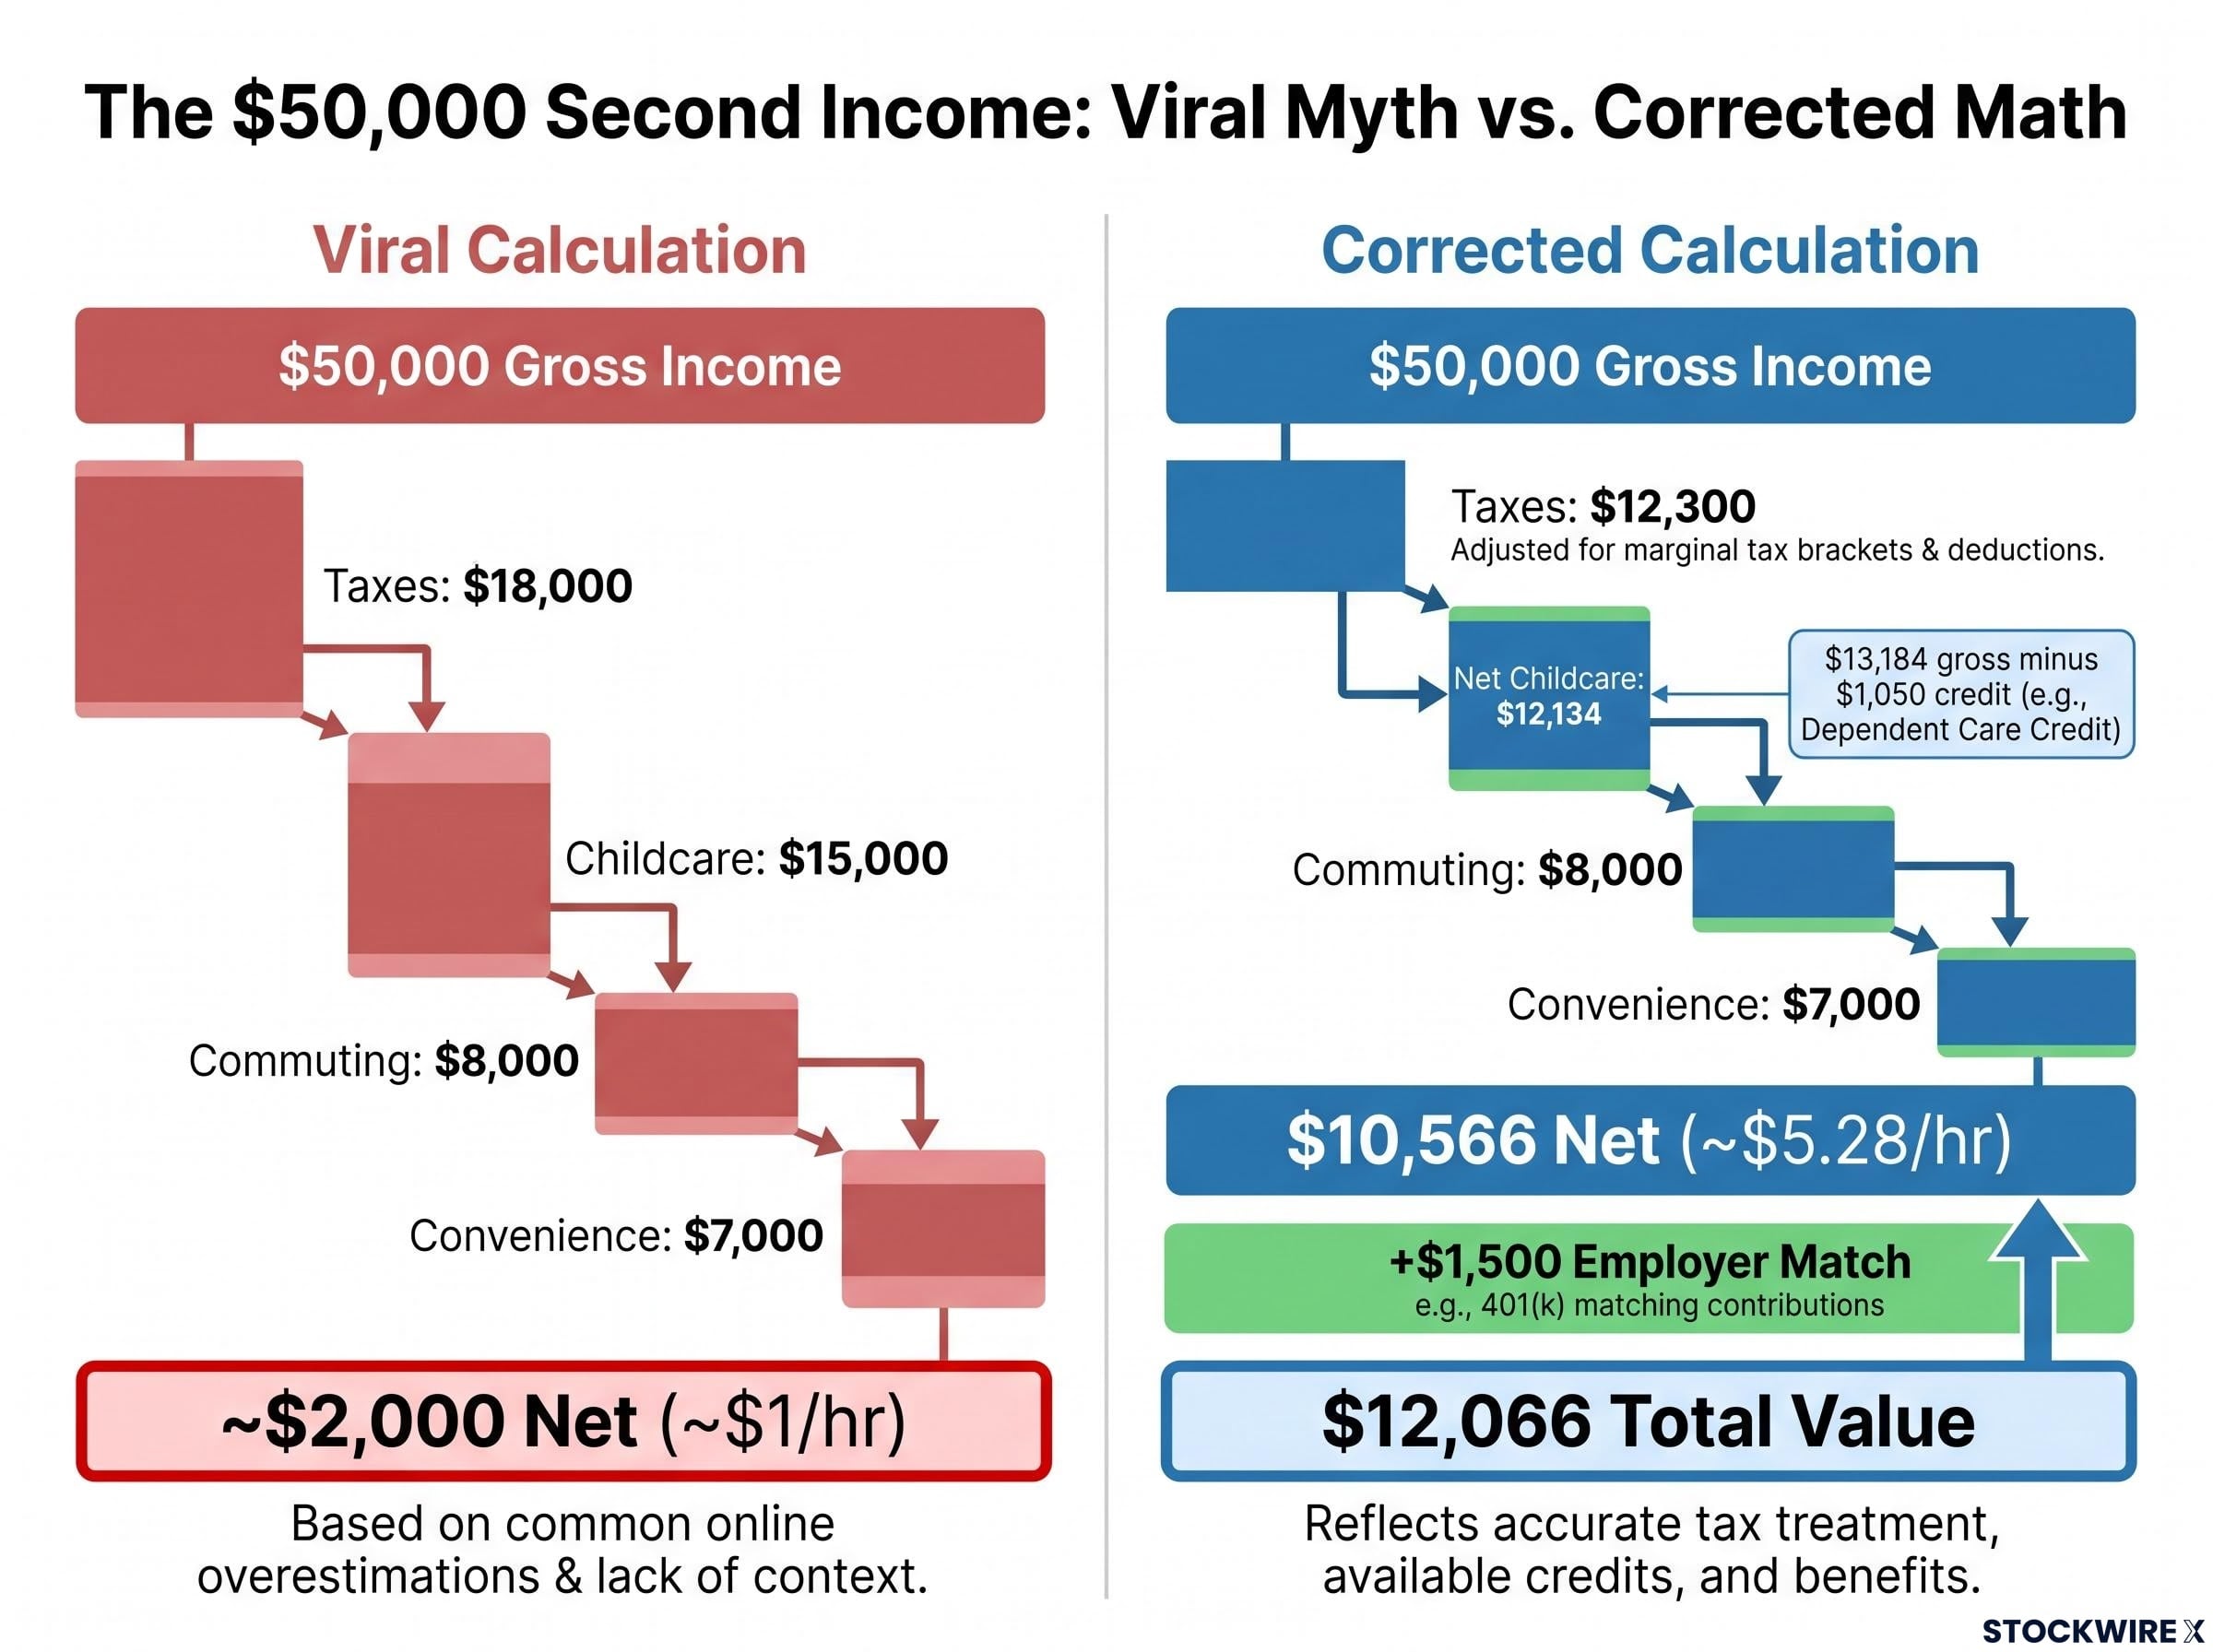
The corrected net value of the second income is more than five times what the viral formula produces.
The second omission is the employer retirement match, which vanishes permanently the day the second earner quits. According to Vanguard’s How America Saves, the most common match structure pays 50 cents for every dollar you contribute, up to 6% of salary. On $50,000, that is $1,500 a year in employer money, lifting the total value to $12,066.
The employer retirement match is one of the few places in personal finance where the return is both immediate and guaranteed: capturing it before any broader investing decision is the correct sequencing priority, and forfeiting it by leaving the workforce is one of the costliest single moves a household can make.
None of this makes the second income life-changing in the moment. What it means for you is that the real starting figure is more than five times larger than the formula suggests, which completely changes which trade-offs are genuinely on the table. The credit and the match are standard features of the US tax code and most benefit packages. Leaving them out is not caution. It is a structural error.
What the calculation looks like across a working lifetime
Even the corrected figure of $12,066 can look thin in a single year. But that is the trap. The year you run this calculation, deep in nappies and full-time care, is the single most expensive year of the entire arc, and it is the worst possible basis for a permanent decision.
Childcare is a front-loaded, temporary expense concentrated in the pre-school years, ages roughly 0 to 5. Child Care Aware of America notes it consumes around 10% of median income for two-parent households during that window, then drops sharply once children enter public school and need only before-and-after-school or holiday care. If you are pricing your second income right now, you are pricing it at its most expensive possible moment.
That said, the corrected maths does not force a single answer. Pausing paid work can still be the rational choice in specific situations:
- Your gross second income is modest relative to local childcare market rates
- You have two or more young children in care simultaneously, multiplying the cost
- The second job offers no benefits, no growth, and little stability
These are genuine exceptions, not afterthoughts. The article is correcting a formula, not prescribing your decision.
Why Social Security accrual belongs in the calculation
There is a long-run cost the formula never counts. The Social Security Administration calculates your retirement benefit on your 35 highest-earning years.
Years with zero or low earnings do not simply get skipped. They are averaged in, pulling the eventual benefit down. Each earner builds their own independent record, so time out of the workforce leaves permanent gaps in it.
Labour economist Claudia Goldin’s Nobel-recognised research reinforces the point: time out of paid work tends to reduce long-run earnings and promotion prospects, particularly for women. Financial planners therefore suggest valuing a second income over a 20 to 30-year horizon, not the 3 to 7 years of intensive care. For a household in peak childcare years, the calculation often swings substantially in your favour within just a few years, once the children start school.
The 401(k) crossover point, the year investment returns first exceed your annual contributions, typically arrives around a balance of $175,000-$350,000, which means the compounding trajectory you preserve by staying in the workforce through the childcare years carries value well beyond the net figure visible in any single-year calculation.
Building your own corrected second-income calculation
The worked example used Illinois rates and a specific family structure. Yours will differ, so here is the framework to run your own numbers today.
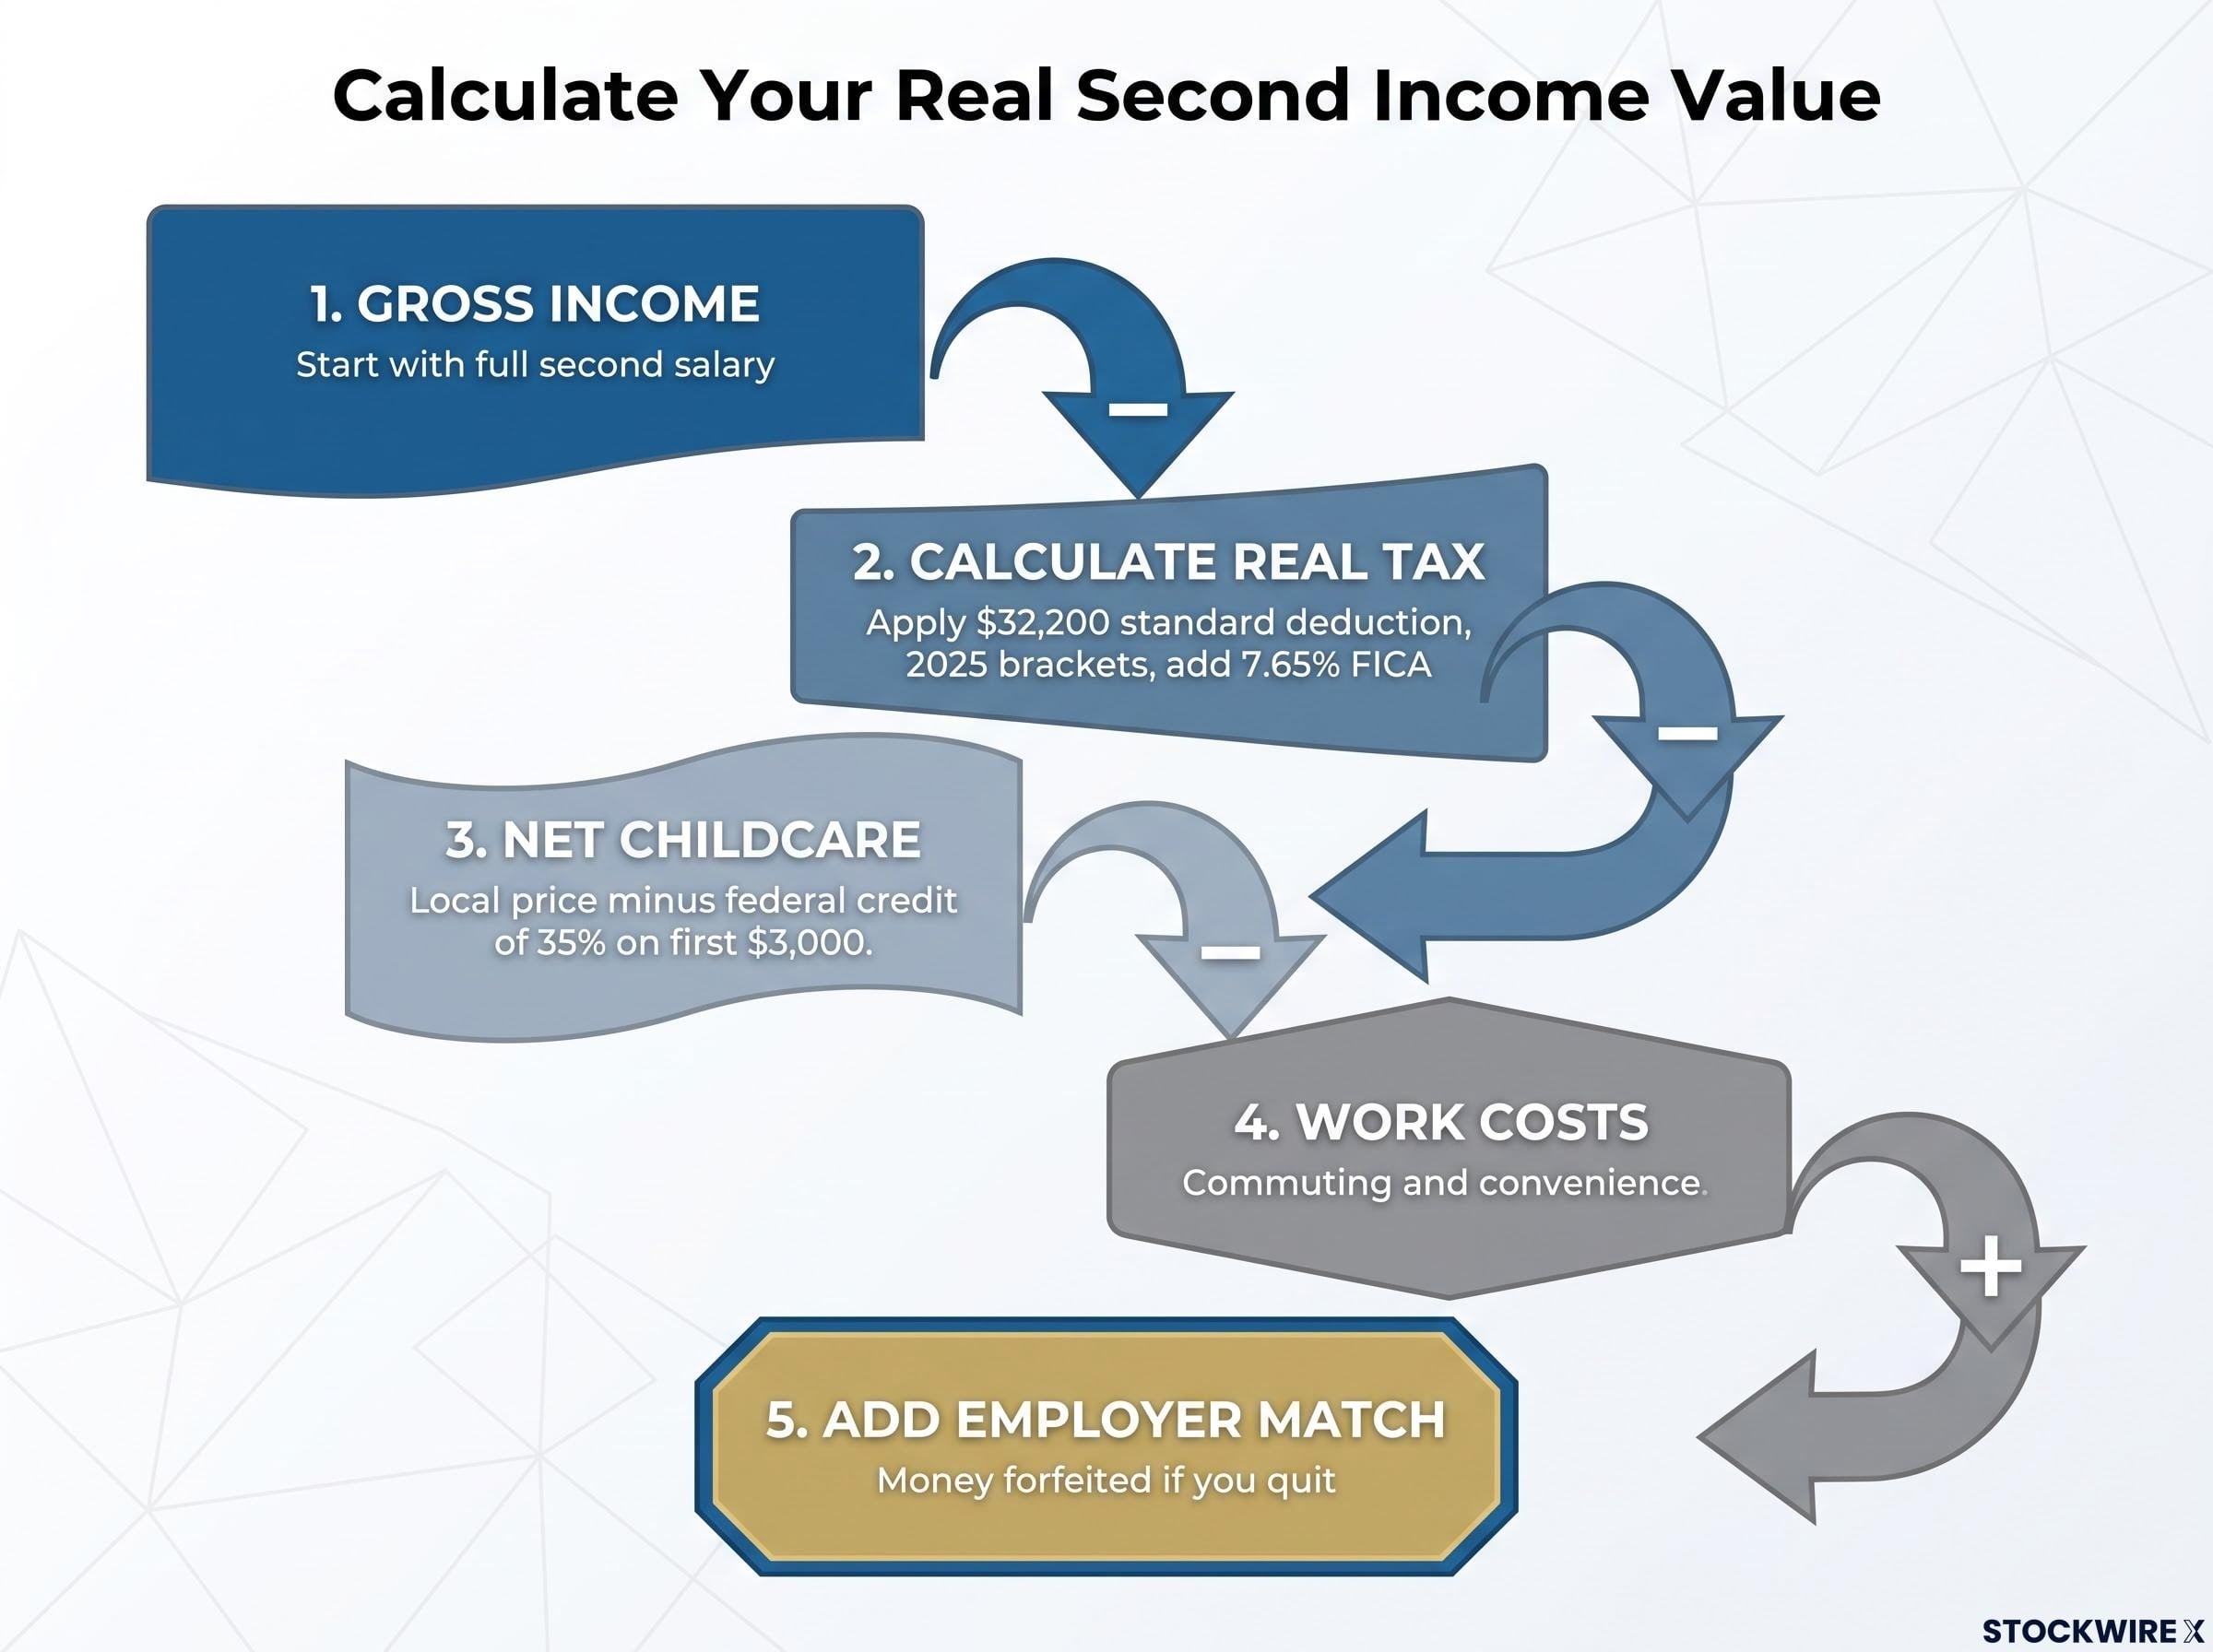
- Start with gross second income. The full salary before anything comes out.
- Subtract incremental federal and state tax at your actual marginal rate. Apply the $32,200 standard deduction first, find where the income sits in the 2025 brackets, then add FICA at 7.65% and your state rate.
- Subtract net childcare. Use your local market price, not a national average, then reduce it by the federal credit (35% of the first $3,000 of qualifying expenses at this income level).
- Subtract genuine incremental work costs. Commuting, work meals, outsourcing you only pay for because both of you work.
- Add the employer retirement match. Money you forfeit entirely if you quit.
Use national figures where they genuinely apply: the federal brackets, the 7.65% FICA rate, and the credit rate. Substitute your own numbers where local conditions rule: your state income tax rate and your actual childcare market price. The example anchors ($12,300 taxes, $12,134 net childcare, $8,000 commuting, $7,000 convenience spending, $1,500 match) are reference points, not your answer.
The real value of running this once is not the final figure. It is that you stop treating a viral shortcut, built for a different income and a different family, as a substitute for analysing your own household’s data.
The question is not what the second income nets this year. It is what two established careers build over twenty years.
The corrected numbers change the decision, not just the math
Run the honest version and the $50,000 second income nets $10,566 after all corrected costs, rising to $12,066 once you count the employer retirement match. That is a long way from the $2,000 the viral formula produces.
Three corrections get you there: a tax figure overstated by roughly $5,700, an omitted $1,050 childcare credit, and a $1,500 employer match that disappears the moment the second earner walks away. Each one is standard, verifiable, and left out of the viral version.
The formula fails because it feeds in the wrong inputs, not because paid work is always the right answer. A household that runs the corrected framework and still decides a pause makes sense is making a legitimate, informed choice. A household that quits on flawed arithmetic is not. Correct the inputs first, then reach your own conclusion.
For readers wanting to benchmark how effectively your household is converting dual income into lasting wealth, our full explainer on the expected net worth formula shows how two earners on identical income trajectories can produce a 15x net worth difference over ten years through behavioural choices alone.
This article is for informational purposes only and should not be considered financial advice. Investors should conduct their own research and consult with financial professionals before making investment decisions. Tax figures are based on 2025 IRS data and a specific example household; your own situation will differ.