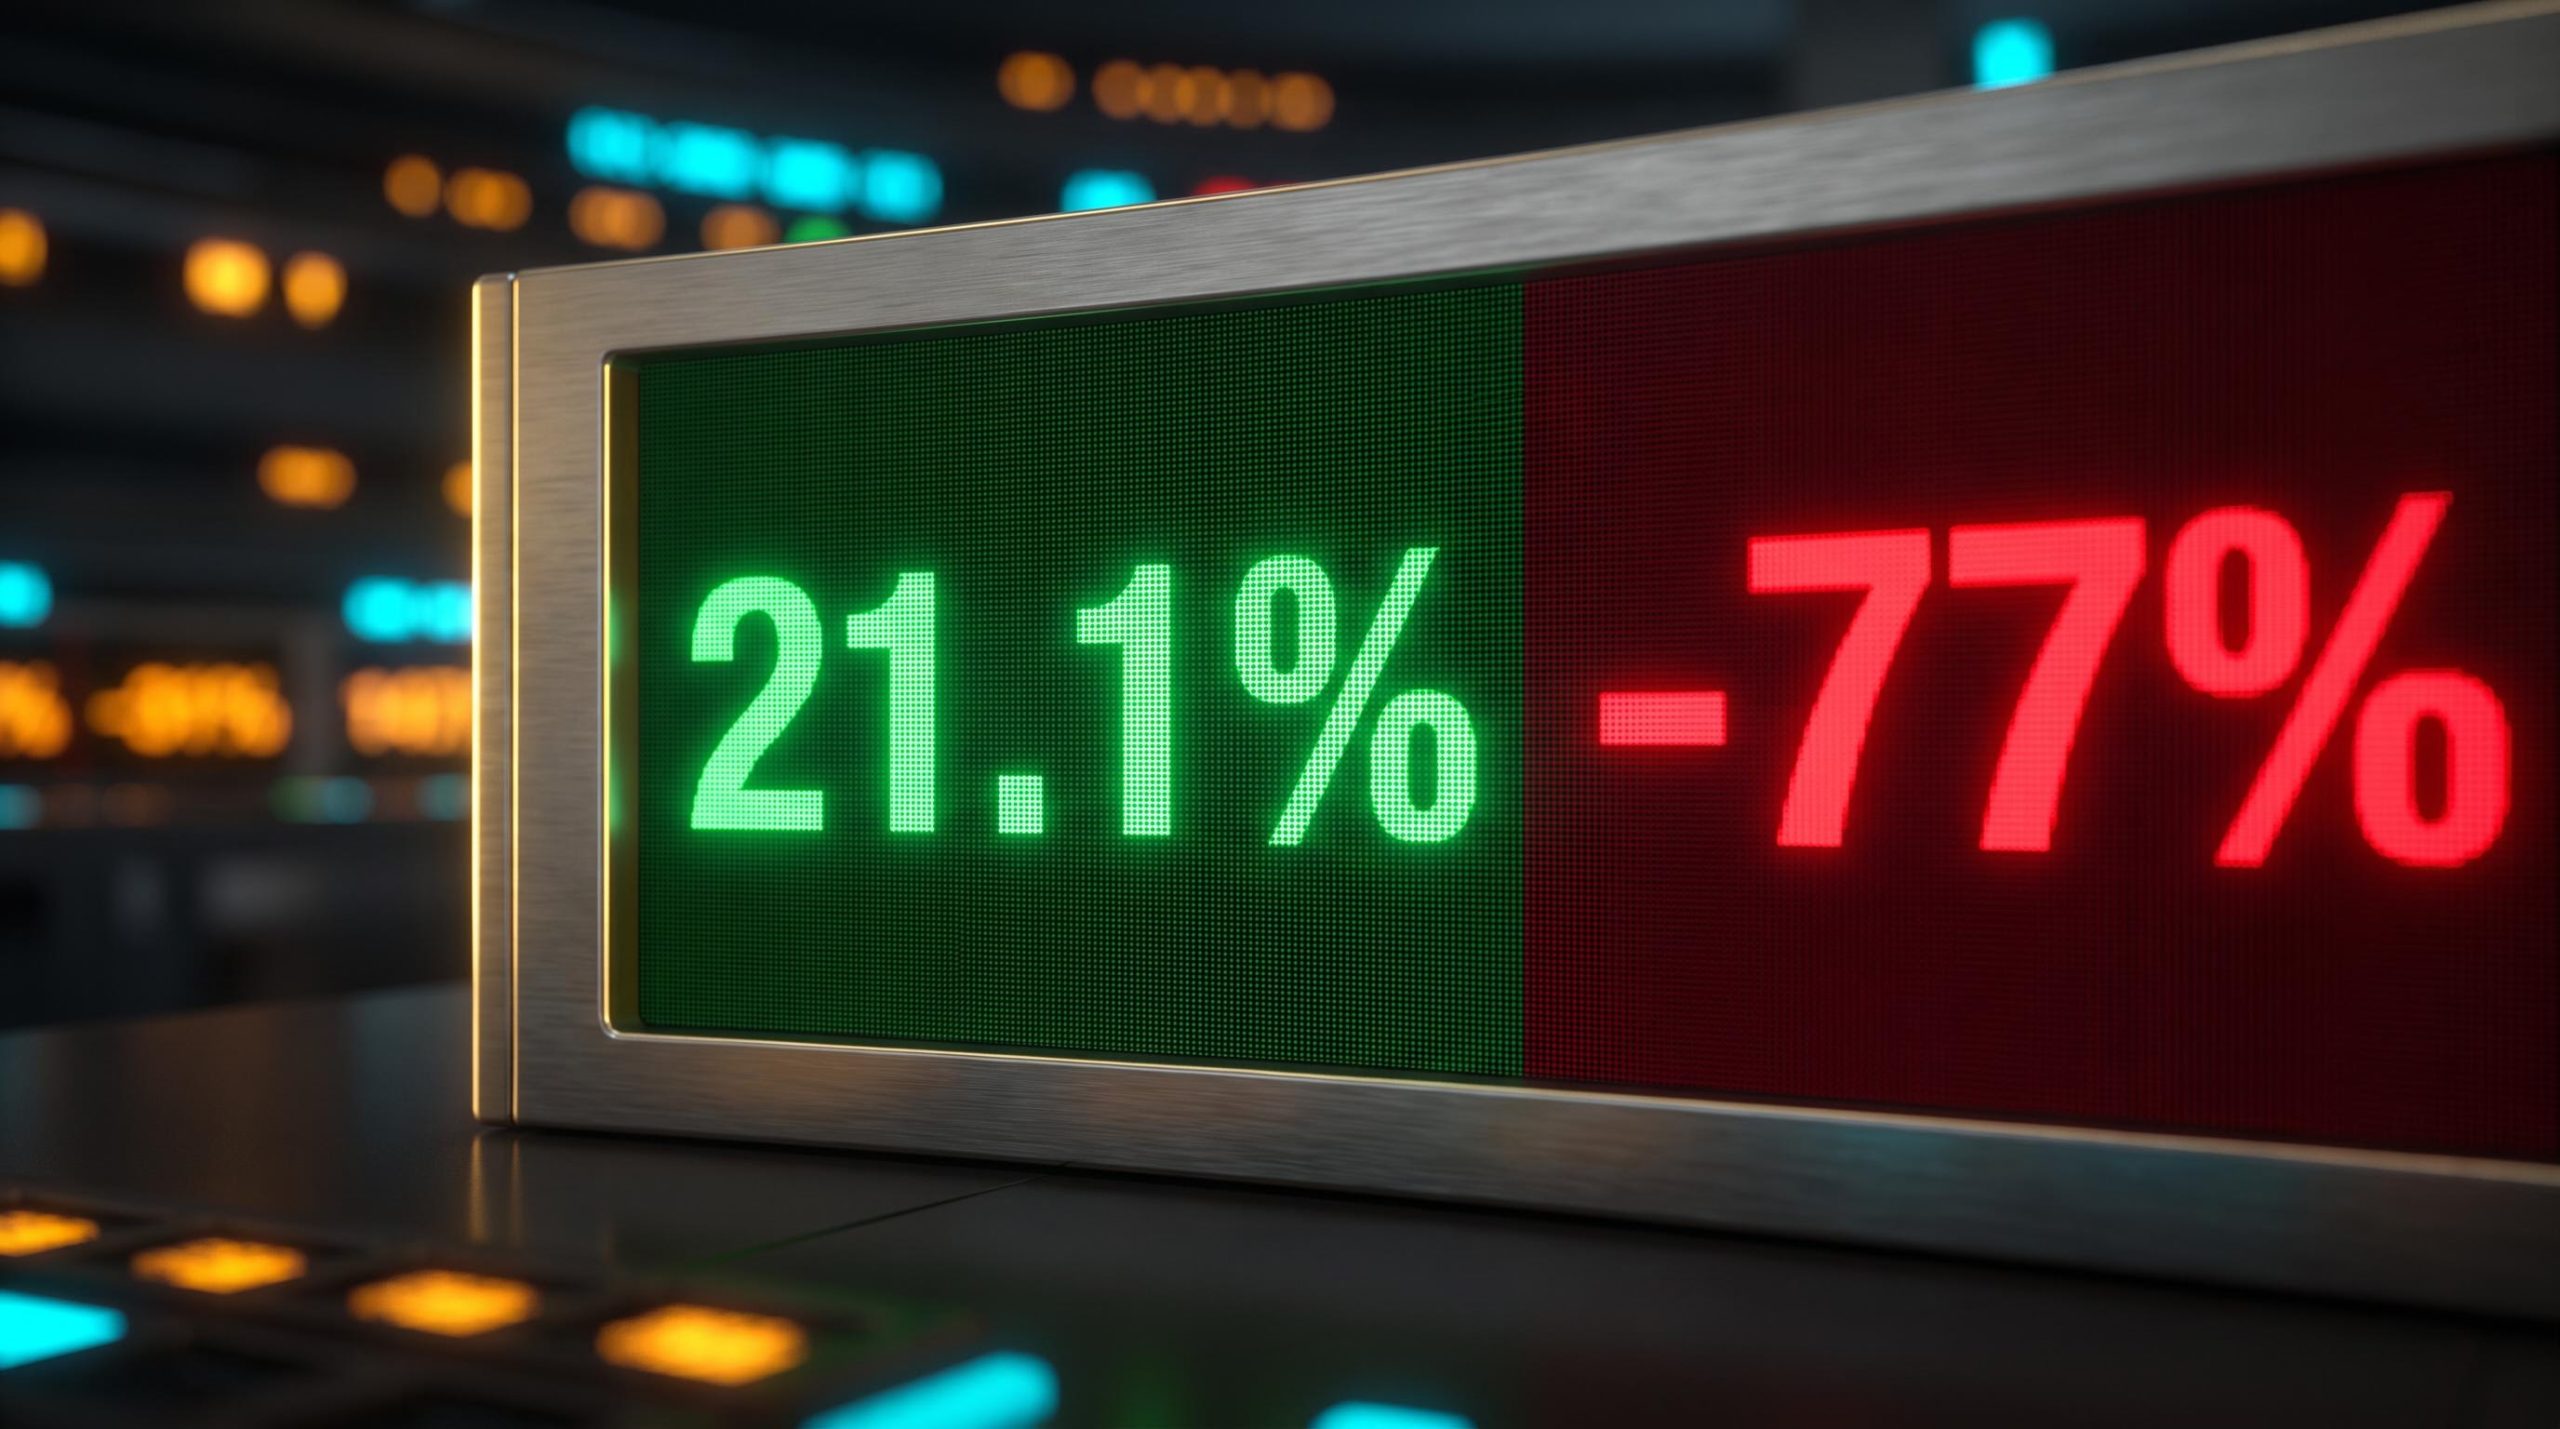
Here is a fund that turned every $100 into roughly $650 over the past decade, compounding at about 21% a year. Here is the same fund losing nearly 77% of its value in a single downturn.
Both of those facts belong to Invesco QQQ Trust, the exchange-traded fund that gives you exposure to the Nasdaq-100, and holding both in your head at once is the entire point of understanding it properly.
QQQ is now a $501.8 billion fund as of early October 2026, and it sits at the centre of nearly every conversation about artificial intelligence and technology investing. It is the most liquid way to buy the Nasdaq-100 in a single trade, which means retail investors run into it constantly, often without fully grasping what it holds or how it behaves when markets turn.
This guide gives you what you actually need before you decide whether QQQ belongs in your portfolio: how it is built, what sits inside it, how it has performed through boom and bust, the honest case for and against it, and the specific investor profiles it fits. By the end, you should have a personal answer, not just a pile of statistics.
How QQQ works and what it actually tracks
Start with the surface description, because most people stop there. QQQ tracks the Nasdaq-100 Index, which holds the 100 largest non-financial companies listed on the Nasdaq exchange, weighted by market capitalisation. Bigger companies get bigger slices of the fund.
The detail that trips people up is the “non-financial” part and the word “Nasdaq.” QQQ is not the Nasdaq Composite, which spans thousands of Nasdaq-listed names. It holds roughly 102-106 stocks and excludes financial services firms entirely.
Here are the core credentials worth scanning before you go deeper:
The Invesco QQQ product page confirms the fund’s expense ratio of 0.18%, its inception date of 10 March 1999, and its 102 holdings, giving you a single authoritative reference point for the core mechanics before you go deeper into the performance record.
- Assets under management: approximately $501.8 billion as of early October 2026
- Expense ratio: 0.18% annually
- Holdings: approximately 102-106 stocks
- Average daily volume: approximately 39.6 million shares (30-day average)
- Launched: 10 March 1999, originally under the ticker QQQQ before changing to QQQ in 2011
How the fund is constructed and maintained
The index rebalances quarterly and reconstitutes once a year, so as companies grow or shrink, their weights adjust and new entrants from the technology and semiconductor space get pulled in over time. That mechanical process is a large part of why the fund looks the way it does today.
Now the constraint that matters most for your decision. Because QQQ can only hold Nasdaq-listed companies, a meaningful chunk of the technology sector trades somewhere it cannot reach. Major technology names listed on the New York Stock Exchange are simply invisible to this fund.
So before you file QQQ under “broad technology exposure,” understand that it is really “large Nasdaq-listed non-financial exposure.” That is a narrower thing, and every performance figure you are about to read sits on top of that structural fact.
When big ASX news breaks, our subscribers know first
What is inside QQQ: sector weights and top holdings
Numbers on a fact sheet rarely land until you see how lopsided they are. QQQ’s sector mix is not balanced in any ordinary sense.
According to the Invesco fact sheet dated 31 August 2026, Information Technology alone accounts for 66.36% of the fund. Here is the full breakdown.
| Sector | Weight |
|---|---|
| Information Technology | 66.36% |
| Consumer Discretionary | 16.65% |
| Telecommunications | 4.72% |
| Healthcare | 4.01% |
| Industrials | 3.22% |
| Consumer Staples | 2.13% |
| Basic Materials | 1.25% |
| Utilities | 1.14% |
| Energy | 0.53% |
Worth noting in the interest of transparency: Morningstar’s 2026 analysis puts technology nearer 60.6%, with communication services adding another 12.2%. The gap comes down to different sector classification methods, not a dispute about the fund. Either way, technology plus communications has exceeded 70% in recent breakdowns.
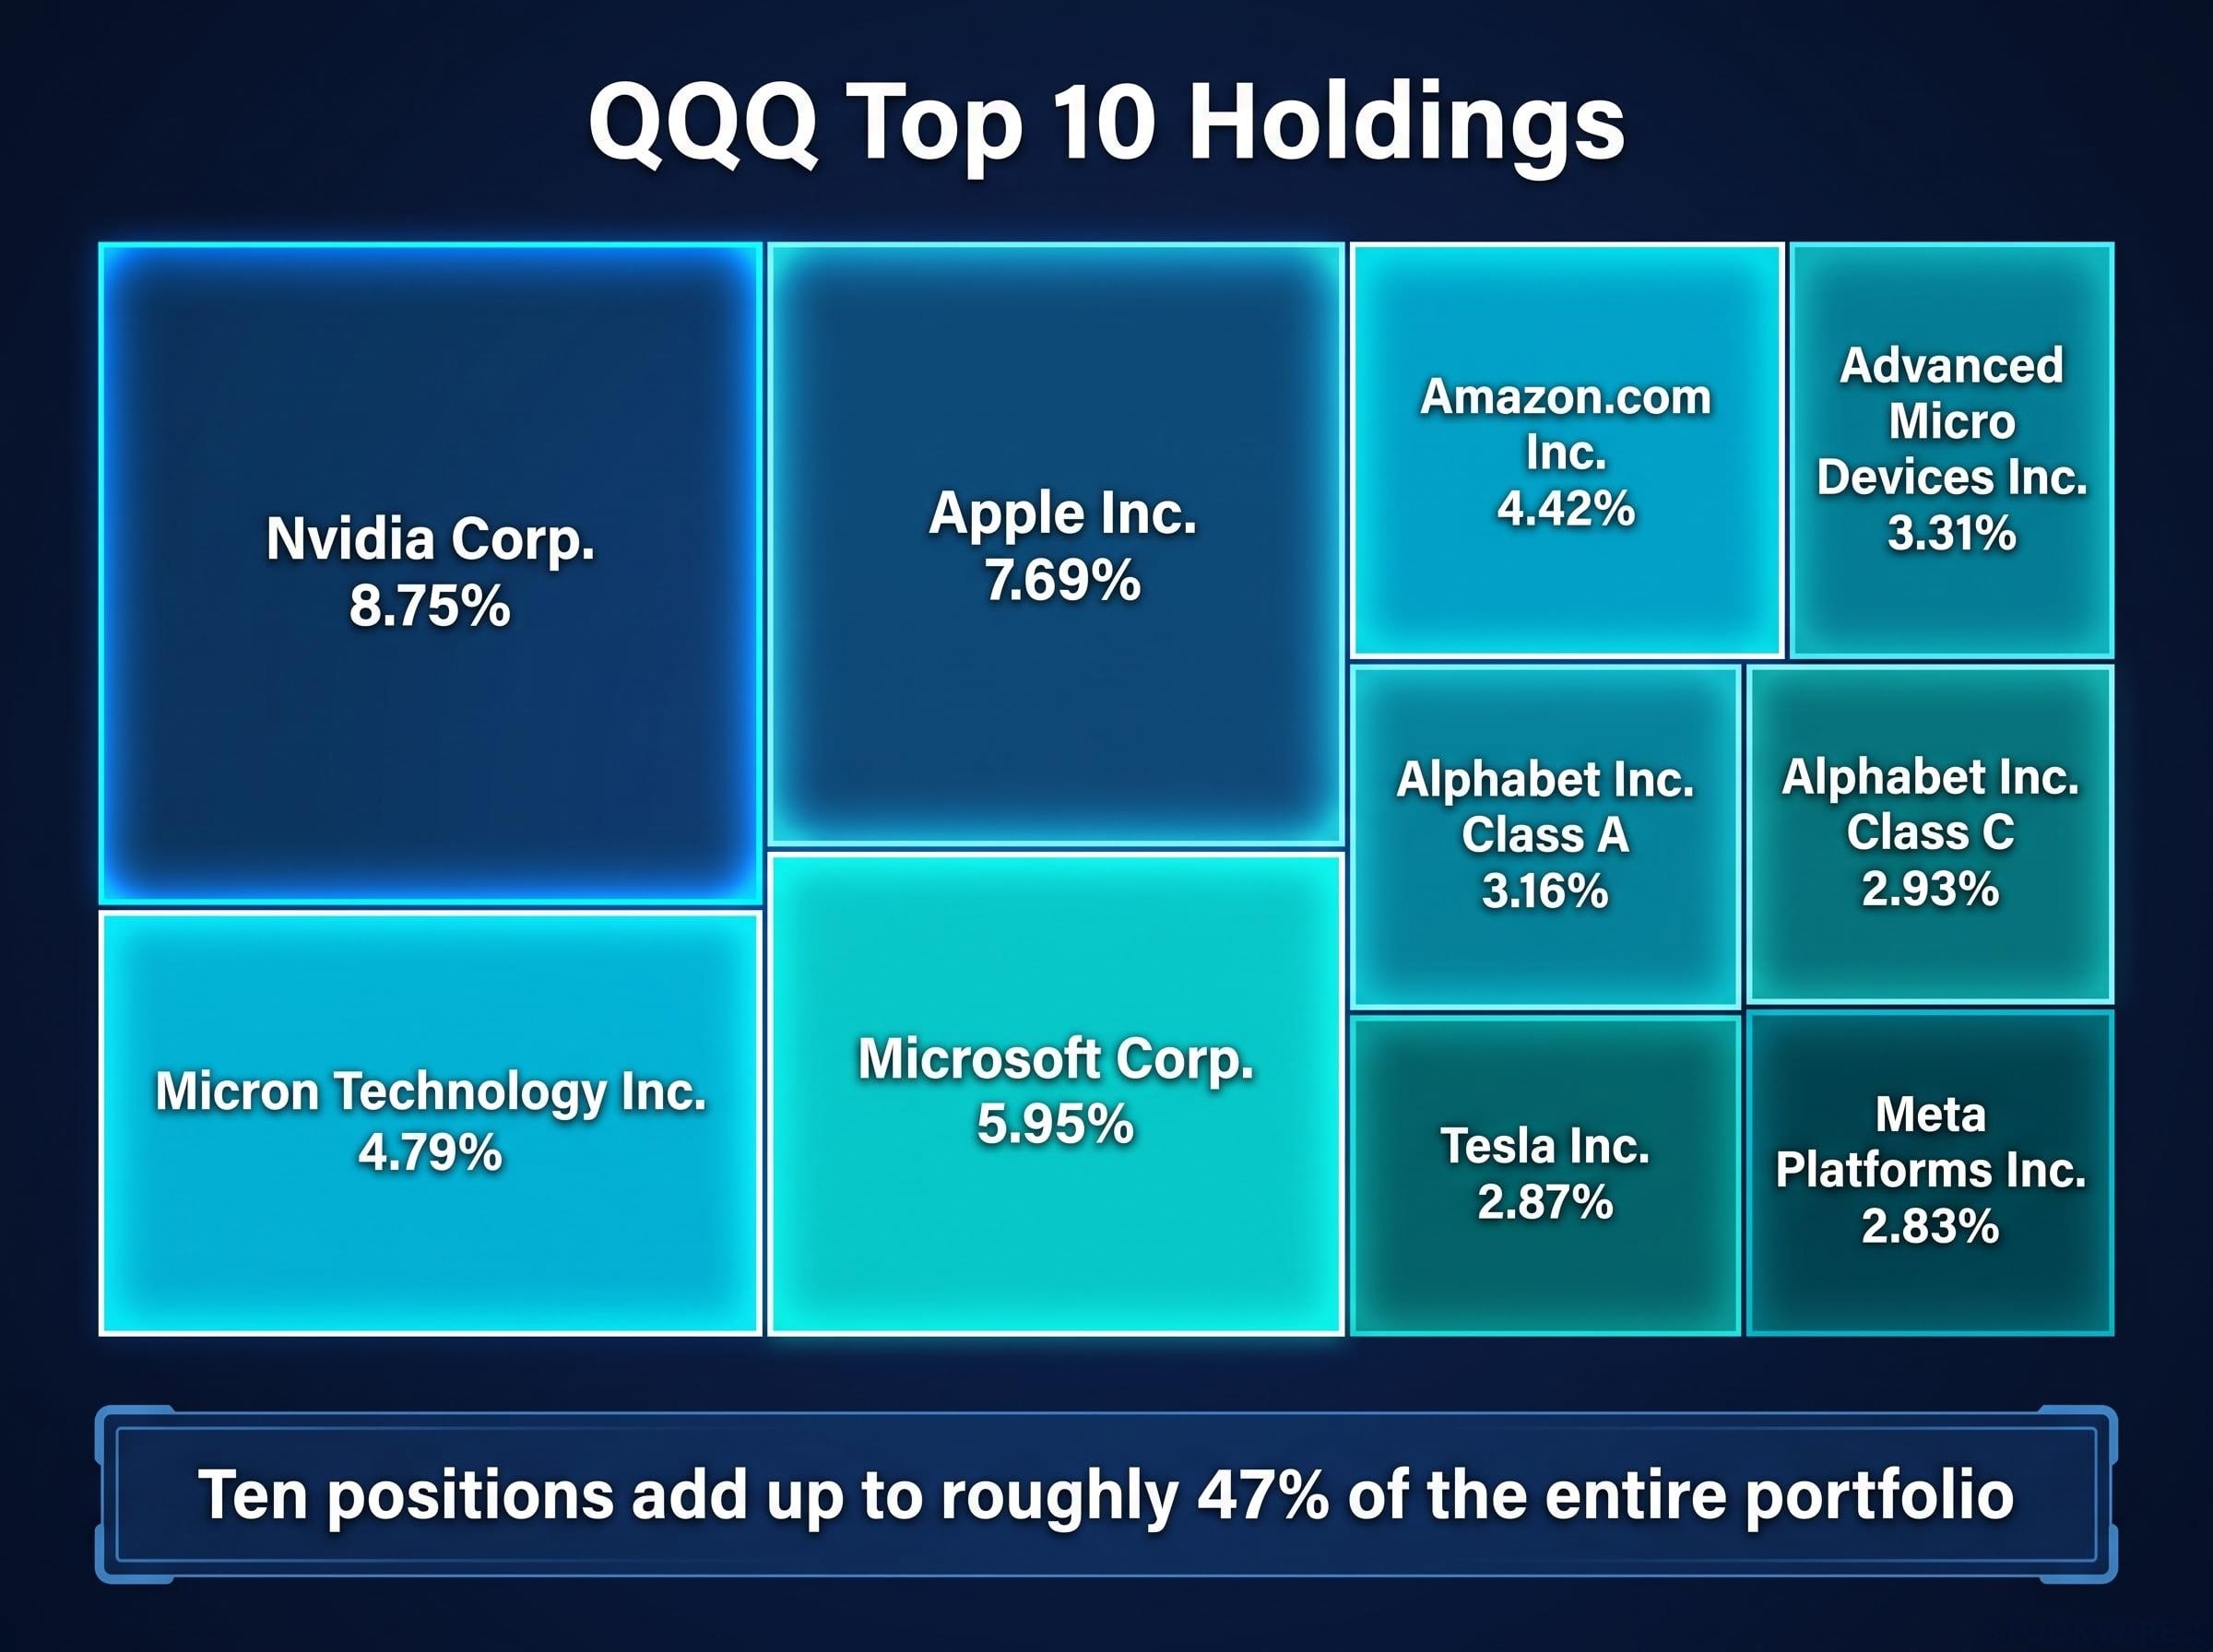
The concentration gets sharper when you look at individual names.
| Company | Weight |
|---|---|
| Nvidia Corp. | 8.75% |
| Apple Inc. | 7.69% |
| Microsoft Corp. | 5.95% |
| Micron Technology Inc. | 4.79% |
| Amazon.com Inc. | 4.42% |
| Advanced Micro Devices Inc. | 3.31% |
| Alphabet Inc. Class A | 3.16% |
| Alphabet Inc. Class C | 2.93% |
| Tesla Inc. | 2.87% |
| Meta Platforms Inc. | 2.83% |
Those ten positions add up to roughly 47% of the entire portfolio, with Nvidia at 8.75% sitting as the single largest holding. Read that again slowly. When you buy “the Nasdaq-100,” almost half your money rides on ten companies, most of them semiconductor and AI-linked.
This is not a recent quirk, either.
According to Morningstar, the ten largest positions in QQQ have represented more than half the portfolio for extended stretches, going back to at least November 2016. The concentration is a built-in feature of the design, not a temporary distortion.
The reason for the AI and chip tilt is mechanical. Market-cap weighting means the biggest winners automatically earn the biggest slices, and the biggest winners of recent years have been Nvidia, AMD and the broader semiconductor group. The index does not pick them deliberately; it simply follows the money, and the money has flowed to chips. That is the single most important fact for how you size this position and manage its risk.
The cap-weighting feedback loop embedded in QQQ’s index methodology is why Nvidia reached an 8.75% single-position weight: market-cap weighting channels each new dollar of passive inflow disproportionately toward stocks that have already appreciated, compounding the concentration rather than correcting it.
QQQ’s performance record: what the numbers show across market cycles
The returns are genuinely impressive, and that is exactly why you have to look at the other half of the record.
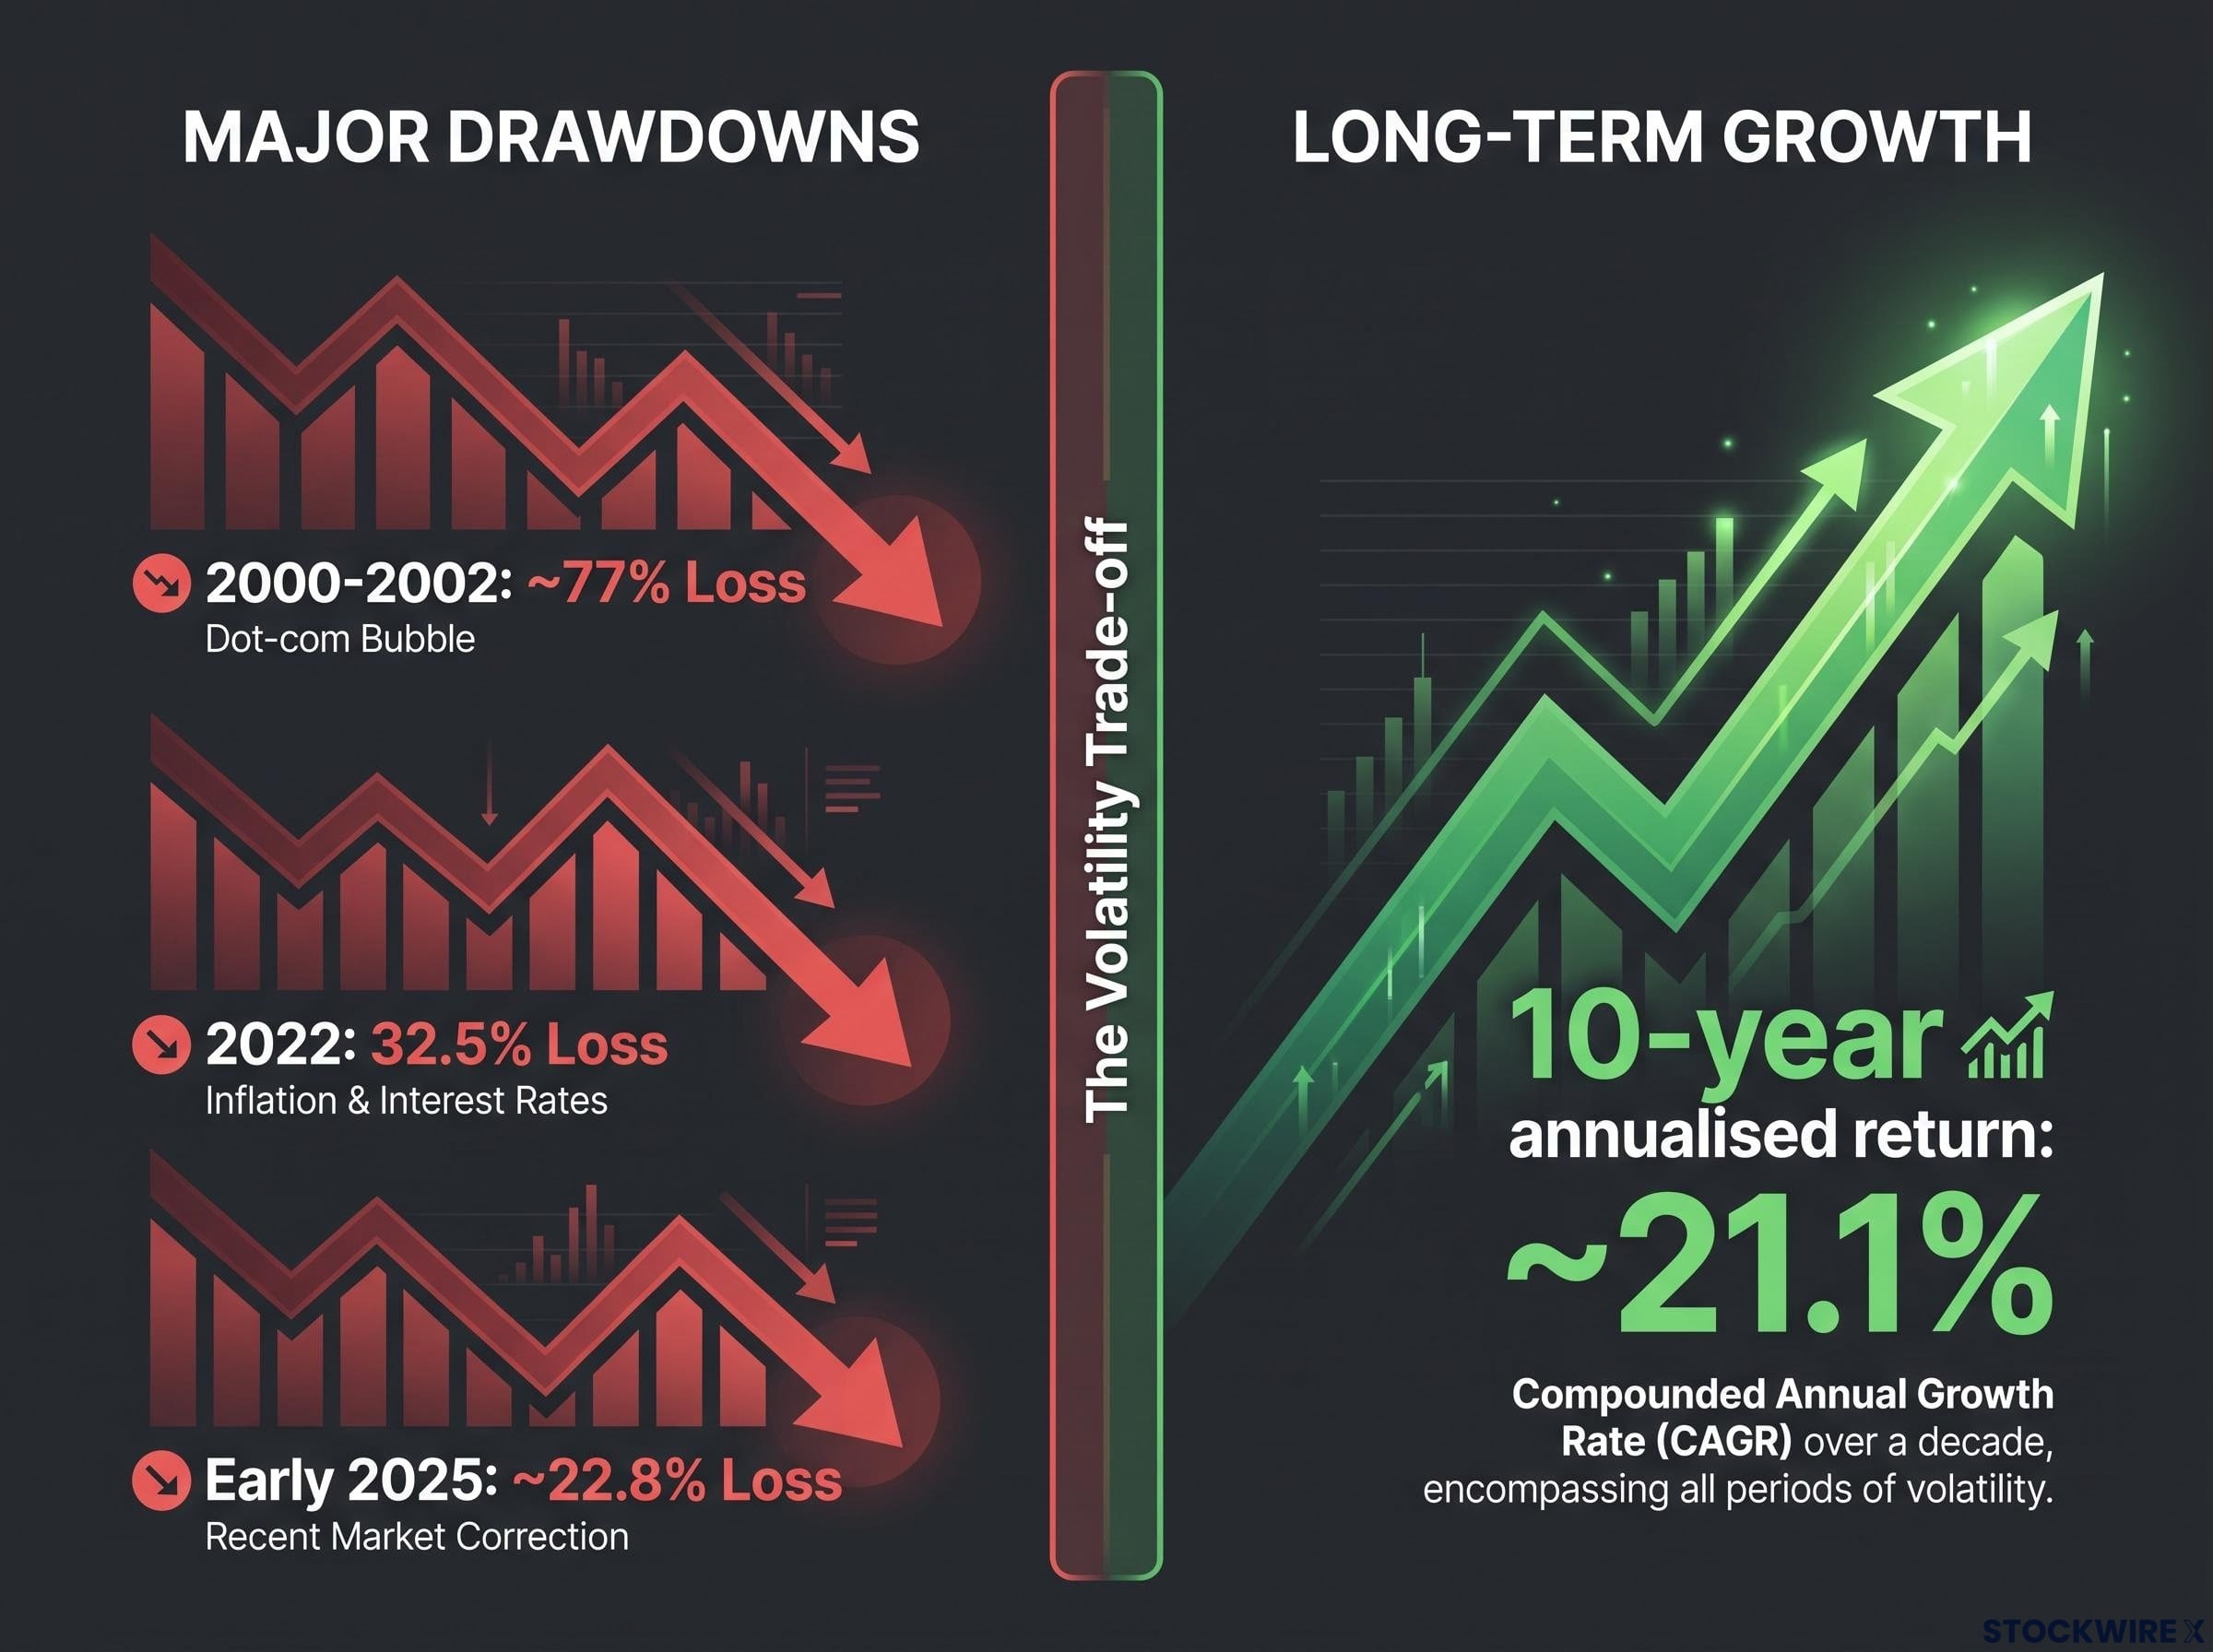
Start with the figures that draw people in. As of early October 2026, QQQ has delivered approximately 24.3% over one year, 28.3% annualised over three years, 16.5% annualised over five years, and 21.1% annualised over ten years. From its March 1999 inception through April 2026, it compounded at roughly 10.5% a year, ahead of both the US large-growth category and the S&P 500 over that full stretch.
Morningstar awards the fund 5 stars on its ten-year quantitative rating among large-cap growth funds as of 30 June 2026. The quantitative record is strong by almost any measure.
Now the other side. The same concentrated structure that powered those gains also produced some brutal declines, and they arrived in three distinct episodes.
- The dot-com crash (2000-2002): QQQ fell by nearly 77%, against roughly 33% for the broad equity market.
- The 2022 tech selloff: QQQ dropped 32.5% while the S&P 500 fell 18.1%, as rising interest rates repriced richly valued growth stocks.
- The early-2025 drawdown: QQQ lost approximately 22.8% versus about 18.6% for the Vanguard S&P 500 ETF (VOO).
| Period | QQQ Loss | Broad Market | Note |
|---|---|---|---|
| 2000-2002 | ~77% | ~33% | Dot-com unwind |
| 2022 | 32.5% | 18.1% (S&P 500) | Rate-driven repricing |
| Early 2025 | ~22.8% | ~18.6% (VOO) | AI-linked volatility |
QQQ lost nearly 77% of its value between 2000 and 2002, compared with approximately 33% for the broad equity market.
The concentration cuts both ways in the short term too. During the DeepSeek-driven selloff in January 2025, QQQ’s chip exposure produced a one-day loss of roughly 3%, about twice the drop in the overall market.
Here is the recovery evidence, because it matters. From 2023 through 2026, QQQ compounded at approximately 27.6% annualised, rebounding hard as technology stocks surged again. Those rebounds are real, but they are only available to investors who stayed invested through the pain.
The Nasdaq 100 volatility profile is often overstated in popular commentary: realized volatility spread versus the S&P 500 has compressed to just 3.1-3.2 percentage points over multi-year horizons since 2008, far narrower than the ‘twice as risky’ framing most investors carry into their position sizing.
So treat the drawdown record as a personal stress test, not a history lesson. If you could not have held through a 77% loss, or a 32% one, without selling at the bottom, then QQQ’s headline return figures are not actually available to you.
The case for QQQ and the case against it
This is where you weigh two genuinely competing arguments. Both are backed by the same data, and the structural tension between them is the whole decision.
The case for QQQ
- Documented long-term returns. A 21.1% ten-year annualised return places QQQ ahead of most large-cap growth strategies.
- Direct exposure to AI and technology innovation. Invesco positions the fund around themes such as cloud computing, semiconductors, electric vehicles and mobile payments, many of which investors expect to drive future growth.
- A low cost. At 0.18% annually, the expense ratio is modest for a fund of this profile.
- Deep liquidity. Roughly 39.6 million shares change hands daily, keeping pricing tight and entry or exit easy.
- A long track record. QQQ has operated since March 1999, across multiple full market cycles.
The case against QQQ
- A Neutral rating from Morningstar. Despite strong returns, Morningstar’s qualitative Medalist Rating sits at Neutral, citing sector concentration and index construction flaws.
- Higher volatility. Over two decades, QQQ has been roughly 23% more volatile than VOO, with deeper drawdowns.
- Limited diversification value. QQQ carries a correlation of about 0.88 with VOO, which constrains the benefit of holding both.
- A narrow sector base. With around 60-66% in technology versus roughly 30% for VOO, returns depend heavily on a small group of names.
That technology weighting gap, QQQ’s 60-66% against VOO’s 30%, explains both the return premium and the drawdown premium. You cannot buy one without the other.
The S&P 500 and Nasdaq 100 divergence that emerged through mid-2026 illustrated this concentration effect sharply: the Philadelphia Semiconductor Index fell 20.6% in a single month, yet the equal-weighted S&P 500 outperformed QQQ by 7.6 percentage points over that stretch because the sell-off was rotation-driven rather than a broad equity collapse.
| Metric | QQQ | VOO |
|---|---|---|
| Expense ratio | 0.18% | N/A |
| Technology weight | ~60-66% | ~30% |
| 10-year annualised return | ~21.1% | Lower |
| Volatility | ~23% higher | Baseline |
| Correlation with QQQ | 1.00 | ~0.88 |
The single most practical figure in that table is the 0.88 correlation. If you already own a broad US equity index fund, adding QQQ gives you far less genuine diversification than the separate ticker suggests. You would mostly be layering more of the same mega-cap technology names on top of what you already hold, so weigh that carefully before treating QQQ as a complement rather than an overlap.
Who should consider QQQ and how it typically fits into a portfolio
Enough theory. The useful question is whether you can locate yourself in the trade-offs above, so here are the profiles.
Investor profiles for whom QQQ may be suitable
- You have a long enough time horizon to sit through deep drawdowns, the kind that reached 77% in the dot-com crash and 32.5% in 2022, without selling.
- You specifically want technology and AI exposure above what a broad-market fund provides, as a deliberate choice rather than an accident.
- You understand this is a concentrated growth position, not a diversified core holding, and you are comfortable with the single-sector risk that comes with it.
Investor profiles for whom QQQ may not be the right fit
- You are risk-averse and value a smoother ride over maximum upside.
- You are near or in retirement, where a 30-70% drawdown could force selling at the worst possible time.
- You already hold a broad US equity index fund and are looking for real diversification, not an amplified bet on the same technology giants you own through that 0.88 correlation.
Across its coverage, Morningstar frames QQQ as a tactical or satellite position: a deliberate tilt inside a diversified portfolio for investors who want extra technology and AI exposure, rather than a substitute for a broad index fund. For those who have decided it fits, the 0.18% expense ratio is a genuine point in its favour.
So the honest question to leave with is not “is QQQ good?” It is this: do you want deliberate, concentrated technology exposure above what a broad index gives you, and can you hold through a 30-70% drawdown without selling? Answer those two honestly and your fit becomes clear.
Making an informed call on QQQ in a technology-driven market
The tension this guide has traced is not a contradiction to resolve. QQQ’s long-term return premium is real and documented, and so is its concentration risk and the severity of its drawdowns. They are two sides of the same structural fact: a market-cap-weighted, Nasdaq-only index that doubles down on its biggest winners.
For most investors, the satellite-not-core framing fits best. That said, some of you have the time horizon and risk tolerance to carry QQQ as a larger position, and pretending otherwise would not be honest.
Technology and AI remain the dominant forces shaping the Nasdaq-100’s composition, which means QQQ’s risk-return profile is unlikely to soften any time soon. You now have the full picture: the mechanics, the holdings, the performance record in both directions, and the profiles it suits. The decision is yours to make.
For investors who have decided QQQ fits as a satellite position and want to build out the rest of the AI sleeve deliberately, our comprehensive walkthrough of layered AI ETF construction covers a four-tier allocation framework with concrete sizing logic and overlap management guidance across mega-cap platforms, infrastructure enablers, and mid-cap innovators.
This article is for informational purposes only and should not be considered financial advice. Investors should conduct their own research and consult with financial professionals before making investment decisions. Past performance does not guarantee future results, and financial projections are subject to market conditions and various risk factors.