
The RBA meets on 10-11 August 2026, with the decision landing on 11 August, one day before Commonwealth Bank posts its full-year result. That timing is not a coincidence worth ignoring. The central bank’s read on inflation, household stress, and the rate outlook will set the interpretive frame for every bank CEO who steps up to a microphone over the following fortnight.
This is not a season where beating consensus by a percent or two will move share prices. Broker previews from Macquarie and UBS are clear: the headline profit figures have already been absorbed by the market. What remains uncertain is forward guidance on net interest margins (NIMs), the amount of money a bank earns on the difference between what it charges borrowers and what it pays depositors; management’s tone on arrears; and whether bad-debt charges are rising steadily or accelerating.
Here is a bank-by-bank map of what to watch across the August 2026 reporting season, why each variable matters, and how to read the cumulative picture as it unfolds. The goal is not to summarise what is expected. It is to give you a decision-making filter: what would change your view on each name, and in which direction.
Why this reporting season is different from those that came before
Six ASX-listed banks report across a compressed two-week window beginning 10 August, and the sequencing matters more than usual. CBA is the only major delivering a full-year result this month; its financial year ends 30 June. Westpac, ANZ, and NAB all have 30 September year-ends, which means their August appearances are third-quarter trading updates rather than full accounts. Judo Bank and Bendigo and Adelaide Bank round out the calendar with their own full-year results.
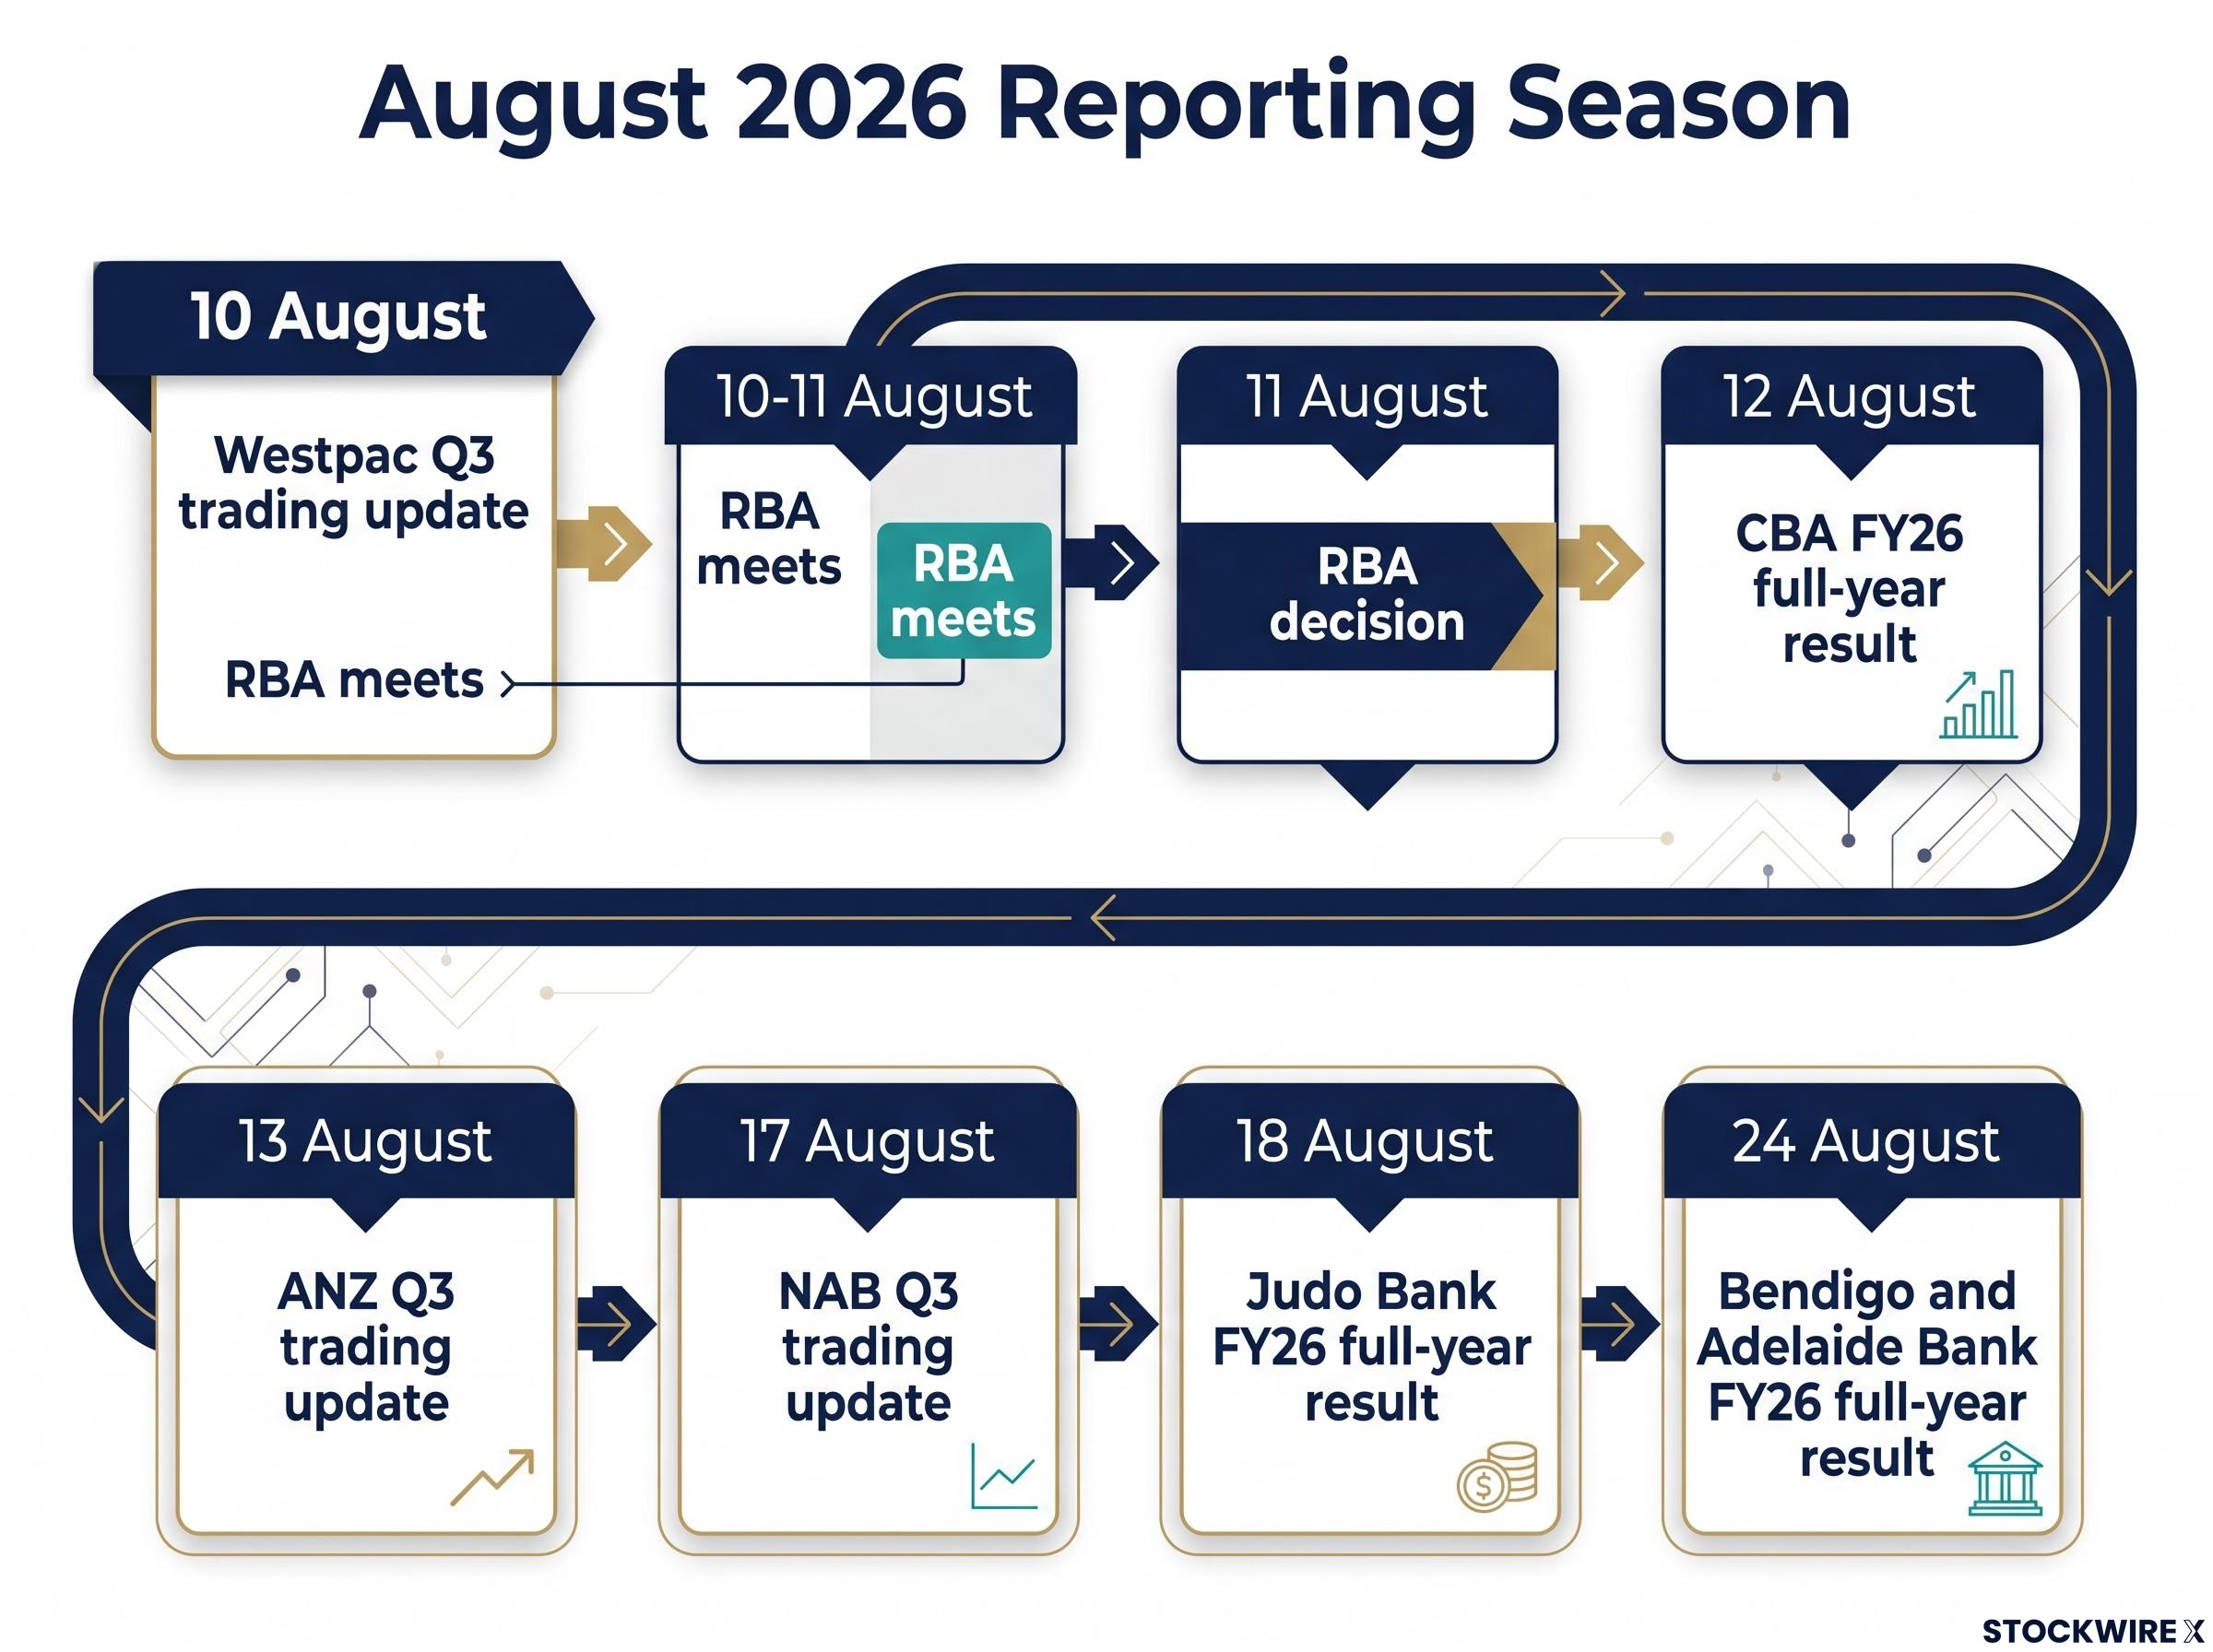
| Bank | Event type | Date |
|---|---|---|
| Westpac | Q3 trading update | 10 August |
| CBA | FY26 full-year result | 12 August |
| ANZ | Q3 trading update | 13 August |
| NAB | Q3 trading update | 17 August |
| Judo Bank | FY26 full-year result | 18 August |
| Bendigo and Adelaide Bank | FY26 full-year result | 24 August |
The RBA sets the lens
The RBA decision on 11 August drops the day before CBA reports. If the central bank sounds more concerned about household stress or flags rising arrears, every bank CEO’s commentary on margins and credit quality will be interrogated through that lens. The compressed calendar then means each result changes the interpretive frame for the next. Investors who track only their own holdings risk reading each print in isolation, which is the wrong context entirely.
The July 2026 rally of 5-8% across the Big Four was characterised by analysts as tactical repositioning on RBA rate-peak expectations rather than a fundamental re-rating, which means the August earnings season must now validate or undercut the premium that capital rotation built into current share prices.
When big ASX news breaks, our subscribers know first
What actually moves bank share prices in August
Sector-wide, most broker models assume results will land within 1-2% of consensus. Macquarie’s 28 July note projected CBA and Bendigo to come in approximately 1-2% above consensus. That kind of margin does not, on its own, drive meaningful share price movement.
The three variables that historically drive post-result moves are:
- Net interest margin guidance. NIM tells you how much a bank earns on the spread between lending rates and deposit costs. CBA’s 1H26 NIM of 2.04% was the highest among the majors. If deposit competition has eroded that lead, the market will recalibrate FY27 earnings expectations regardless of whether the FY26 profit print was strong.
- Bad-debt trajectory. Rising provisions signal management sees more risk ahead, even if actual losses have not fully materialised. The direction and pace of the build matter more than the absolute number.
- Loan-book growth direction. Flat or shrinking mortgage balances tell a different story than solid growth. For business lenders, whether SMEs are drawing down or deleveraging is a macro signal that extends well beyond any single bank.
UBS has argued that bank earnings growth will lag the broader ASX 200 and has recommended investors rotate toward miners, partly on valuation grounds and partly on margin headwinds. Macquarie retained an underweight stance on the sector as a whole, identifying ANZ and NAB as its top picks within the group.
If NIM guidance disappoints even when cash profit beats, the share price reaction is likely to be negative. That means investors who anchor on the headline profit number are measuring the wrong thing.
How to read a bank result: a practical guide to the numbers that matter
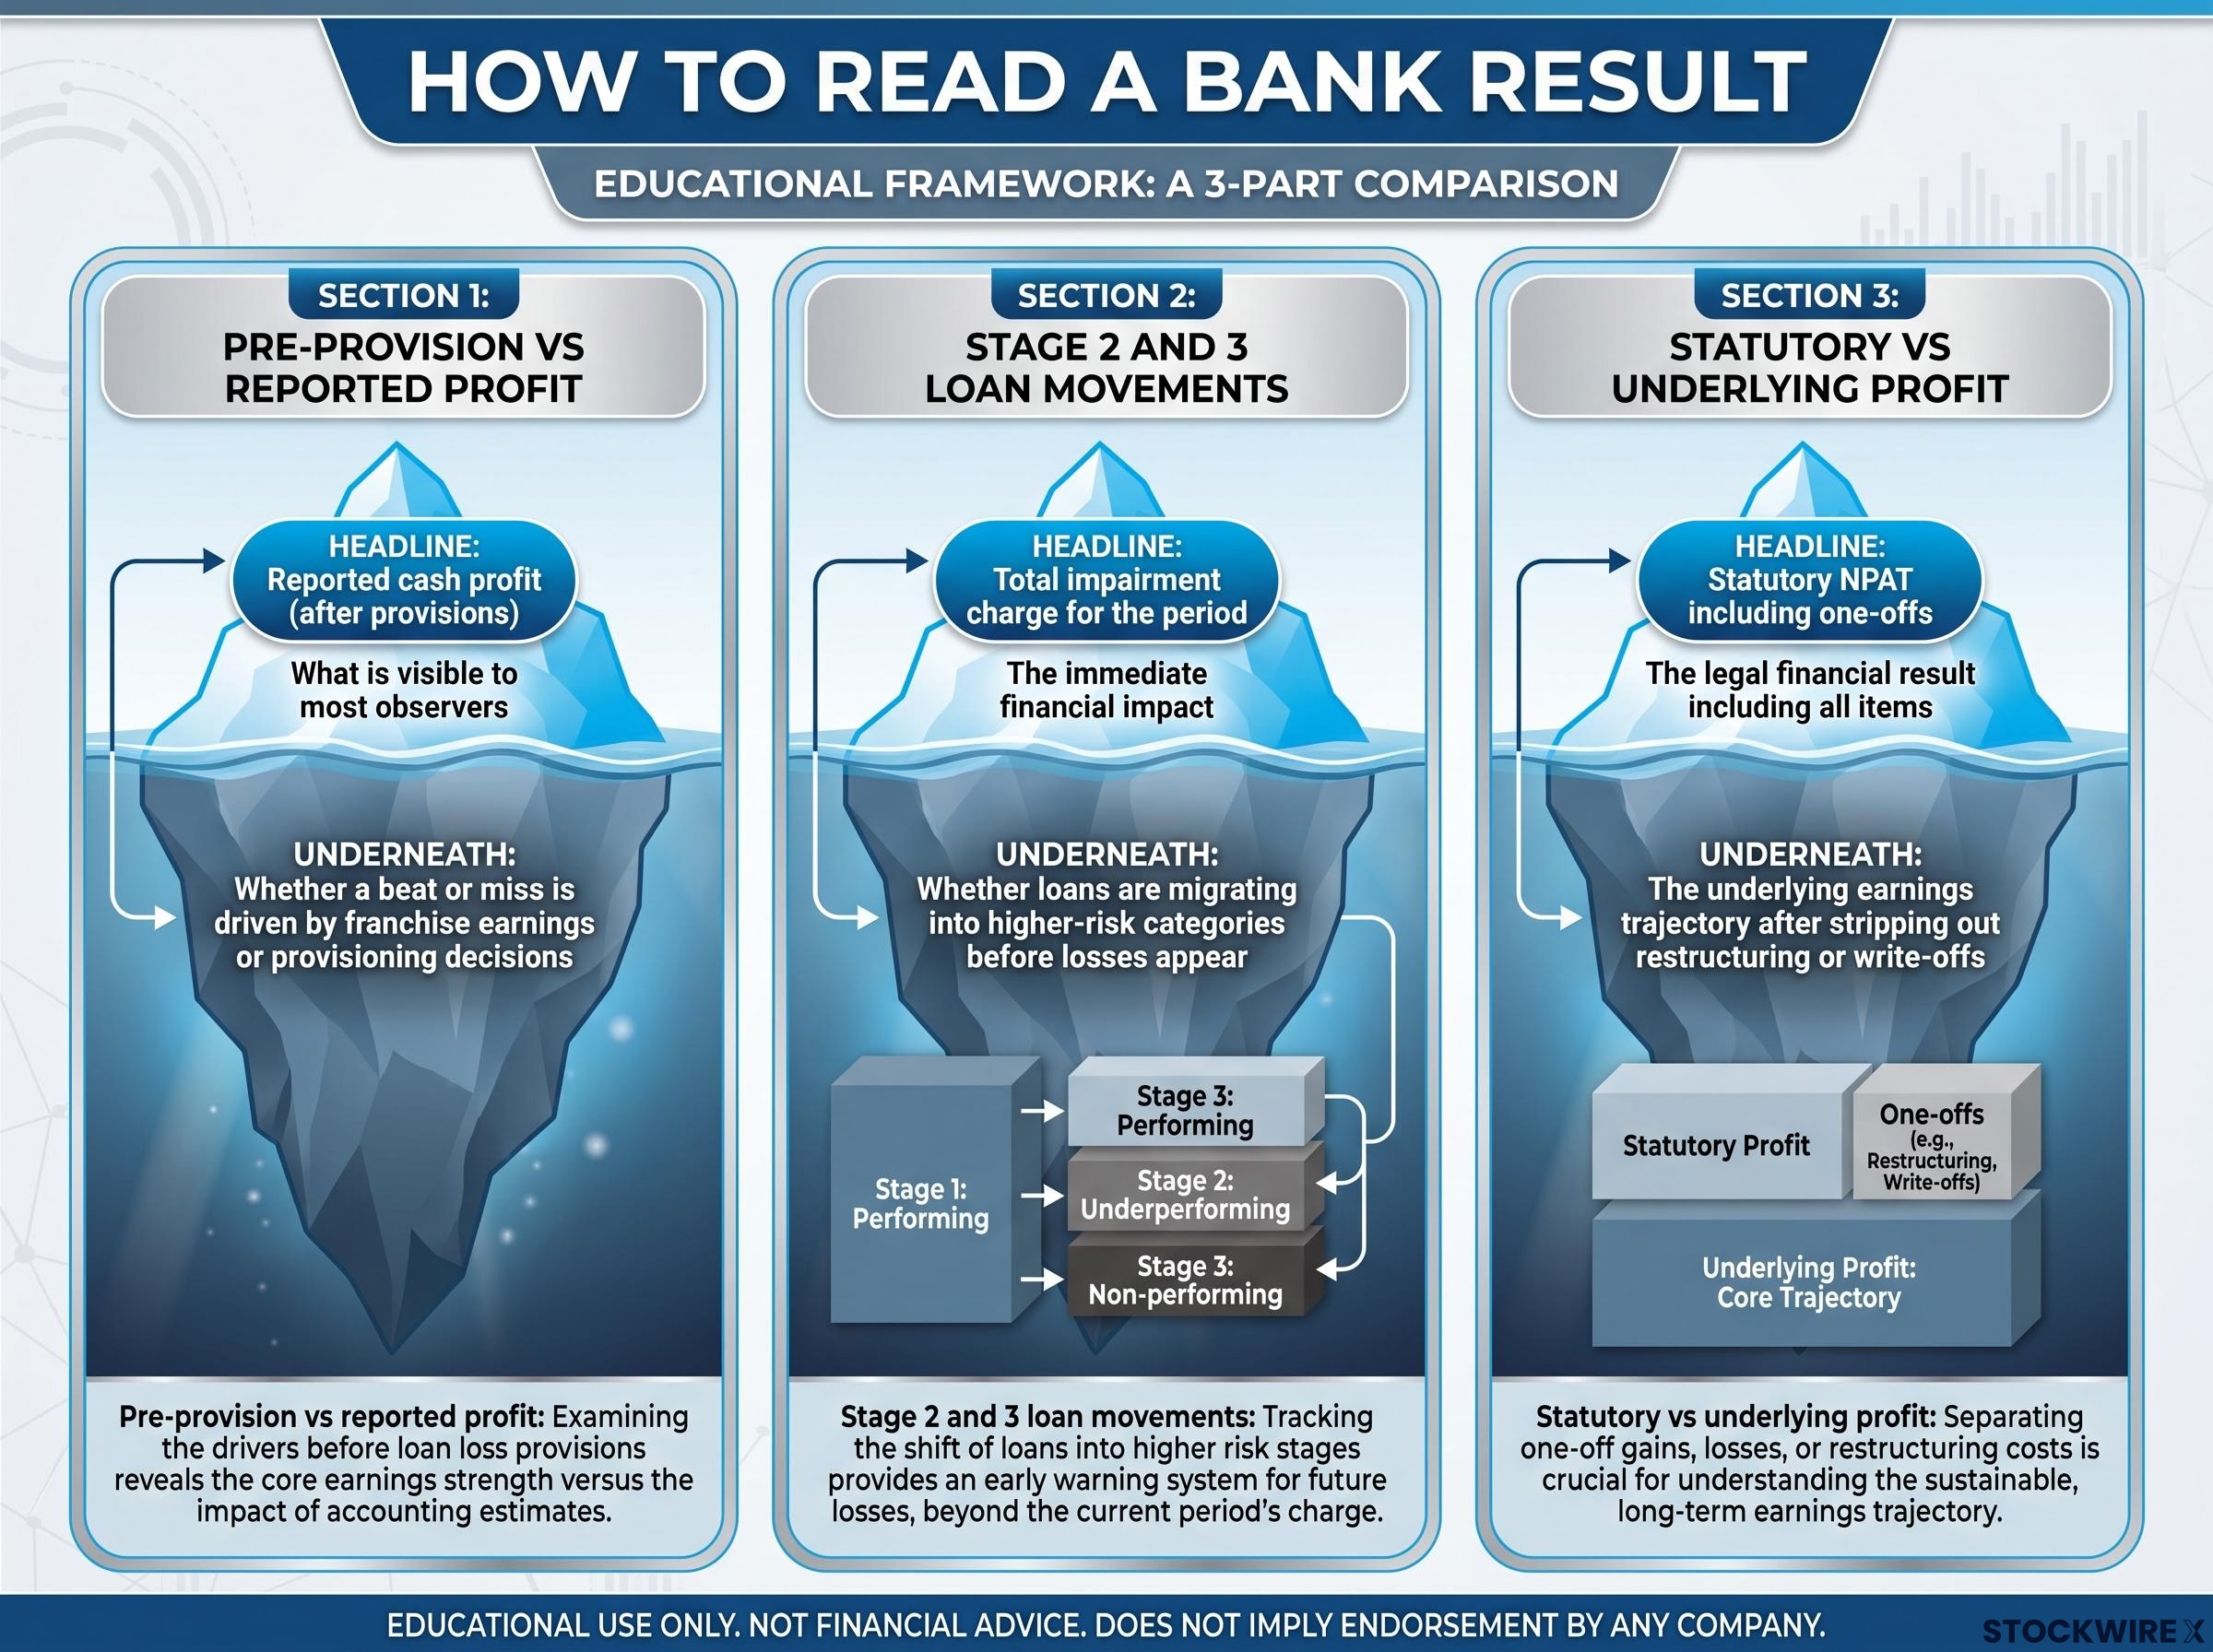
Before the first number drops, it is worth understanding three interpretive mechanics that separate a useful read of a bank result from a misleading one.
The diagnostic framework for reading an ASX bank stock result centres on three metrics, NIM direction relative to peers, ROE against sector averages, and CET1 against APRA minimums, and applying all three simultaneously prevents the misreading that comes from anchoring on any single number.
- Pre-provision profit versus reported profit. Pre-provision profit strips out bad-debt charges and shows you the earnings power of the underlying franchise. A bank can beat expectations on pre-provision profit and still miss on the reported bottom line if it chooses to build conservative buffers against future losses. That distinction matters: Macquarie estimates ANZ will outpace consensus by around 1% on a pre-provision basis, but the resulting bad-debt charges could drag the reported bottom line to a roughly 1% shortfall.
- Stage 2 and Stage 3 loan movements. Banks classify their loans into stages based on credit risk. Stage 1 means performing normally. Stage 2 means credit risk has increased significantly since the loan was first made. Stage 3 means the loan is impaired, and losses are likely. Movement from Stage 1 into Stage 2 is the early warning signal; it shows credit stress building before it hits the income statement as an impairment charge. CBA’s Stage 2 and 3 movements will be a key arrears framework to watch.
APRA’s prudential reporting framework, updated in July 2026 with amendments to credit quality classification and provisioning standards, provides the regulatory definitions that underpin how Australian banks measure and disclose Stage 2 and Stage 3 loan migrations.
- Statutory versus underlying profit. Some banks, particularly Bendigo, carry restructuring charges or technology write-offs that depress reported profit even when operations are performing well. UBS projected a 5% underlying beat at Bendigo, while Macquarie’s projected $20 million restructuring charge is expected to pull the reported result to around 3-4% short of consensus. A bank that misses on statutory profit but beats on underlying profit is not necessarily in trouble; it may be investing for future efficiency. The reader’s job is to determine which explanation fits.
| Concept | What the headline shows | What to look underneath |
|---|---|---|
| Pre-provision vs reported profit | Reported cash profit (after provisions) | Whether a beat or miss is driven by franchise earnings or provisioning decisions |
| Stage 2 and 3 loan movements | Total impairment charge for the period | Whether loans are migrating into higher-risk categories before losses appear |
| Statutory vs underlying profit | Statutory NPAT including one-offs | The underlying earnings trajectory after stripping out restructuring or write-offs |
Without this interpretive layer, you risk either panic-selling on a statutory miss that reflects sound risk management or being reassured by a cash profit beat that masks rising credit stress.
The Big Four under the microscope: bank-by-bank watch list
The valuation gap across the Big Four is wide enough that the same quality of result will produce meaningfully different price reactions. CBA sits at the expensive end, where even a strong print can produce a negative share price reaction if guidance disappoints. ANZ and NAB sit at the cheaper end, where solid but unspectacular results can support the price. Calibrate expectations before the numbers land, not after.
| Bank | Event | Date | Broker signal | Primary watch item |
|---|---|---|---|---|
| CBA | FY26 result | 12 Aug | Constructive, but valuation risk | NIM 2H vs 1H; dividend; arrears |
| Westpac | Q3 update | 10 Aug | Cautious (valuation stretched) | Bad debts vs Q2; NIM defence |
| ANZ | Q3 update | 13 Aug | Preferred exposure (Macquarie) | Pre- vs post-provision swing |
| NAB | Q3 update | 17 Aug | Preferred exposure (Macquarie) | Business lending impairments |
Commonwealth Bank (CBA)
The most consequential data point in CBA’s 12 August result is the second-half NIM compared with the 2.04% posted in the first half. Macquarie forecasts CBA’s cash profit to come in around 2% ahead of consensus, with the dividend expected to rise by 5 cents to $2.65 per share. CBA’s February 2026 result exceeded consensus and shares rose on the day.
But CBA is priced for quality. Its elevated valuation, flagged by both Macquarie and UBS, leaves limited tolerance for guidance disappointment. Any signal that deposit competition has eroded the margin lead, or that management is taking a more cautious approach to capital management, will be scrutinised heavily. A “good” result is not enough here; it needs to be good enough to justify the premium.
Westpac (WBC)
Westpac’s 10 August update is the season’s opening data point, and its heavy housing exposure makes it the bellwether for mortgage stress and arrears. Macquarie’s modelling places Westpac around 2% ahead of the consensus profit figure once the one-off restructuring charge is removed, though the broker cautioned that elevated bad-debt charges could erode that buffer entirely.
Any commentary on overlay provisioning or collective-provision builds will be read across to CBA, ANZ, and NAB within 48 hours. Macquarie has also noted that Westpac’s current valuation looks expensive relative to the returns the bank is generating. If Westpac starts building buffers, the market will extrapolate.
ANZ
ANZ’s 13 August update is defined by the pre-provision versus post-provision dynamic. Macquarie estimates approximately 1% pre-provision beat, potentially a 1% reported miss after charges. The swing variable is provisions, not franchise earnings.
ANZ’s loan-book composition across institutional, business, and retail lending makes its NIM story distinct from the more housing-concentrated peers. Macquarie identifies ANZ as a preferred exposure, partly because valuation provides more support than at CBA. A solid but unspectacular result, with sensible provisioning and decent loan growth, could make ANZ a relative winner.
NAB
NAB’s 17 August update carries the most direct read on business and SME credit conditions. Macquarie projects approximately 2% ahead on a pre-provision basis, approximately 1% on a reported basis.
Pre-provision profit dynamics at NAB have already demonstrated this season how a headline beat can mask underlying pressure points; the bank’s share price fell nearly 3% in May 2026 despite underlying profit growth of 6.4%, a precedent that makes the August trading update’s provisioning detail more consequential than the top-line number.
The segmental impairment breakdown is the key data point. If business impairments are rising faster than consumer impairments, that is a signal about where Australia sits in the credit cycle. Watch whether NAB’s pricing power in business banking is holding; if margins are eroding in that segment, the implications extend beyond the bank itself to the broader economy.
RBA Bulletin research on small business financial conditions published in October 2025 documented rising insolvency rates and tightening credit access for SMEs, providing the baseline against which NAB and Judo’s August disclosures on business lending impairments should be measured.
Judo Bank and Bendigo: the smaller names that carry outsized signals
Two banks that collectively represent a fraction of Big Four market capitalisation are nevertheless carrying information the market cannot get from the majors alone. Even investors with no exposure to either name should track these results as leading indicators.
Judo Bank (JDO)
Judo Bank reports its FY26 result on 18 August, and the reference point is the June 2026 earnings downgrade. The result either validates or worsens the market’s revised expectations.
Broker views are split. UBS cut its rating on Judo to Neutral on 26 June 2026, taking the view that the bank must rebuild market confidence by delivering sustained loan growth and demonstrating reliable control over credit losses. Macquarie holds a more constructive view, with an Outperform-equivalent rating, on the basis that the June earnings downgrade has already been absorbed into the share price. That split means management’s commentary on the credit outlook will function as a deciding vote.
Three items to watch:
- Actual loan losses versus the June guidance; any deterioration beyond what was already flagged
- Loan growth versus credit discipline, specifically whether new lending is coming at the expense of credit standards
- Funding costs and NIM, given Judo’s greater exposure to wholesale funding and deposit competition
If Judo’s loan-loss experience comes in worse than its own June guidance, that is not just a Judo story. It is a read-through to the broader SME credit cycle that affects NAB and every business lender in the sector.
Bendigo and Adelaide Bank (BEN)
Bendigo reports on 24 August, and the headline result is almost certain to mislead. UBS anticipates the second-half result will come in around 5% ahead of consensus on an underlying basis, driven by growth in the loan book. Macquarie’s numbers point to a $20 million restructuring charge pulling the reported bottom line to around 3-4% below consensus. The real analytical task is stripping out the one-off to assess the underlying earnings trajectory.
Three items to watch:
- The underlying versus statutory profit reconciliation before reacting to any profit figure
- Loan-book quality and growth, and whether above-system growth has come at the expense of credit standards
- AML and compliance commentary; brokers have pointed to regulatory exposure around anti-money-laundering obligations and the risks attached to partnership execution, and any disclosure on penalties or remediation costs is likely to draw significant market attention regardless of the amounts involved
Building a cumulative view across the season rather than reacting to headlines
The sequential order of results, Westpac first and Bendigo last, creates a rolling read on credit conditions that is more informative than any single print. Each result either confirms or complicates the picture the previous ones built. Four interpretive principles to apply across the season:
- Track NIM trajectory, not level. The direction of margins from one half to the next tells you more about FY27 earnings power than the absolute NIM number.
- Compare provisions across banks rather than against each bank’s own history in isolation. If bad-debt charges are rising at Westpac, CBA, and NAB simultaneously, that is a stronger signal of a credit cycle turn than an isolated charge at one name.
- Weight management tone on 2027 guidance over backward-looking profit numbers. What CEOs say about deposit competition, loan growth expectations, and provisioning intent for next year will shape forward valuations more than the result itself.
- Adjust for valuation when interpreting share price reactions. CBA needs better-than-expected NIM guidance to justify its premium multiple. ANZ and NAB can support their prices on a solid but unspectacular result. The same quality of update will produce different price reactions depending on where the stock sits on the valuation spectrum.
Forward guidance on margins, bad debts, and deposit competition carries more weight than a 1-2% beat or miss on the headline profit figure. The market has already priced in the results; what it has not priced in is what management says about the year ahead.
A sector-wide provision build, even if each individual bank’s charge appears manageable, is the scenario that changes the macro thesis and warrants a reassessment of bank sector weighting, not just position sizing in one stock.
Distinguishing cyclical versus systemic bank risk is the interpretive question that makes the difference between a provisioning cycle that resolves within 12-18 months and one that compresses dividends and share prices for a decade, and a sector-wide provision build across August results would be the clearest signal that the question needs revisiting.
What the August 2026 season will tell you that the next one cannot
The season as a whole will answer one question: whether Australian banks are entering a credit-cost cycle that compresses earnings into FY27, or managing a short-term provisioning adjustment that leaves the medium-term growth story intact.
Heading into the season, there is no settled answer on NIMs. Whether deposit competition has now run its course or still has further to travel will determine the outcome for margin guidance. Three specific signals would materially change the sector’s investment case:
- Broad-based provision builds across multiple banks, not just isolated charges at one name
- NIM guidance below current consensus for FY27, signalling margin pressure is structural rather than temporary
- Evidence of SME credit deterioration at both Judo and NAB, confirming that business lending stress is broadening rather than concentrated
Should all three emerge from the August reporting round, they would add substantial weight to the rotation thesis UBS has been advocating. Macquarie’s preference for ANZ and NAB over the broader sector, alongside UBS’s push toward miners, presents an alternative framework for capital deployment that the season’s results will put to the test.
CBA’s premium valuation makes it the most exposed name to a negative re-rating if guidance disappoints. The June 2026 Judo earnings downgrade is already a leading indicator in the public domain. Investors who leave this season with a clear view on credit cycle direction and margin trajectory are better equipped to make active portfolio decisions than those who simply tallied beats and misses.
This article is for informational purposes only and should not be considered financial advice. Investors should conduct their own research and consult with financial professionals before making investment decisions. Past performance does not guarantee future results. Financial projections are subject to market conditions and various risk factors.