National Australia Bank hit an all-time high near A$49 in February 2026. By June, the stock had fallen to A$35.48, a drawdown of roughly 28%. It has since recovered approximately 20% to the low A$42s as of 5 August 2026.
That is an unusually large swing for a big-four bank stock inside a single calendar year. The rebound has already happened, which means the question facing investors now is not whether the bottom is in but whether the recovery has room to continue, or whether it has already priced in the good news.
The Reserve Bank of Australia’s (RBA) Monetary Policy Board meets on 10-11 August 2026, with the rate decision due at 2:30 pm AEST on 11 August. That gives this analysis a concrete near-term catalyst. Here is what you need to assess the NAB share price from this point: where the price has been and why, what structural features the bank brings to the table, and what specific forces could push the stock in either direction in the weeks ahead.
From record high to June trough: tracing the 28% drawdown
The price arc tells a clear story when you lay it out in sequence. NAB reached an all-time high of approximately A$49.10 in February 2026 (the 52-week high in research data reads A$49.45; the minor discrepancy likely reflects intraday versus closing price methodology). From there, the stock declined progressively through March, April, and May before hitting its 2026 low of A$35.48 in June. The month closed at A$37.86 on 30 June 2026, and by early August the recovery had lifted the price to approximately A$42.68.
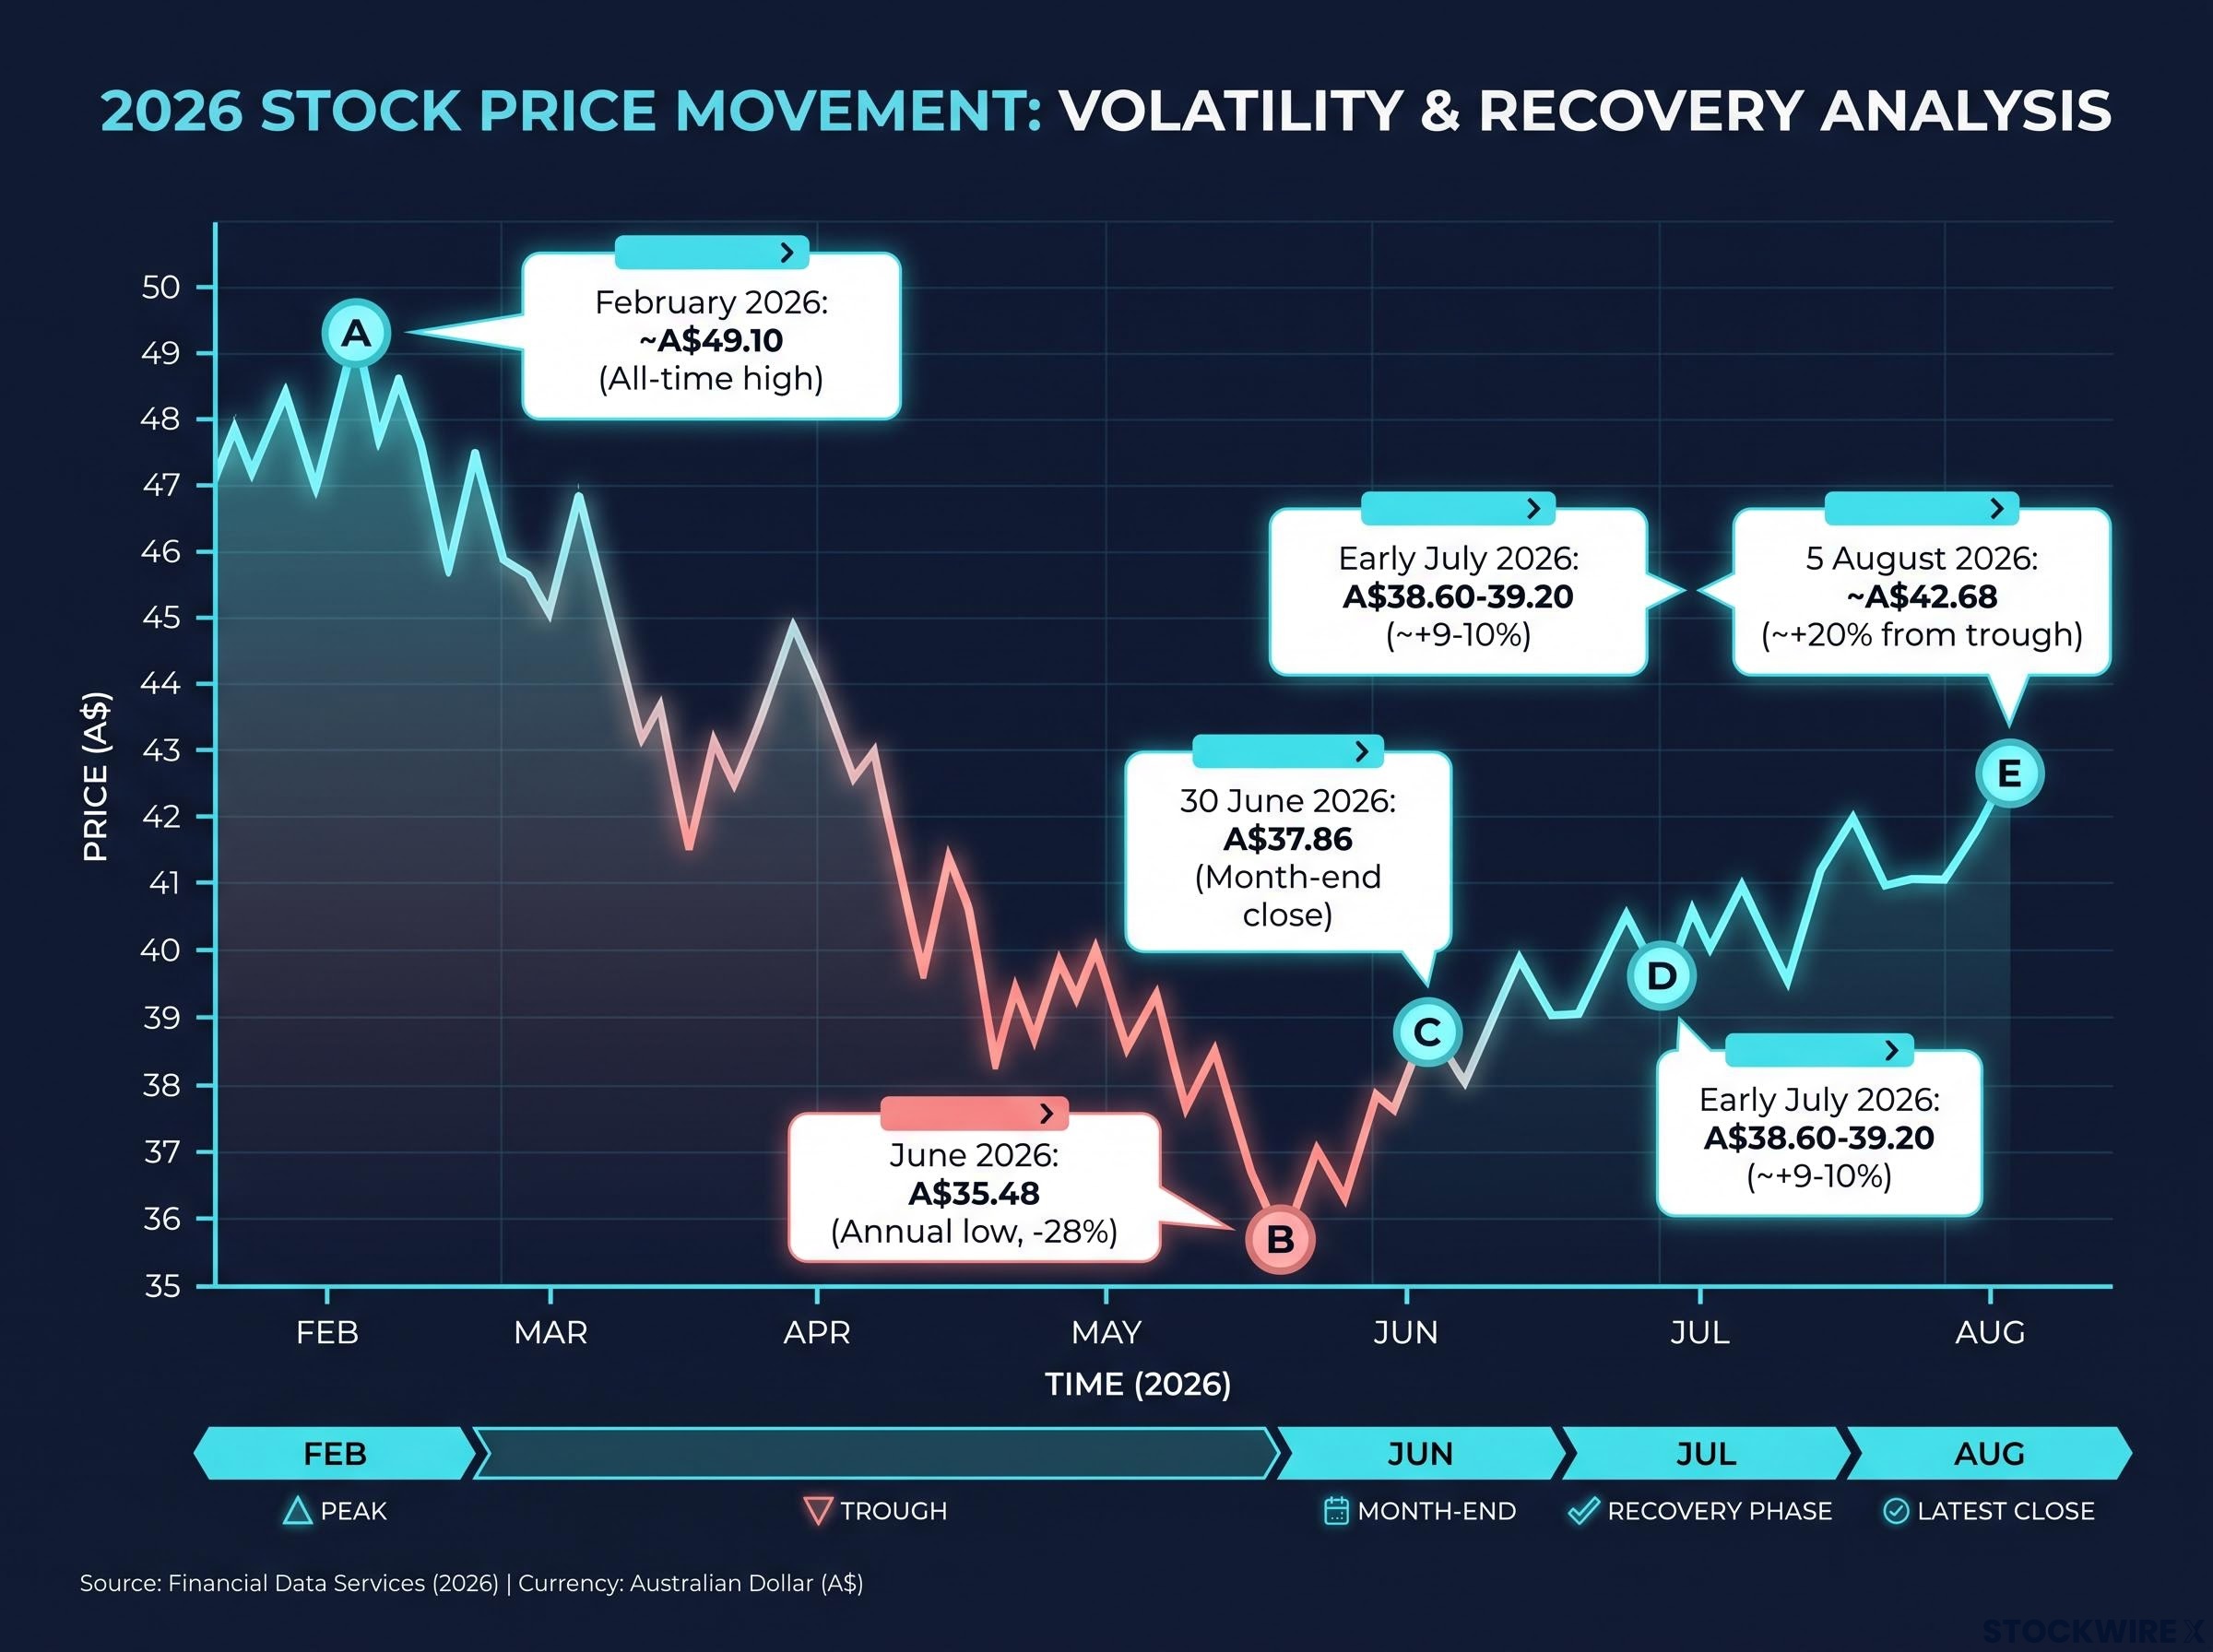
The key milestones, in order:
- February 2026: All-time high of approximately A$49.10 (A$49.45 on a 52-week basis)
- June 2026: Annual low of A$35.48
- 30 June 2026: Month-end close at A$37.86
- 5 August 2026: Recovery to approximately A$42.68
| Date | Price level | Movement |
|---|---|---|
| February 2026 | ~A$49.10 | All-time high |
| June 2026 | A$35.48 | ~-28% from peak |
| 30 June 2026 | A$37.86 | Month-end close |
| 5 August 2026 | ~A$42.68 | ~+20% from trough |
A 28% peak-to-trough drawdown is not routine sector rotation for a stock of this size and liquidity. Something more structural was at work, and understanding what drove the sell-off is the first step to assessing whether those forces have genuinely faded or merely paused.
When big ASX news breaks, our subscribers know first
What kind of bank NAB actually is (and why it matters for the price)
Before weighing the drivers of the sell-off and the recovery, it is worth pausing on what investors are actually buying when they own NAB shares. This is not a generic bank exposure.
By market capitalisation, NAB ranks as the fourth-largest listed company on the ASX and slots in as the third-biggest among Australian banks. It sits alongside Commonwealth Bank, Westpac, and ANZ in the big-four group, but its earnings mix is meaningfully different. Among the major banks, NAB has built the strongest franchise in business and SME lending, giving it a revenue profile that tilts more towards corporate credit cycles, transaction banking, and commercial deposits rather than relying primarily on residential mortgage volumes.
That tilt matters for how you read the share price. Key structural characteristics:
- Market position: 4th-largest ASX company, 3rd-largest Australian bank
- Business banking focus: Australia’s leading SME and business lender, with greater exposure to corporate credit conditions than mortgage-heavy peers
- Earnings diversification: Revenue driven by net interest income (the spread between what the bank earns on loans and pays on deposits), fees, and commissions across multiple business lines
- Dividend profile: Fully franked dividends, a feature that remains central to income-oriented Australian portfolios
What this means in practice is that NAB’s share price is more sensitive to business investment intentions, corporate borrowing demand, and SME credit conditions than to house prices alone. That distinction becomes directly relevant when you consider the RBA catalyst ahead.
Why did a blue-chip bank fall 28%? The drivers behind the sell-off
The sell-off was not a single event. It was three forces compounding each other over several months, each reinforcing the others.
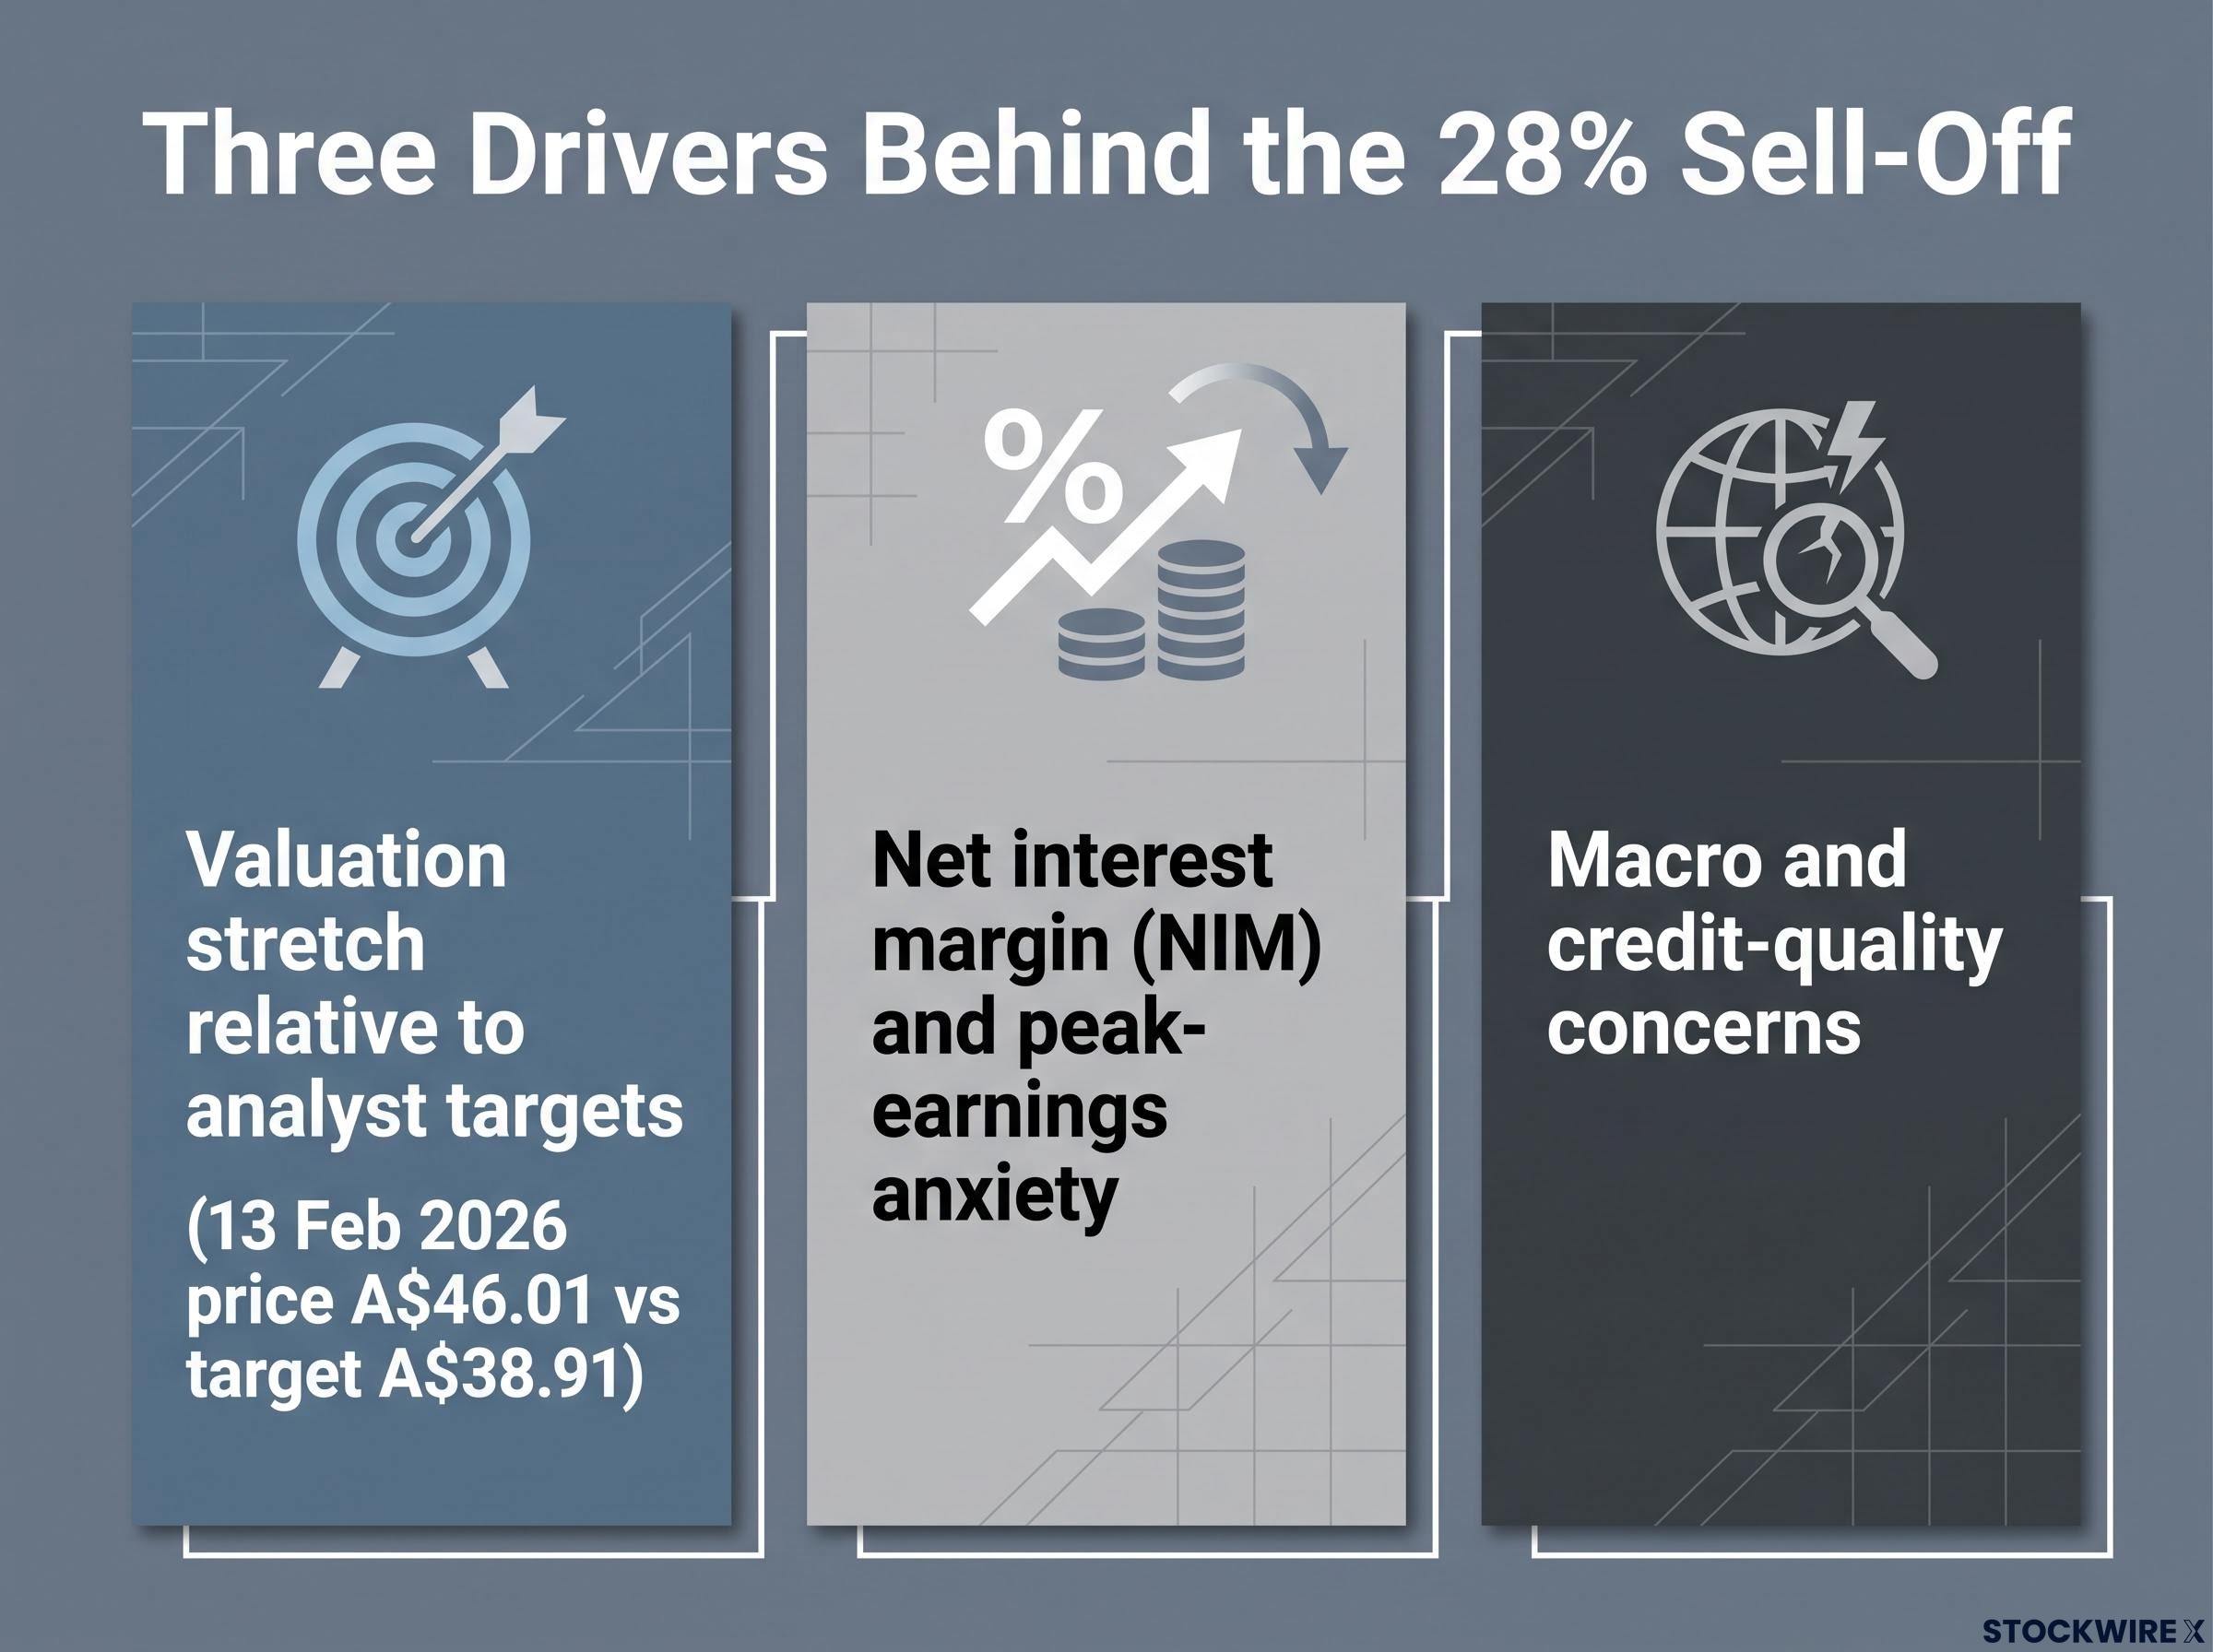
- Valuation stretch relative to analyst targets. By early 2026, NAB had rallied well past where most analysts thought the stock was worth. A 13 February 2026 price snapshot showed the stock at A$46.01, while the consensus 12-month target sat near A$38.91. That gap meant optimistic expectations were already baked in, and the margin of safety for any negative surprise was thin.
- Net interest margin and peak-earnings anxiety. Net interest margin, or NIM, is the spread between what a bank earns on its loans and pays on its deposits. As the RBA rate cycle approached what investors believed was its peak, markets began marking down expectations for bank earnings. The logic was straightforward: if rates stop rising or start falling, the tailwind that lifted margins through the hiking cycle reverses. Investors began pricing in “peak earnings” for the sector.
NIM trajectory is not just one variable among many for ASX bank stocks; compression of even 15-20 basis points can materially reduce net profit and dividend capacity, which is why the rate path debate carries such disproportionate weight in bank share pricing relative to most other sectors.
- Macro and credit-quality concerns. Worries about slower credit growth and potential deterioration in asset quality added a third layer of pressure. Even where actual loan losses remained contained, the forward-looking anxiety drove a sentiment-led de-rating across the banking sector.
NAB was trading at A$46.01 on 13 February 2026 against a consensus analyst target near A$38.91, implying the market had priced in several quarters of outperformance that had not yet been delivered.
The important detail for assessing the rebound is this: sentiment and valuation mathematics drove the sell-off more than hard earnings deterioration. That distinction matters because it means the recovery, when it came, had a plausible fundamental basis rather than relying on speculative hope alone.
What is behind the 20% recovery from the June low
The rebound from A$35.48 to approximately A$42.68 by 5 August 2026 was not a single-day spike. It built progressively: early July saw NAB trading in the A$38.60-39.20 range, meaning the move from trough to current levels unfolded across roughly six weeks.
Rate expectations and the NIM recalibration
The primary catalyst was clarity. As uncertainty about the RBA’s policy path began to ease, the worst-case NIM scenarios were taken off the table. Analysts could refine forecasts rather than assume worst-case compression, and the sector re-rated accordingly.
For NAB specifically, the business lending book added a second dimension to this recalibration. Corporate credit margins and SME lending volumes are not purely a function of the cash rate; they also reflect business confidence and investment intentions. As both stabilised, the outlook for NAB’s most differentiated revenue stream improved alongside it.
The 1H26 result reinforced NAB’s structural differentiation: business lending volumes rose 5.6% in the Business and Private Banking division, with cash earnings from that segment growing 5.4%, confirming that the SME franchise continued to perform even as the headline statutory profit figure was distorted by a one-off accounting charge.
Valuation reset and the return of income buyers
The sell-off itself created its own recovery catalyst. Once NAB fell from the A$49 region to the mid-A$30s, it moved from trading well above consensus analyst targets to trading at or below them. That threshold matters to systematic income investors and long-term holders who had been priced out during the rally.
Morningstar’s fair value estimate near A$49 (which has not been independently verified and should be treated as one data point among several) suggested scope for further upside from the low A$42s on that framework. Short-covering and broader sector rotation also played a role: the big-four banks tend to move together, and once selling pressure exhausted itself, re-rating was partly mechanical.
| Date | Price level | Gain from trough |
|---|---|---|
| June 2026 (trough) | A$35.48 | Baseline |
| Early July 2026 | A$38.60-39.20 | ~+9-10% |
| 5 August 2026 | ~A$42.68 | ~+20% |
The progressive nature of the recovery, visible through the early-July stepping stone, suggests a more sustained re-rating rather than a short-squeeze spike. That matters for investors assessing whether the move has durability or whether it was a technical bounce waiting to unwind.
NAB’s position heading into the 11 August RBA decision
RBA Monetary Policy Board decision: 11 August 2026 at 2:30 pm AEST.
This is not a generic macro event for NAB holders. The RBA decision carries two distinct scenario paths, and NAB’s business lending book makes the stock particularly sensitive to which one materialises.
| Scenario | Implication for NAB |
|---|---|
| RBA holds rates and signals a prolonged plateau | Supports near-term margins (no NIM compression from cuts), but raises concerns about ongoing borrower stress and potential asset-quality deterioration if higher rates persist |
| RBA flags or delivers rate cuts | Raises NIM compression risk as lending rates may fall faster than deposit costs, but could support credit growth volumes and ease repayment stress, improving asset quality |
Neither scenario is cleanly positive or negative. The net effect depends on how investors balance near-term margin implications against the medium-term volume and credit-quality outlook.
What makes this catalyst particularly relevant to NAB is the business lending angle. Any shift in corporate borrowing cost expectations, investment intentions, or default risk flows directly through NAB’s most differentiated business line. A rate hold that discourages business investment hits NAB differently from how it hits a mortgage-heavy peer. A rate cut that stimulates SME borrowing benefits NAB more directly.
That gives investors holding or considering NAB a near-term decision point with a known date.
CBA’s FY26 full-year result lands on 12 August, the day after the RBA decision, and its second-half NIM and arrears data function as sector read-throughs for NAB, Westpac, and ANZ, which do not report their own full-year numbers until the September window.
Risk and reward at A$42: the variables that will define NAB’s next move
At approximately A$42.68, NAB sits roughly 13-15% below its February peak, well above its June trough, and approximately flat year-to-date (about +1%) with a 12-month return of around +12%.
That positioning is neither obviously cheap nor obviously expensive by most frameworks. The stock has recovered enough to erase the panic discount, but not enough to recreate the valuation stretch that preceded the sell-off.
Supportive factors:
- Big-four franchise scale and systemic importance
- Business and SME earnings diversification beyond the housing cycle
- Fully franked dividend income, a persistent draw for Australian income investors
Fully franked dividend income from NAB and its big-four peers generates a grossed-up yield that is materially higher than the headline cash figure shown on most broker screens, a gap that widens further for pension-phase SMSF members who receive franking credits as a direct ATO cash refund rather than a tax offset.
Key risks:
- NIM sensitivity to whichever direction the RBA moves
- Potential credit-quality deterioration if the Australian economy slows further
- Business conditions and SME confidence, which feed directly into NAB’s most differentiated revenue line
The next directional move is likely to be determined by which of three specific variables resolves first: the RBA policy path (beginning with the 11 August decision), Australian business conditions and SME credit demand, and asset quality trends in the loan book. Investors who can identify which of those three matters most to their own thesis are better positioned to make an informed hold, add, or reduce decision than those reacting to the price alone.
This article is for informational purposes only and should not be considered financial advice. Investors should conduct their own research and consult with financial professionals before making investment decisions. Past performance does not guarantee future results.