More than half of all new ETF listings on the ASX this financial year were actively managed. That is a striking number, given that decades of performance research keep arriving at the same conclusion: most active strategies fail to beat a cheap index fund after fees.
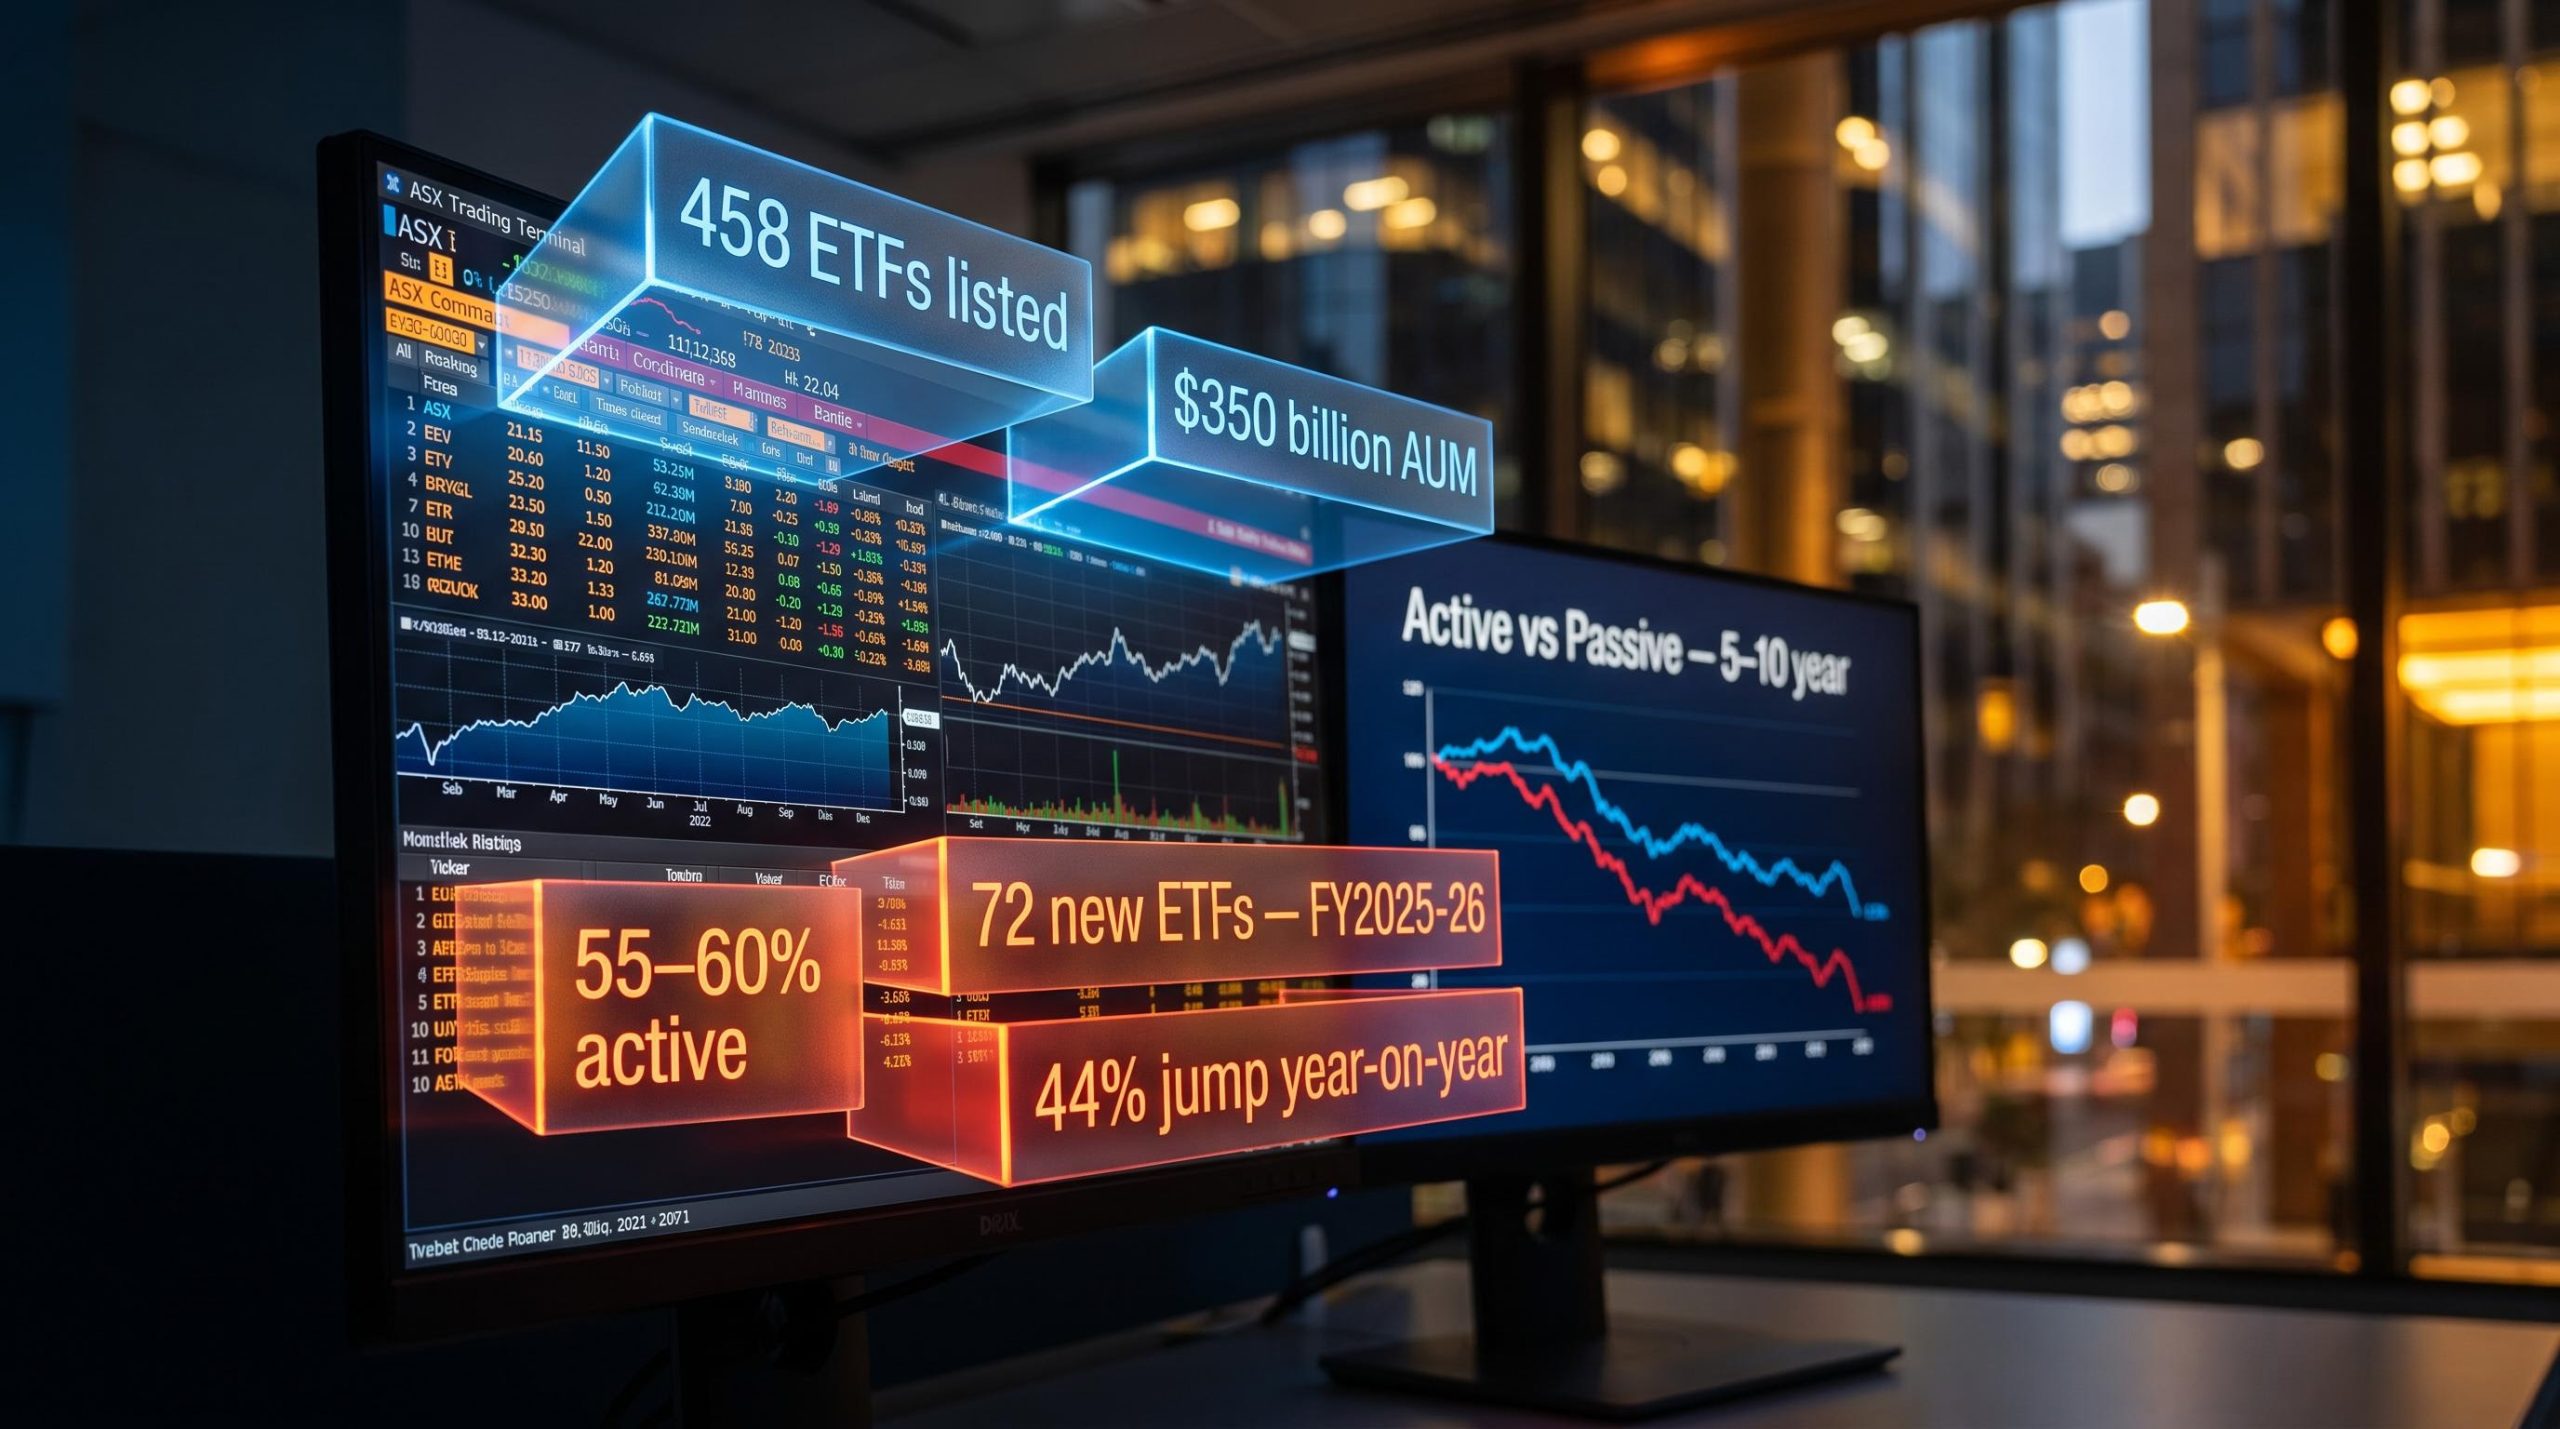
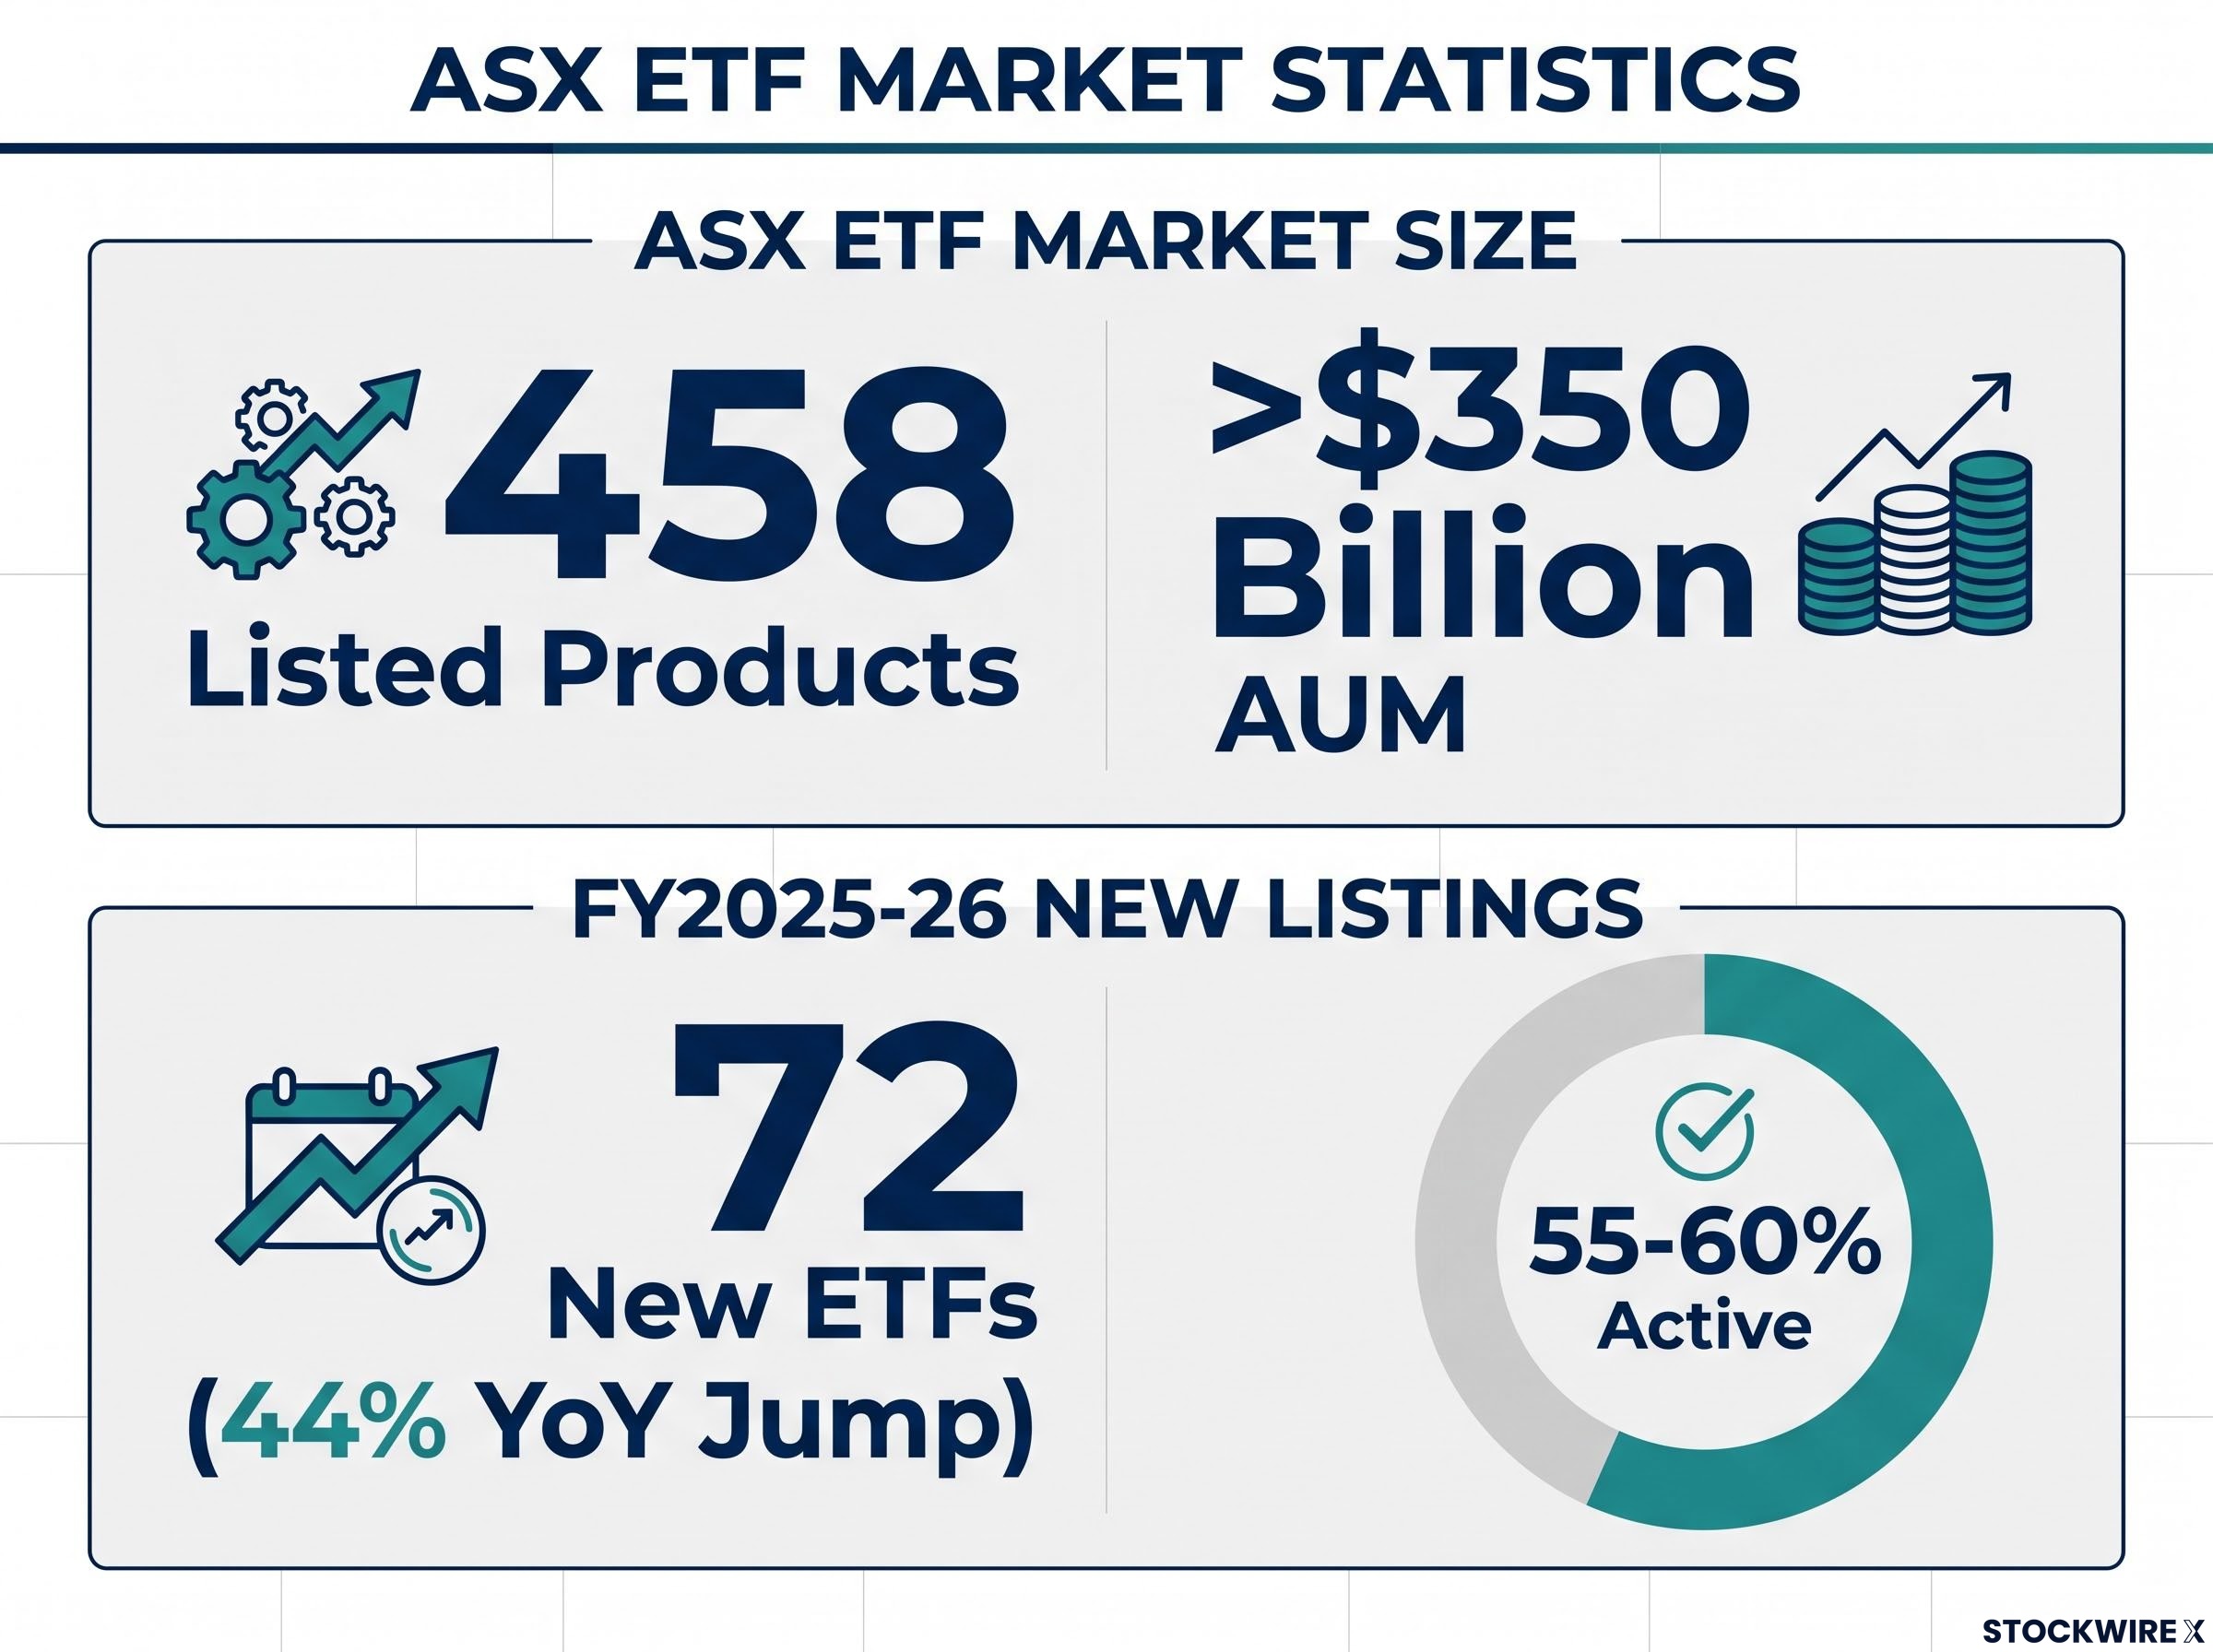
The gap between supply and evidence is worth examining. The ASX ETF market now holds 458 listed products and more than $350 billion in assets under management, with 72 new ETFs listed in FY2025-26 alone, a 44% jump year-on-year. Active strategies accounted for roughly 55-60% of those new listings. The question is whether this boom reflects genuine investor outcomes or something closer to product marketing momentum.
Here is a framework for working through that question, built on the performance data, the fee arithmetic, and the segments where the evidence actually supports an active tilt. The goal is a practical judgment call you can apply to any active ETF you encounter, not a blanket verdict in either direction.
More than half of new ASX ETF listings are now active: here is what that actually means
The numbers are directionally consistent across multiple data sources. Approximately 60% of new ASX ETF listings in the most recent financial year (prior to August 2026) were classified as active, according to Morningstar Australasia data cited by Simonelle Mody, Associate Investment Specialist. A separate annual industry review, covering a slightly different period, counted 28 of 50 new listings as active, landing at roughly 56%.
Active funds made up close to 60% of new ETF listings on the ASX during the most recent financial year, according to Morningstar Australasia data.
Either way, active strategies now represent the majority of new supply. That shift is worth understanding before treating any individual launch as a signal of investor demand.
Three structural forces are pushing active strategies into ETF wrappers:
- Manager distribution: Listing on the ASX gives fund managers a far more direct route to self-directed investors than selling through unlisted managed fund structures. For many managers, the ETF format is primarily a distribution decision rather than a product innovation.
- Investor appetite for outperformance: Many investors still believe skilled managers can add value, particularly in volatile markets. Packaging those strategies as ETFs meets that demand with intraday liquidity and transparency.
- Product innovation in fixed income and multi-asset: A noticeable share of new active ETFs sits in corporate bonds, cash-plus, and diversified “Core+” ranges, segments that lend themselves more naturally to active decision-making.
The listing data tells you that product supply is running ahead of any evidence-based case for broad active outperformance. Readers should hold that asymmetry in mind before interpreting a new active ETF launch as validation of the strategy it contains.
When big ASX news breaks, our subscribers know first
Active versus passive: what the ETF wrapper does and does not change
Both active and passive ETFs trade on the ASX like shares. Both use the same exchange-traded wrapper. The difference is portfolio construction.
A passive ETF tracks an index, such as the S&P/ASX 200, by holding its constituents in similar weights. The aim is to match the market return at low cost. An active ETF employs a portfolio manager or investment team to make deliberate security selection and timing calls, with the aim of beating a stated benchmark or delivering a particular investment outcome.
The ETF wrapper changes distribution, intraday liquidity, and transparency. What it does not change is the underlying performance dynamics of active management. A fund manager’s stock-picking record does not improve because the strategy was repackaged into an exchange-traded format.
| Feature | Passive ETF | Active ETF |
|---|---|---|
| Objective | Match index return | Outperform benchmark or achieve specific outcome |
| Portfolio construction | Rules-based index replication | Manager discretion on security selection and timing |
| Typical MER range | Below 0.20% | Around 0.50% or higher |
| Performance benchmark | Index it tracks | Stated benchmark (often the same index) |
| Key risk | Market risk (moves with the index) | Market risk plus manager underperformance risk |
The fee gap and why it compounds
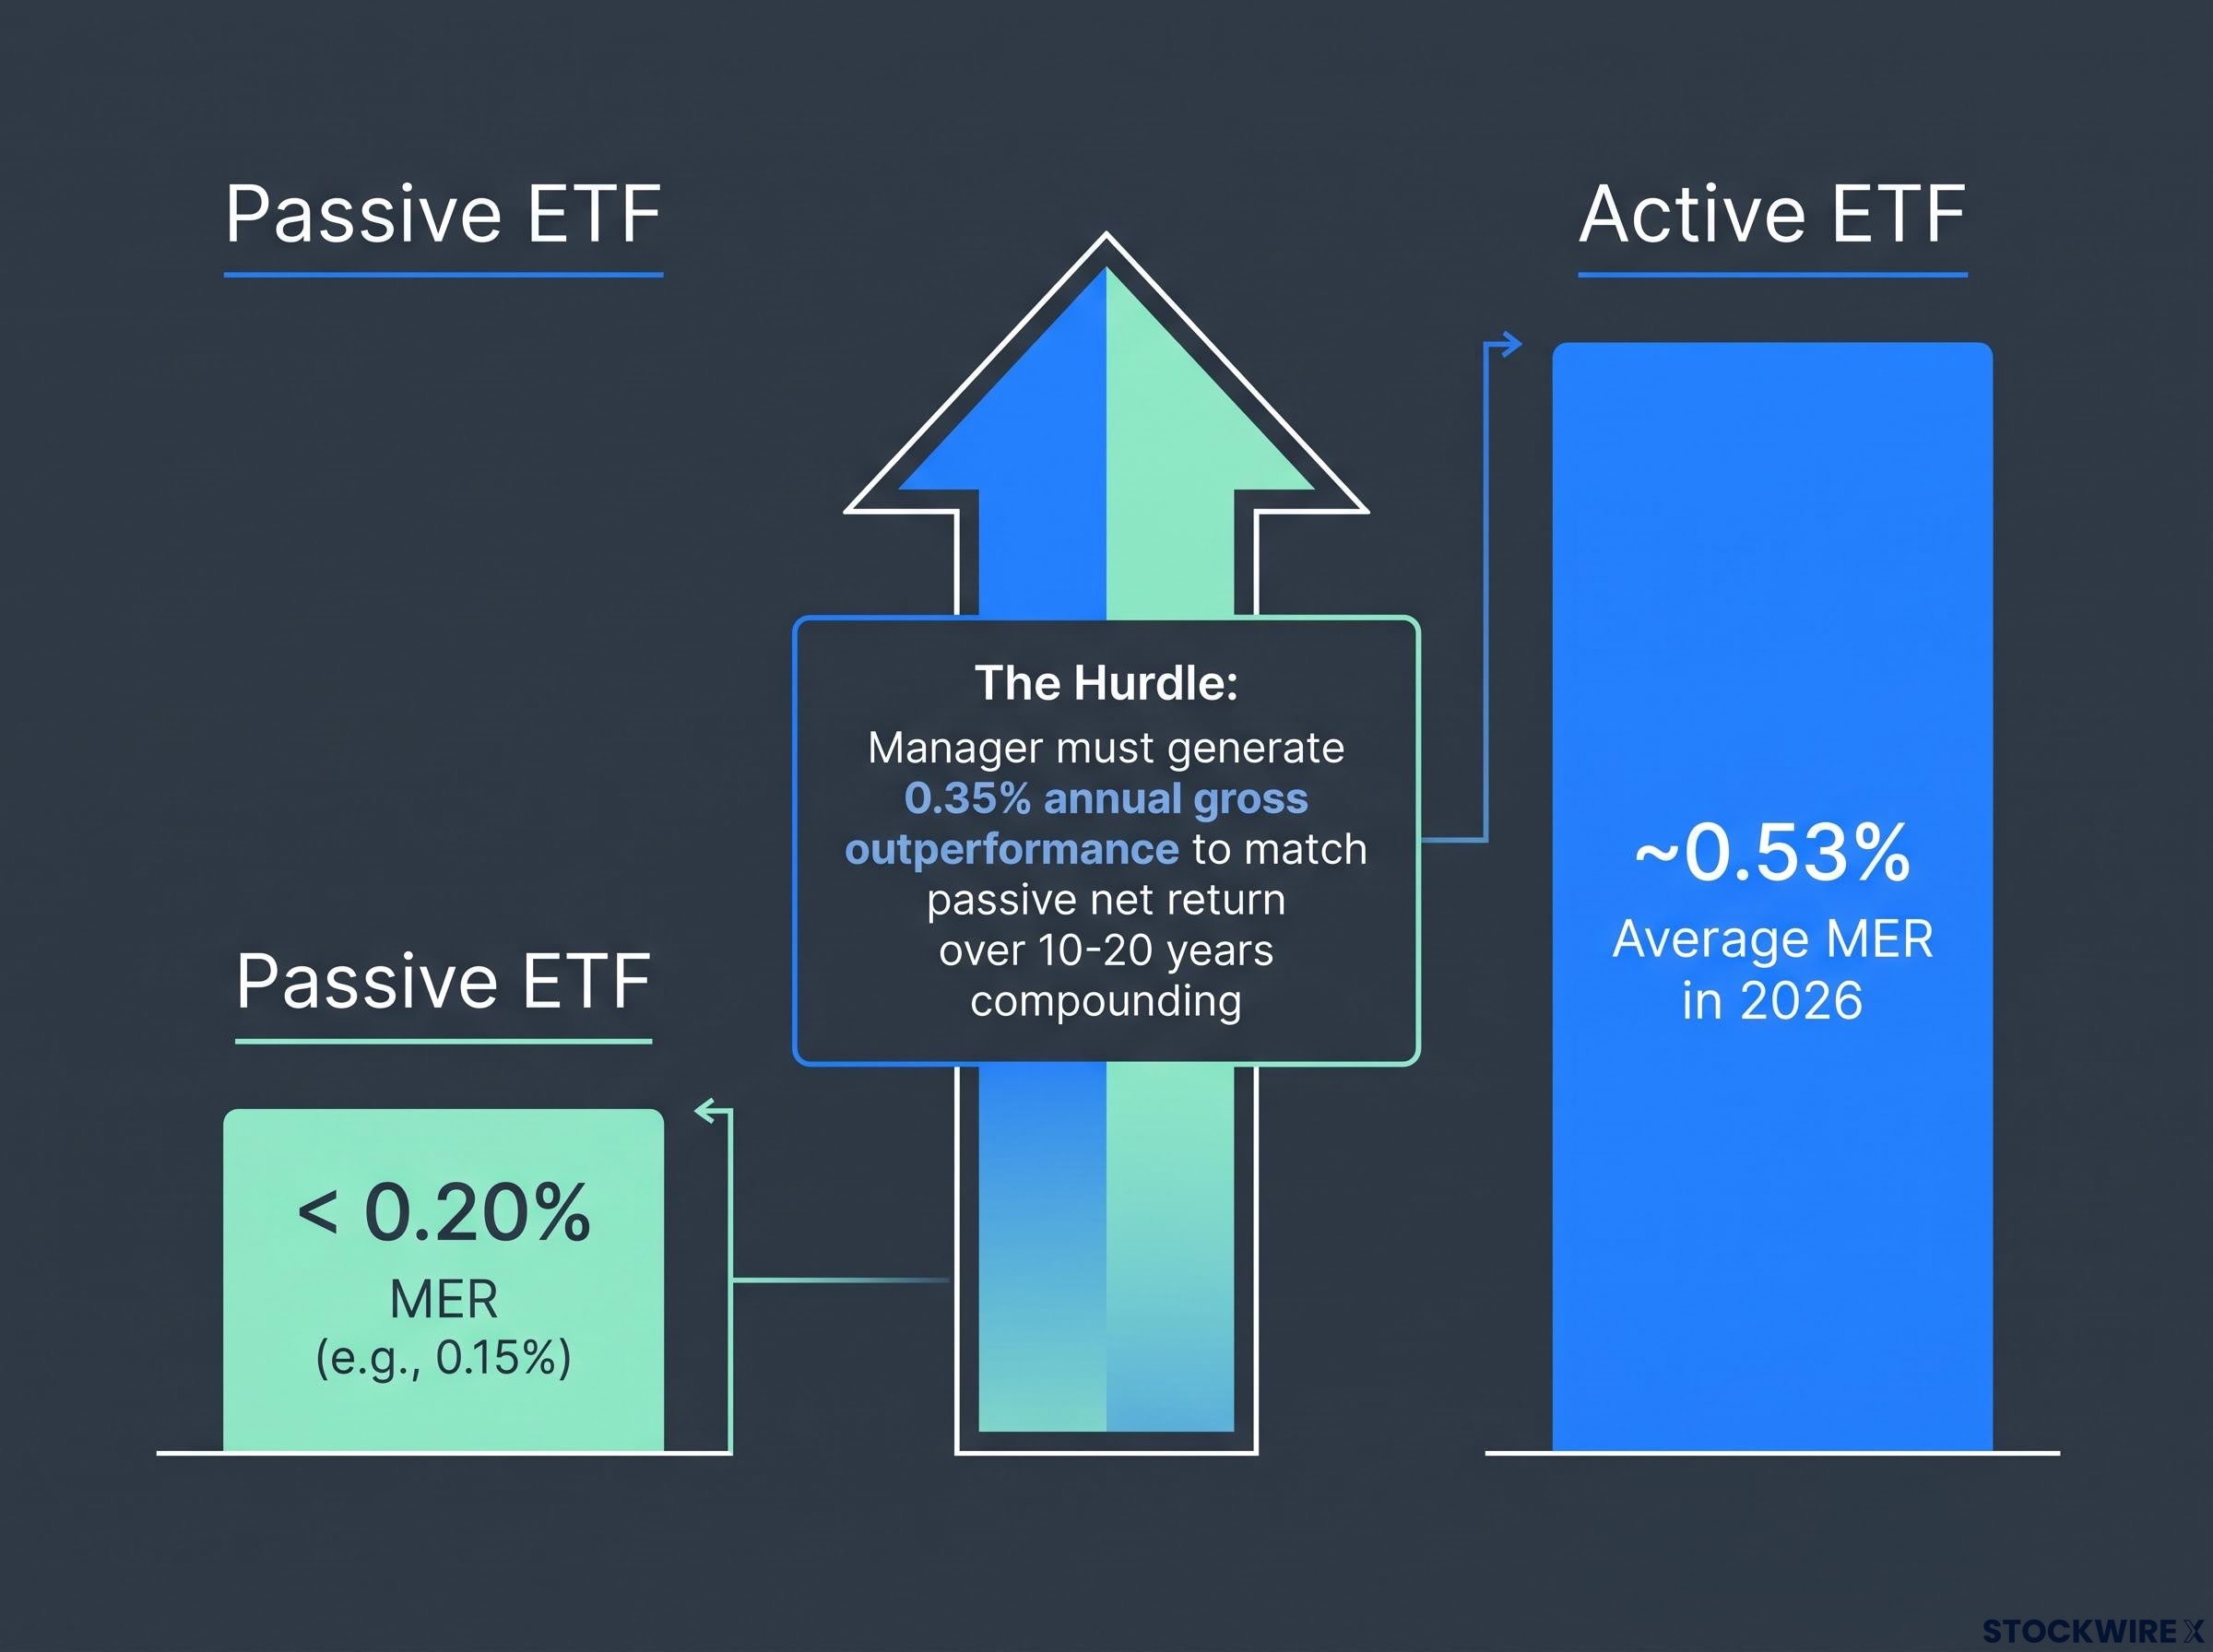
The average management expense ratio (MER), the annual percentage fee deducted from your returns, for new ASX ETFs in 2026 sits at approximately 0.53%. Index-tracking ETFs typically charge below 0.20%. That spread may look small in a single year. It is not small over time.
A manager charging 0.50% versus a passive fund at 0.15% must generate 0.35% of annual gross outperformance just to match the passive fund’s net return. Over 10-20 years, that 0.35% annual drag compounds significantly against ending portfolio value. The fee gap is not just a cost comparison; it is a compounding performance tax that most active managers fail to overcome across a full market cycle. Every active ETF evaluation should start here.
The fee compounding mechanics behind that arithmetic are more concrete than they might appear: a 0.9 percentage point difference in annual MER compounds to approximately $98,917 in lost wealth over 20 years on a $100,000 investment, with no market downturn required to produce that outcome.
What decades of performance research actually show
Morningstar’s Active/Passive Barometer and S&P’s SPIVA scorecards have been running this experiment for years, across markets, across asset classes, across time horizons. The pattern that emerges is consistent enough to take seriously.
Over 5-10 year horizons, the majority of active funds underperform comparable passive index funds after fees. This holds across large-cap domestic equity, global developed markets, and most core bond categories. The findings span both US and global editions of the Morningstar barometer through 2025-26, corroborated by the SPIVA data.
The Australian-specific SPIVA data on active fund underperformance in Australia reinforces this pattern: 74% of Australian equity general fund managers failed to beat the S&P/ASX 200 in 2025, a year described as unusually favourable for stock selection, and the underperformance rate climbs to 87% over 15 years.
The Morningstar Active/Passive Barometer consistently finds that active funds trail comparable passive options across most equity categories when measured over 5-10 year periods on a fee-adjusted basis.
Three structural reasons explain why this pattern persists:
- Fee drag: Active funds carry a higher MER, creating a performance hurdle that compounds annually. The weight of long-run evidence from Morningstar’s research indicates that the typical active fund struggles to clear this cost barrier over extended holding periods.
- Market efficiency in large-cap segments: In heavily researched markets, thousands of professionals analyse the same companies. Prices incorporate information quickly, leaving little room for persistent outperformance once costs are considered.
- The luck-versus-skill identification problem: Short outperformance runs of two or three years are difficult to distinguish from style tailwinds or fortunate timing. Strong recent records are no guarantee of future consistency, and even well-regarded managers can endure prolonged periods of trailing their benchmark.
There is a further wrinkle. Survivorship bias, where underperforming funds are closed or merged rather than left running, makes the aggregate active performance record look better than it actually is. The funds that failed simply disappear from the dataset.
Simonelle Mody of Morningstar Australasia has noted these dynamics in the Australian context specifically. The research does not say active managers are unskilled. It says that skill is difficult to identify in advance, that fees erode the benefit even when skill exists, and that a convincing five-year track record should be treated as necessary but not sufficient evidence before allocating capital.
Where the evidence gives active management a genuine foothold
The research is not uniformly negative. It identifies specific market segments where active management has historically shown better odds, and the distinction is worth understanding because it determines where your scepticism should be highest and where a more open evaluation is warranted.
Where active has historically shown more promise:
Mid and small-cap equities attract less analyst coverage, creating more scope for skilled stock pickers to find mispricings. Fixed income and credit markets are structurally complex; passive bond indices tend to overweight the largest, most indebted issuers, giving active managers room to improve risk-adjusted returns through duration, credit quality, and issuer selection decisions. Global real estate and listed infrastructure involve valuation complexity and regulatory variation that can reward fundamental analysis.
Where passive has the strongest case:
Large-cap Australian equities and broad global developed market equity are the most efficiently priced segments. Information is absorbed rapidly, and the fee hurdle for active managers is steepest.
Passive index mechanics create their own distortions: market-cap weighting channels each new dollar of inflow disproportionately toward stocks that have already appreciated, and at the scale Australian and global ETF markets have now reached, those flow dynamics are a measurable price-setting force in individual equities.
| Segments where active has historically shown promise | Segments where passive has the strongest case |
|---|---|
| Mid and small-cap equities | Large-cap Australian equities (e.g., S&P/ASX 200) |
| Domestic and global fixed income / credit | Broad global developed market equity |
| Global real estate and listed infrastructure | Core bond index categories in developed markets |
The proliferation of active corporate bond, cash-plus, and Core+ ETFs on the ASX, including products like VanEck’s Core+ diversified balanced active ETF and various fixed-term corporate bond ETFs, is not accidental. These segments genuinely lend themselves to active decision-making in ways that large-cap equity does not.
If you are considering an active ETF in large-cap Australian equities, the burden of proof is very high and the default should be scepticism. If the active ETF operates in small-cap credit or a specialised real asset segment, the research suggests a more open evaluation is warranted.
A five-question framework for evaluating any active ETF
The analysis so far gives you the evidence. This section gives you a tool you can apply in under ten minutes to any active ETF you encounter.
- Is this market segment less efficiently priced? Active strategies have a stronger evidence base in small caps, credit, and specialised real assets than in large-cap equity. If the ETF is repackaging core ASX 200 exposure at a higher fee, that is your first warning sign.
- Does the fee spread have a plausible performance basis? Compare the MER with a comparable passive option. A manager charging 0.50% versus a passive alternative at 0.15% needs to clear that 0.35% annual hurdle, every year, compounding. Ask whether the strategy’s process and track record make that plausible over a decade.
- Does the track record span a full market cycle? Two or three strong years can reflect style tailwinds or favourable conditions rather than genuine skill. Look for multi-cycle performance data, measured net of fees and against a clear benchmark.
- Are you prepared to monitor it? Active ETFs require ongoing oversight. Manager changes, mandate drift, and strategy tweaks can materially alter the risk and return profile. If you are not willing to stay engaged with those developments, a simple index ETF is operationally safer.
- Can you articulate what this adds that a passive fund cannot? If you cannot clearly describe the role, whether that is a small-cap tilt, credit diversification, or downside protection, and why an index fund cannot fill it, the extra complexity and cost are likely unjustified.
Simonelle Mody of Morningstar Australasia has noted that an investor who does not believe they possess an advantage in selecting fund managers may find a low-involvement passive approach practically and evidentially more appropriate. The exclusion of active ETFs from a portfolio can be a practical decision, not an ideological one.
“Does this active ETF have a good story?” is the wrong question. The right question is whether you can identify the specific structural advantage this manager has, in this segment, at this price, and whether you are prepared to monitor it.
What the listing boom signals, and what it should not decide for you
The active ETF surge on the ASX is real, and it is not going away. The performance evidence is sobering. Both things are true at the same time, and the reader’s job is to apply the framework rather than accept either the marketing narrative or the blanket rejection of active management.
Three positions emerge from the data:
- The listing trend is supply-driven as much as demand-driven. Roughly 55-60% of new ASX ETF listings being active reflects manager distribution strategy as much as investor appetite.
- Passive remains the evidential default for core equity. In a market of 458 ETFs and more than $350 billion in AUM, the Morningstar Active/Passive Barometer findings still point to low-cost index funds as the stronger starting point for large-cap Australian and broad global equity exposures.
- Active may be justified in specific segments with the right evaluation process. Small caps, credit, and specialised real assets are where the evidence gives active management its best case, but only where the investor has done the work of selection and commits to ongoing monitoring.
The proliferation of choice on the ASX does not itself create investor value. The five-question framework applied consistently will lead to better decisions than responding to marketing momentum, regardless of which direction the answers point.
For investors wanting broader context on the market dynamics behind the listing boom, our full explainer on the ASX ETF market’s structural acceleration covers the inflow data, trading volume trends, and thematic concentration patterns that are reshaping the product landscape alongside the active ETF surge.
This article is for informational purposes only and should not be considered financial advice. Investors should conduct their own research and consult with financial professionals before making investment decisions. Past performance does not guarantee future results. Financial projections are subject to market conditions and various risk factors.