VAS vs VHY: Why the Lower-Yield ETF Wins in Retirement
1 hr ago

In Q1 2026, Goldman Sachs beat analyst EPS estimates by more than a dollar per share. Its stock fell. JPMorgan posted a strong earnings surge. Its stock fell too. With 84% of S&P 500 companies beating estimates this season and blended earnings growth running at 27.7%, individual investors watching their portfolios gyrate are right to ask: if results are this strong, why does the market keep going down on good news?
Q1 2026 earnings season is in its final stretch, with roughly 89% of S&P 500 companies having reported as of early May 2026. The season has been historically strong by almost every fundamental measure, yet post-earnings price swings have been sharp, counterintuitive, and frequently punishing to investors who traded on headline numbers alone. The gap between reported results and stock reactions is not a glitch. It is how markets work, and understanding it is one of the most valuable skills a retail investor can develop.
This guide explains the mechanics behind post-earnings price moves, walks through how to read an earnings report step by step, and provides a practical framework for deciding what to do when a stock moves sharply after results, so the reader can respond to earnings with analysis rather than instinct.
Start with what most investors assume:
The actual mechanic is simpler and more useful: stock prices move on the difference between what was expected and what was delivered, combined with what the company signalled about its future.
The expectations gap mechanics that drive post-earnings price moves are more systematic than they appear: with 84% of S&P 500 companies beating estimates in Q1 2026, the market had already learned to anticipate beats, which reduces their power to generate incremental stock gains and explains why even a $1.08-per-share Goldman Sachs beat produced a negative price reaction.
According to J.P. Morgan Asset Management, the concept of earnings being “priced in” is the single most important framework for understanding why strong results do not automatically produce positive stock reactions.
Consider the Q1 2026 data. Blended EPS growth came in at 27.7% year-over-year, per FactSet’s 8 May 2026 update, the highest since Q4 2021. The 84% beat rate exceeded all major historical averages. Yet Goldman Sachs reported adjusted EPS of $17.55 versus a consensus estimate of $16.47 on 13 April 2026, a beat of $1.08 per share, and the stock fell. JPMorgan beat EPS estimates with a strong quarter, and the stock fell after the company cut its forward guidance.
FactSet’s 8 May 2026 Earnings Season Update confirms the 27.7% blended EPS growth figure and 84% beat rate that define this season’s historically strong fundamental backdrop, providing the granular sector-level data that underpins any honest comparison of Q1 2026 to prior cycles.
Two forces move a stock on earnings day simultaneously: the reported quarter’s numbers and the forward guidance signal embedded in the same release. When investors only watch the first, the second catches them off guard. That expectations gap is the foundational concept behind every section that follows.
Most press releases lead with the headline EPS number. That is not the order the market weights the information. Resequencing the read changes which signals a reader catches first.
Here is the process, ordered by what matters most for price-moving information:
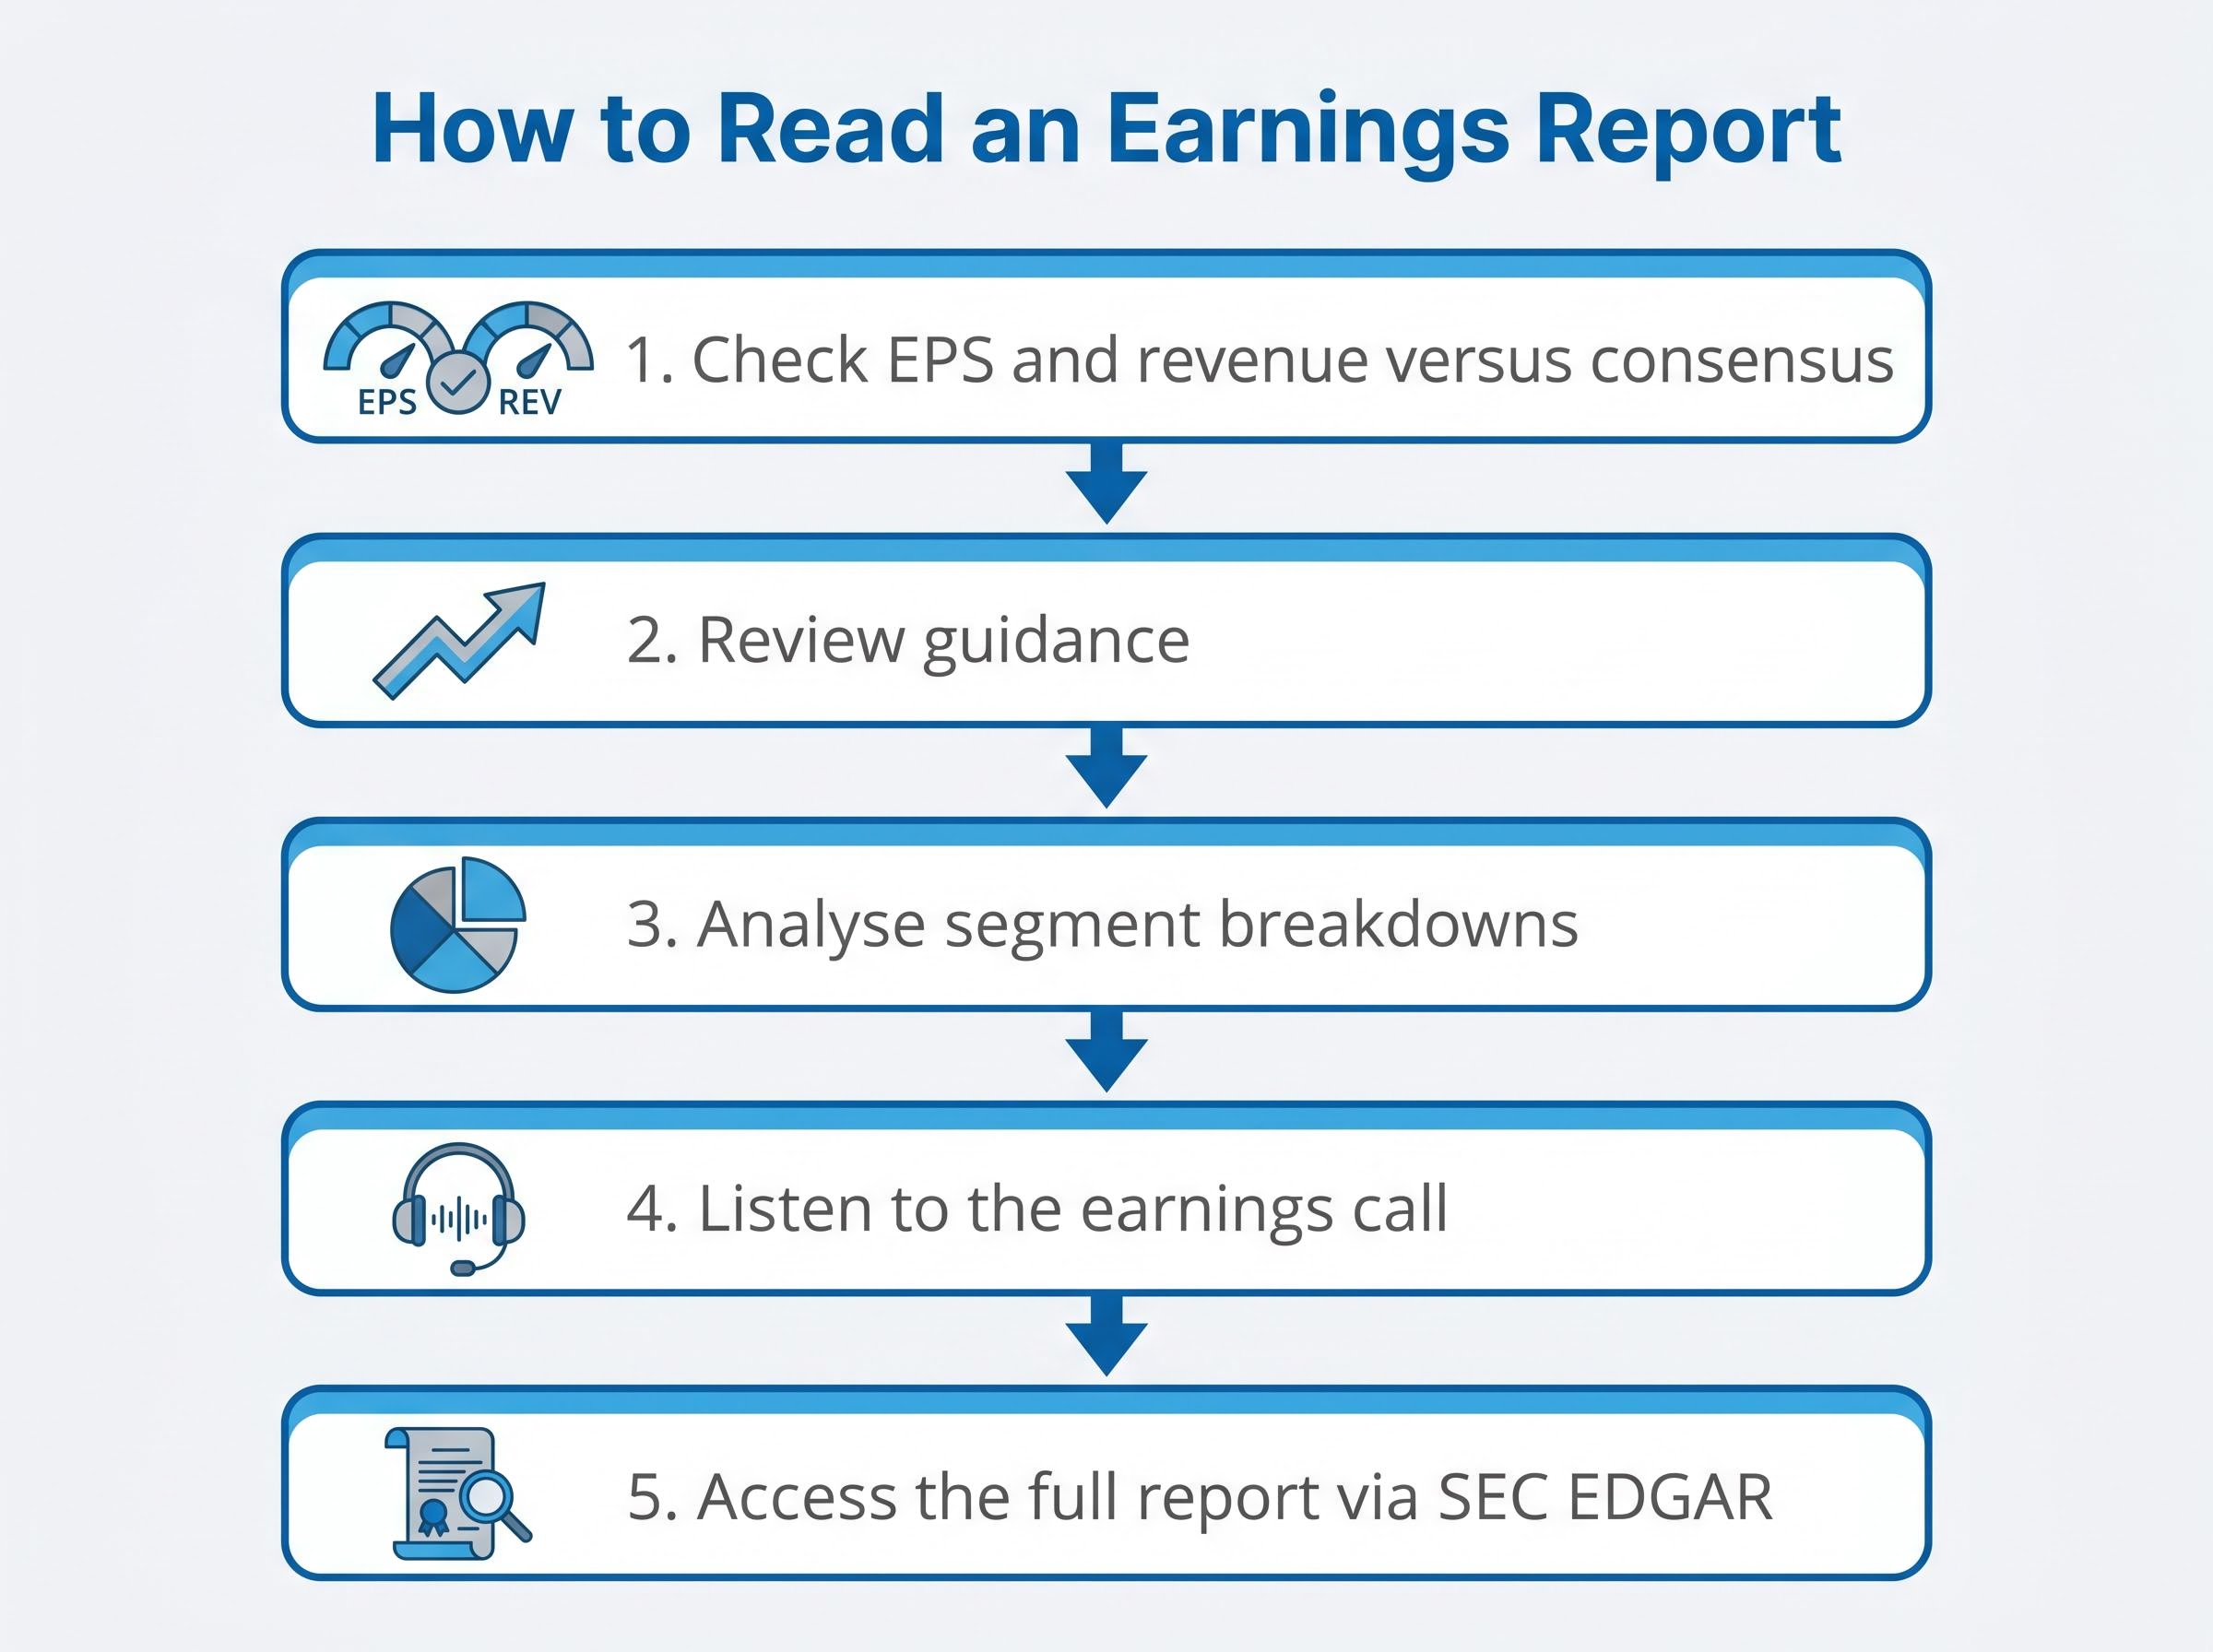
Earnings per share (EPS) represents net income divided by total outstanding shares. A “beat” means reported EPS exceeded the consensus analyst estimate; a “miss” means it fell short. Revenue, the total income from sales, is tracked separately, and the two metrics can tell different stories. Wells Fargo illustrates this directly: the bank posted a modest EPS beat ($1.60 versus a $1.58 estimate) but missed on revenue, producing a stock dip. Cost-cutting can boost EPS while the underlying revenue trajectory weakens, and relying on a single metric obscures that divergence.
FINRA’s guidance on financial performance metrics explains how EPS, revenue, and margin figures interact within a single earnings release, providing retail investors with a regulatory-backed framework for interpreting the same primary source documents available through SEC EDGAR.
Forward guidance projects future quarters or the full fiscal year. It is often the primary driver of a stock’s post-earnings reaction because markets are forward-looking instruments. When a company withdraws guidance, citing macro uncertainty, that reduced visibility tends to trigger disproportionate negative reactions, regardless of how strong the reported quarter was.
| Component | What It Measures | Why It Moves Stocks | Where to Find It |
|---|---|---|---|
| EPS | Net income per share | Beat/miss vs. consensus sets the initial reaction | Press release, 8-K filing |
| Revenue | Total sales income | Reveals demand trajectory; can contradict EPS signal | Press release, 8-K filing |
| Guidance | Management’s forward projections | Often the strongest price driver; signals confidence or uncertainty | Press release, earnings call |
| Segment data | Performance by business unit | Reveals hidden strength or weakness masked by aggregate numbers | 8-K filing, 10-Q |
| Earnings call | Management tone and qualitative outlook | Shapes sentiment on risks, macro headwinds, and strategic direction | Company IR page, transcripts |
Markets price the stream of future earnings, not the most recently reported quarter. That principle explains why JPMorgan fell on an EPS beat: the reported quarter looked backward, but the guidance cut looked forward, and forward is where the money goes.
Q1 2026 turned this principle into a season-wide pattern. Companies that withdrew or narrowed guidance, citing tariff uncertainty, produced some of the largest negative reactions of the quarter, even when their reported results beat estimates. JPMorgan characterised markets in April 2026 as being “on their toes,” with sentiment-driven volatility that was not always grounded in fundamental deterioration.
JPMorgan noted in April 2026 that markets were “on their toes,” producing sentiment-driven volatility not always grounded in fundamental deterioration. The firm estimated that tariff scenarios could shave mid-single digits off EPS growth, yet characterised underlying fundamentals as solid.
The pattern amounts to a “visibility gap.” Investors penalised uncertainty about the future more heavily than they rewarded past-quarter performance. Here is how the three guidance outcomes typically translated during Q1 2026:
A concrete rule of thumb emerges: when a stock drops sharply on an EPS beat, check the guidance section first. In Q1 2026, that single check would have explained most of the season’s counterintuitive moves.
These are not abstract psychological concepts. Each played out with identifiable consequences in Q1 2026:
The mechanism behind many of these errors is loss aversion: the psychological pain of watching a position decline exceeds the positive feeling from an equivalent gain, making exit feel rational even when the underlying business case has not changed.
Loss aversion during market volatility operates differently than most investors expect: the psychological pain of a declining position does not scale linearly with the size of the loss, which is why the same investor who held calmly through a 5% drawdown can make impulsive exit decisions during a 10% move even when the underlying business case has not changed.
The most effective defence against all four traps is pre-commitment. Before a company reports, establish decision rules: for example, commit to trimming the position if the company withdraws guidance, or commit to holding if the reported quarter beats and guidance is maintained.
Pre-commitment works because it removes the decision from the moment of maximum emotional noise. Fidelity’s investor guidance recommends allowing one to two weeks before acting when results are ambiguous, a deliberate buffer against reactive trading.
When a stock moves sharply after earnings, the instinct is to act immediately. The better approach is to match the stock’s situation to a decision framework drawn directly from the report itself.
Hold signals:
Trim signals:
Wait signals:
Citigroup offers a useful illustration. The bank reported EPS of $3.06 versus a consensus estimate of $2.65 on 14 April 2026, with revenue up approximately 14%. That was a clear beat. The stock’s reaction was muted, with no guidance-driven collapse. For an investor holding Citigroup, this was a hold-and-reassess scenario: the reported numbers supported the thesis, and the lack of a negative guidance signal removed the primary downside catalyst.
| Decision | When to Use It | Key Signals from the Report |
|---|---|---|
| Hold | Original investment thesis remains intact | Guidance maintained/raised; revenue stable; drop is macro-driven |
| Trim | Thesis partially changed or position overextended | Guidance reduced; margins compressing; pre-earnings run-up inflated valuation |
| Wait | Results ambiguous, market signal unclear | Management tone uncertain; price action noisy; allow 1-2 weeks for clarity |
A single earnings report is a snapshot. Evaluating trends across multiple quarters provides meaningfully more signal, and Q1 2026’s counterintuitive reactions do not negate its historically strong fundamentals.
The numbers in context: Q1 2026 marked the 11th consecutive quarter of year-over-year S&P 500 earnings growth, the 6th straight double-digit growth quarter, and, at 27.7% blended growth, potentially the strongest quarter since Q4 2021. Semiconductors posted approximately +95% EPS growth. The Magnificent 7 mega-cap technology names contributed approximately +23%. Even the weakest corner, the Retail Index at approximately +2.1% EPS growth, tells a story: sector divergence is itself an analytical signal, not noise.
Q1 2026 analyst forecast revisions tell a striking story about estimate accuracy: the blended 27.1% growth rate nearly doubled the 13.1% consensus forecast that analysts held at quarter-end, an aggregate surprise of 20.7% that was almost three times the five-year average, which means the market spent the entire reporting season absorbing a far larger earnings reality than it had priced.
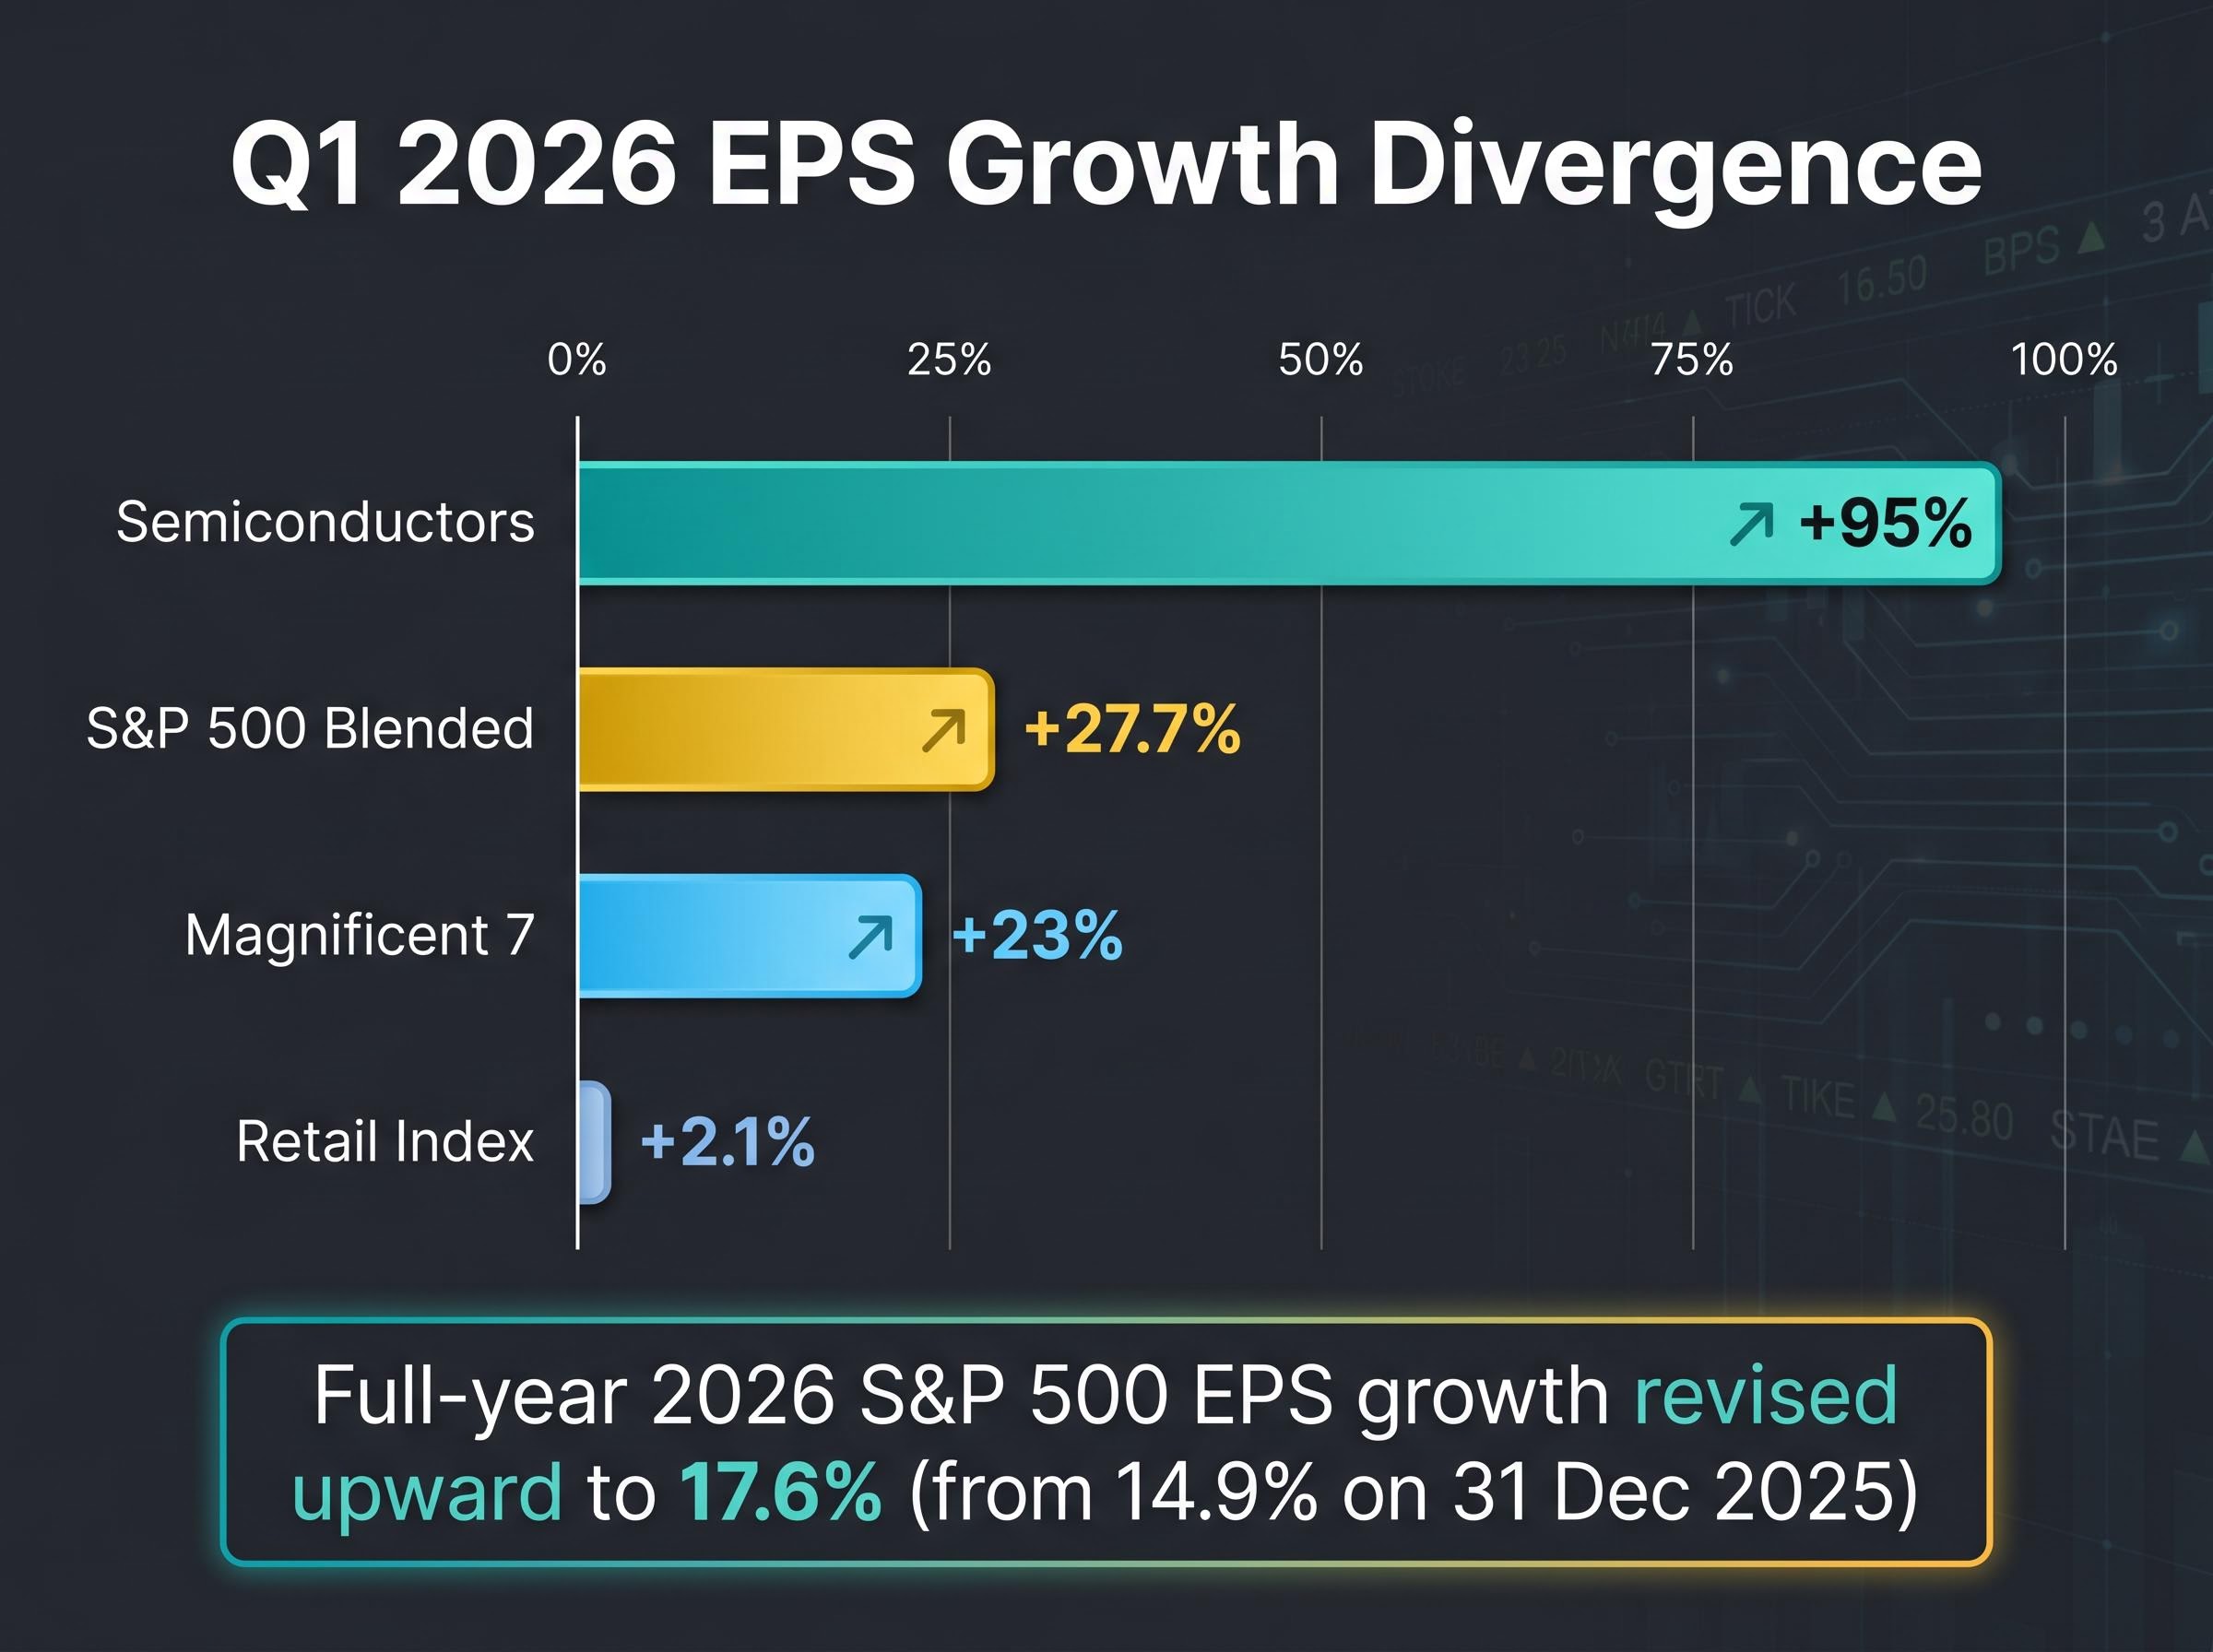
Full-year 2026 S&P 500 EPS growth has been revised upward to 17.6%, from 14.9% as of 31 December 2025, per JPMorgan and FactSet. The underlying earnings cycle remains intact despite intra-season volatility.
When reviewing any earnings report, four diagnostic questions cut through the noise:
The difference between the noise layer (short-term stock price volatility driven by macro sentiment and expectations resets) and the signal layer (actual changes to business trajectory) is what separates reactive trading from informed patience. Long-term investors who held through Q1 2026’s volatility while 84% of companies beat estimates were holding through a historically strong earnings season. The framework in this guide is designed to make that kind of informed patience achievable rather than accidental.
The barrier most retail investors cite for reactive decision-making is feeling like they are operating with incomplete information. That barrier is largely addressable with free or low-cost tools, organised here by function.
SEC EDGAR is the starting point. It provides complete 8-K earnings filings, quarterly reports (10-Q), and annual reports (10-K) for every publicly traded U.S. company, at no cost. This is the same primary source material institutional investors use.
FactSet Earnings Insight publishes weekly updates throughout earnings season covering blended growth, beat rates, sector breakdowns, and guidance trends. Free summaries are available through integrated platforms. It is the definitive reference for S&P 500 aggregate earnings data.
For pre-earnings positioning, LSEG/Refinitiv’s Lipper Alpha tracks preannouncement ratios (the 25 negative versus 16 positive preannouncements for Q1 2026 is a Lipper Alpha data point) and generates probability-weighted EPS surprise forecasts. Wall Street Horizon provides earnings calendars with confirmed-versus-unconfirmed dates and identifies peak volatility windows; the firm flagged 27 April through 15 May as the busiest 2026 window, with more than 2,500 companies reporting per week.
Seeking Alpha and Investing.com offer screeners for post-earnings anomalies, real-time alerts, and sector-level aggregation. FINRA investor education resources provide a recommended starting point for understanding earnings-related trading risks.
| Tool | Primary Use | Cost | Best For |
|---|---|---|---|
| FactSet Earnings Insight | S&P 500 blended growth, beat rates, sector data | Free summaries via platforms | Weekly season tracking |
| LSEG/Refinitiv Lipper Alpha | Preannouncement tracking, surprise modelling | Platform access; free previews | Pre-earnings positioning |
| SEC EDGAR | Full 8-K, 10-Q, and 10-K filings | Free | Primary source access |
| Wall Street Horizon | Earnings calendars, volatility window alerts | Subscription; free previews | Calendar and risk management |
| Seeking Alpha / Investing.com | Screeners, real-time alerts, sector aggregation | Free tiers available | Post-earnings anomaly screening |
The investor’s job is not to predict whether a stock will rise or fall after earnings. It is to evaluate whether the reported results change the investment thesis.
Q1 2026 made that distinction visible at scale: 89% of S&P 500 companies reported, blended EPS growth reached 27.7%, and 84% beat estimates, yet counterintuitive stock reactions driven by guidance uncertainty and macro noise dominated headlines. The investors who navigated the season without being whipsawed were not better predictors. They had a process: check guidance before headline EPS, evaluate multi-quarter trends over single-quarter snapshots, distinguish company-specific signals from macro noise, and make decisions based on pre-established rules rather than in-the-moment reactions.
The full-year 2026 EPS growth estimate of 17.6% provides a grounding reference for investors tempted to exit positions based on intra-season volatility alone. Q2 reporting begins in July 2026, offering a concrete window to build the habit of pre-earnings planning before the next cycle.
The full-year 2026 earnings outlook has been revised upward to 21.3% EPS growth, but a forward price-to-earnings ratio of approximately 19.8x leaves limited room for error if inflation forces the Federal Reserve to delay easing, which means the same guidance-sensitivity that defined Q1 reporting will likely remain the dominant market dynamic through Q2 and Q3.
Earnings season rewards process, not prediction. The question is never “will the stock go up after results?” The question is: “do these results change my reason for owning it?”
This article is for informational purposes only and should not be considered financial advice. Investors should conduct their own research and consult with financial professionals before making investment decisions. Past performance does not guarantee future results. Financial projections are subject to market conditions and various risk factors.
—
An earnings beat means a company reported higher earnings per share than analysts expected, but the stock can still fall if the result was already priced in or if the company issued weak forward guidance alongside the beat.
Start by comparing reported EPS and revenue against consensus estimates, then review forward guidance, analyse segment breakdowns for hidden weakness, and listen to the earnings call for management commentary on demand trends and macro conditions.
Markets price future earnings streams rather than past results, so guidance on upcoming quarters often drives a larger stock reaction than the reported figures, as seen in Q1 2026 when companies withdrawing guidance fell sharply even after beating estimates.
As of early May 2026, approximately 89% of S&P 500 companies had reported, with 84% beating EPS estimates and blended year-over-year earnings growth reaching 27.7%, the strongest rate since Q4 2021 according to FactSet.
Retail investors can use SEC EDGAR for free access to full 8-K, 10-Q, and 10-K filings, FactSet Earnings Insight for blended growth and beat rate data, and FINRA investor education resources for guidance on interpreting financial performance metrics.