Why Seeing Machines Trades Below 5p Despite EU Mandate Wins
7 hrs ago

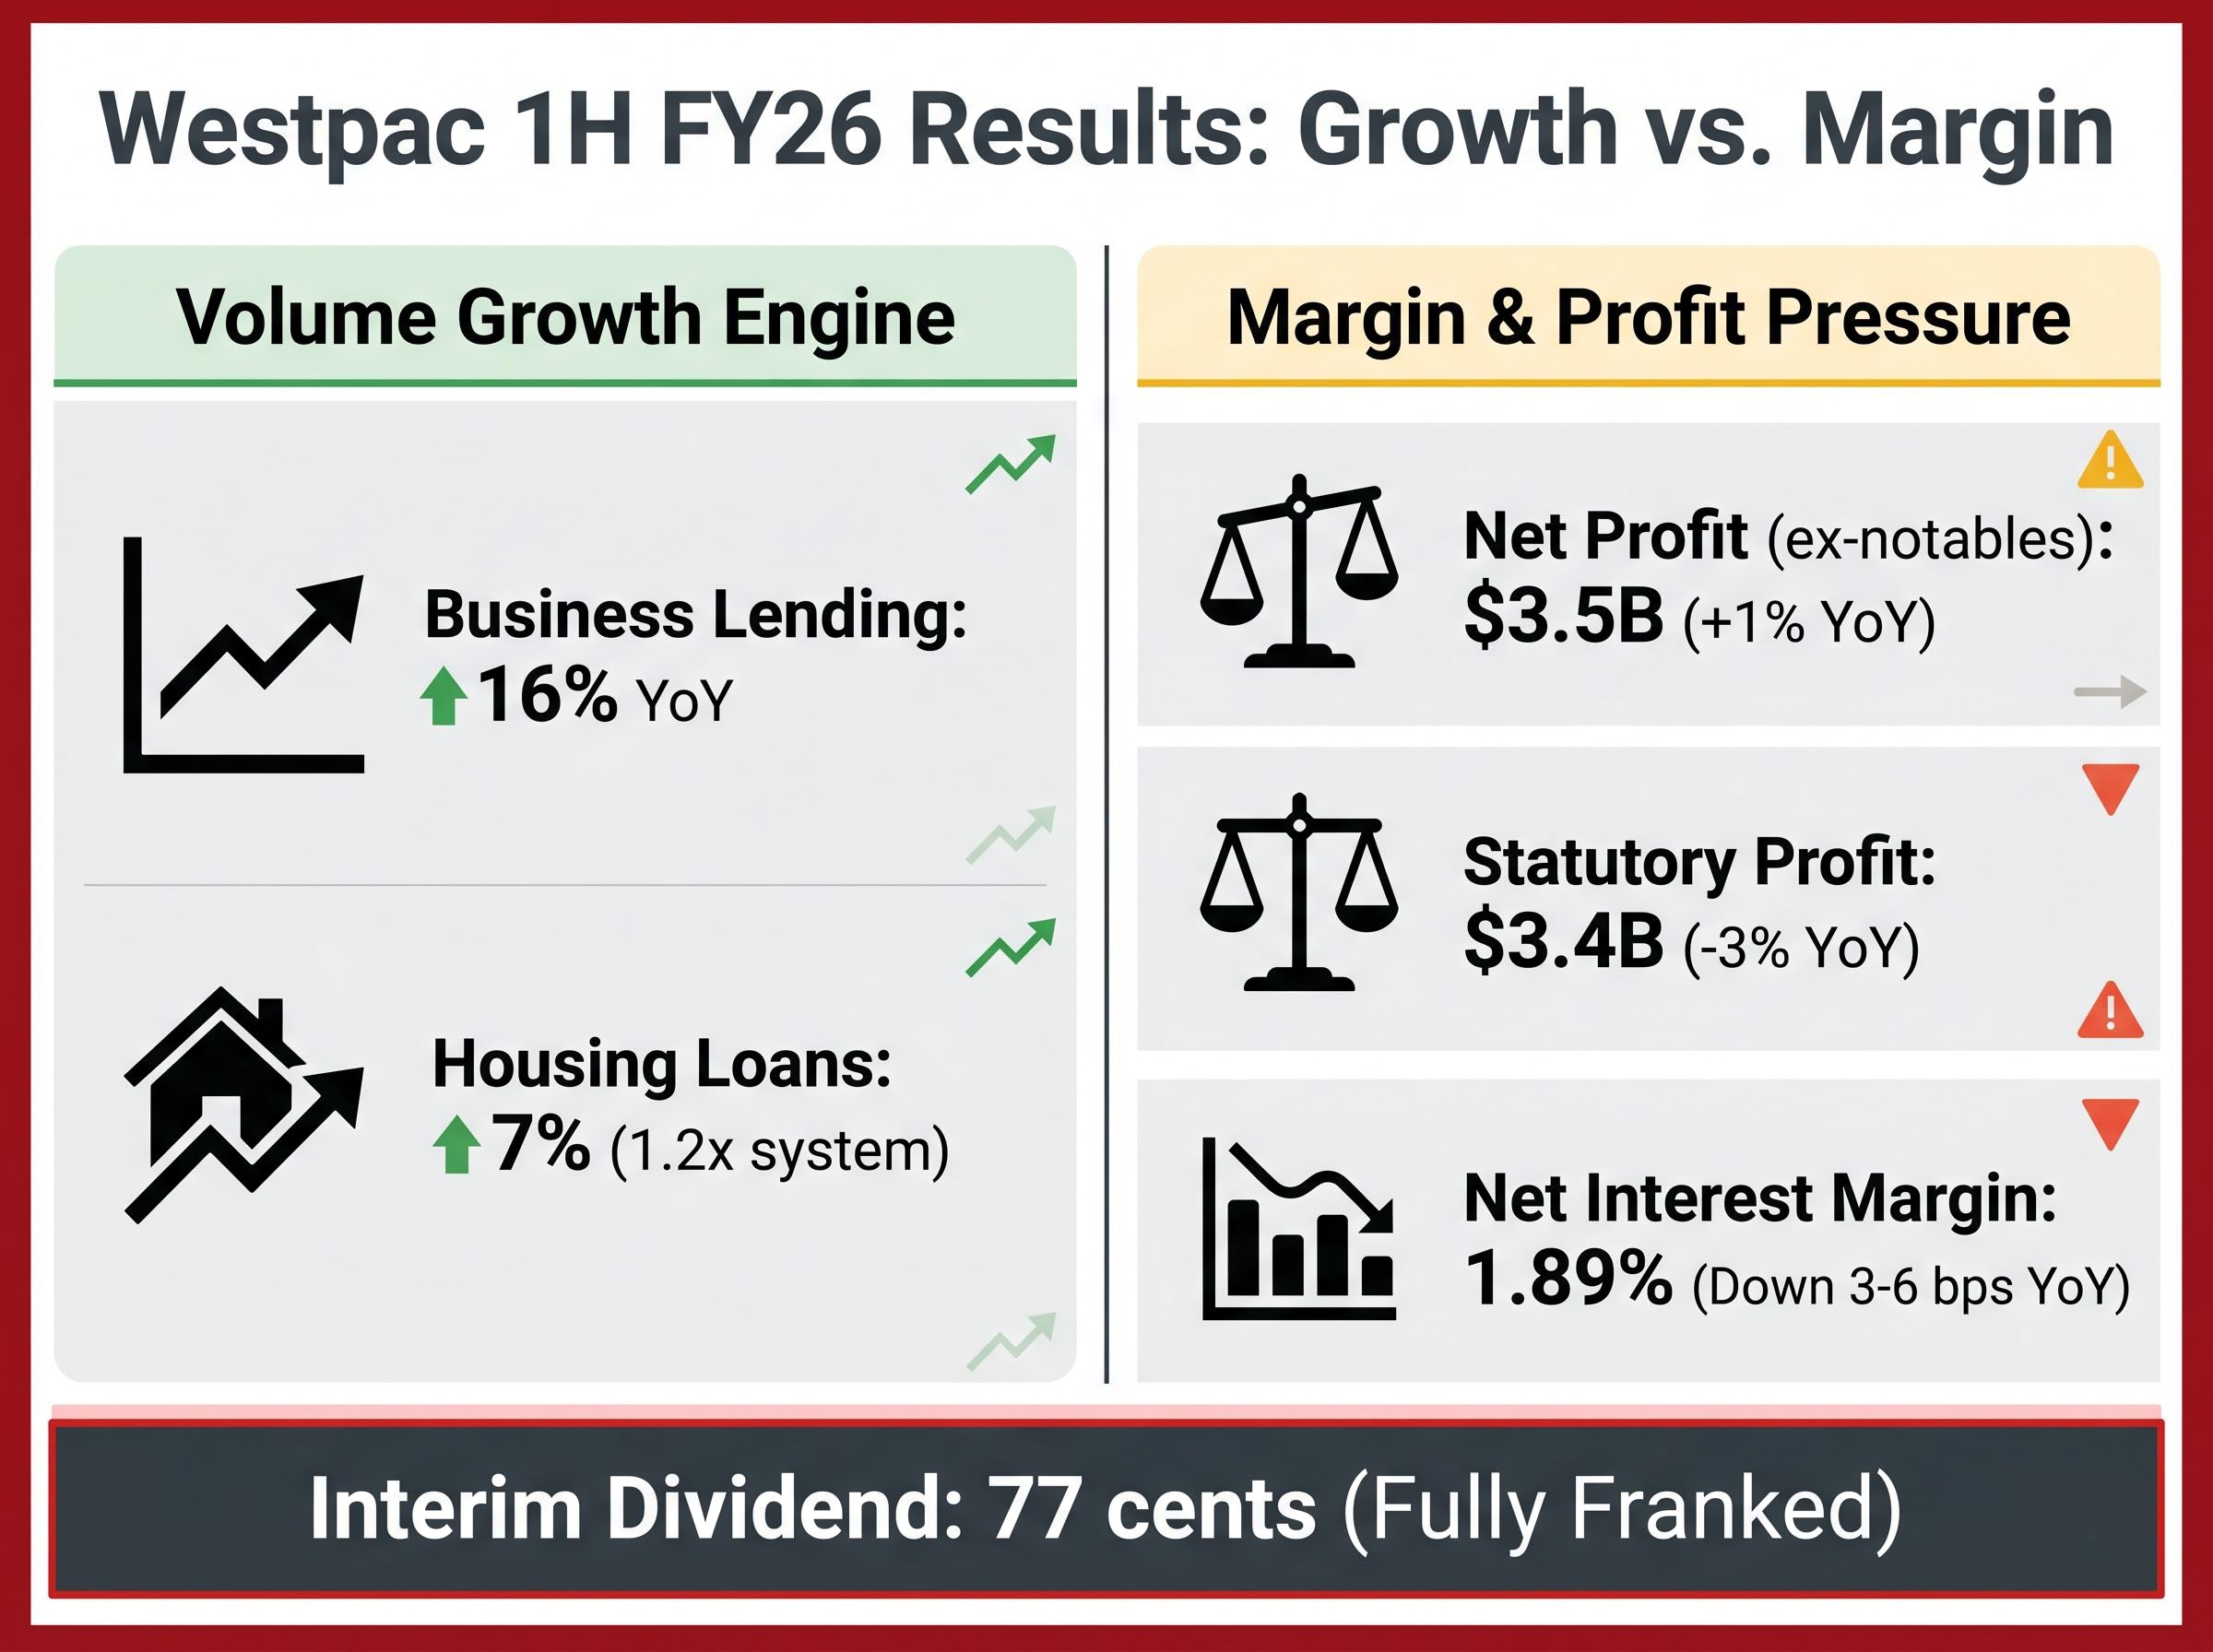
Westpac delivered its first-half FY26 results on 5 May 2026 with a headline that rewards a second reading: 16% business lending growth, 7% volume expansion across loans and deposits, and a net profit that still managed to slip. The stock is trading around $36 on the ASX, up 38% over five years, yet not a single broker on the CommSec consensus carries a buy rating. For Australian retail investors holding WBC, the question is no longer whether the bank is growing. It is whether the growth is translating into the kind of earnings trajectory that justifies the current price. What follows separates the lending momentum from the margin compression, explains why net interest margin is the number that connects these two stories, and provides a clear framework for the hold, add, or exit decision that May 2026 now demands.
The five headline metrics from Westpac’s half-year results tell a compressed version of a longer story:
A 1% decline in profit alongside 7% volume growth is not a contradiction. It is the signature of margin compression doing its work beneath a lending engine that is clearly producing.
That tension sits at the centre of the result. Westpac grew its loan book and deposit base at rates that comfortably exceeded system growth, yet the shrinking spread between what the bank earns on those assets and what it pays on those liabilities meant the additional volume could not fully offset the margin erosion.
The consensus miss on results day, when shares fell 2.26% to A$37.63 despite a nominally positive headline profit number, is a useful reminder that broker expectations rather than absolute earnings levels drive the immediate share price reaction; the gap between reported and expected earnings on 5 May 2026 explains much of the subsequent sell-down that has kept sentiment cautious.
The 51.7% cost-to-income ratio adds another layer. It represents the current efficiency benchmark against which management’s FY29 targets will be measured, a thread that runs through the rest of this analysis.
The number that deserved more airtime on 5 May was 16%: business lending growth, year-on-year. While mortgage growth of 7% (representing 1.2 times system growth) confirmed Westpac’s competitive position in housing, the business lending figure carries structurally different implications.
Business loans typically generate higher margins than residential mortgages. They also diversify revenue away from the housing cycle, which has historically dominated Australian bank earnings. The sectors driving the growth, agriculture, health, and professional services, represent segments with distinct demand drivers that do not move in lockstep with property prices.
Westpac’s mortgage book concentration sits at 69% of the loan portfolio, which means the 16% business lending growth reported this half is a genuine but still partial shift away from a balance sheet that remains heavily exposed to housing cycle dynamics and any deterioration in unemployment above 4.5%.
| Lending segment | Growth rate (1H FY26) | What it signals |
|---|---|---|
| Business lending | +16% YoY | Revenue diversification away from housing cycle dependence |
| Australian housing loans | +7% (1.2x system) | Competitive mortgage positioning maintained |
| Deposits | +7% | Funding base expanding in line with asset growth |
The rising share of proprietary channel originations, now approximately 59% of new business, matters because it reduces the bank’s reliance on mortgage brokers and the commissions they carry. Each percentage point shift from broker to proprietary channels retains more of the lending margin within Westpac’s income statement. In a period of NIM compression, this channel shift is one of the few levers management can pull to slow the margin decline from within.
Net interest margin is the single metric that explains how a bank can grow its loan book and still report lower profits. It measures the difference between what a bank earns on its loans and investments and what it pays depositors and other funders, expressed as a percentage of its interest-earning assets.
The mechanism works in three steps:
Westpac’s NIM of 1.89%, down 3-6 basis points year-on-year, means that for every $100 of interest-earning assets, the bank is retaining roughly $1.89 in net interest income, and that figure is shrinking.
The RBA’s third 25 basis point hike of 2026, announced on 5 May and lifting the cash rate to 4.35%, complicates the picture further. Rate hikes create a timing mismatch: deposit rates tend to reprice upward faster than loan rates adjust, compressing the spread. This is why Westpac reported healthy volume growth and a declining margin simultaneously. The bank is writing more business, but each dollar of that business is generating slightly less income than it did a year ago.
The RBA’s May 2026 cash rate decision confirmed the 25 basis point increase to 4.35%, a move that directly intensifies the deposit repricing dynamic that has been squeezing bank margins throughout the current tightening cycle.
The next RBA decision is scheduled for 16 June 2026, and the direction of that decision will influence whether NIM pressure persists or begins to stabilise across the Australian banking sector.
Management has set two headline targets for FY29: a cost-to-income ratio below the peer group average, and a return on tangible equity (ROTE) above the peer group average. Both are framed in relative rather than absolute terms.
The current scorecard sits as follows:
The gap between current performance and these targets is real but difficult to quantify precisely. Peer comparison data for CBA, NAB, and ANZ on 1H FY26 metrics is not yet publicly available, which means the finish line itself remains undefined.
Relative targets introduce a layer of ambiguity that absolute targets do not carry. If Westpac reduces its cost-to-income ratio by 200 basis points over the next three years but its peers reduce theirs by more, the target is missed regardless of genuine operational improvement. The reverse is also true: peer deterioration could deliver Westpac a target hit without meaningful internal progress.
This ambiguity may partly explain the caution visible in broker consensus. Analysts are being asked to price in execution against a benchmark that will only become clear as peer results accumulate over the next several reporting cycles. Shareholders evaluating the FY29 targets should recognise that the current valuation partly reflects an assumption that these goals are achievable, and that any stall in cost discipline or ROTE progression would challenge that assumption.
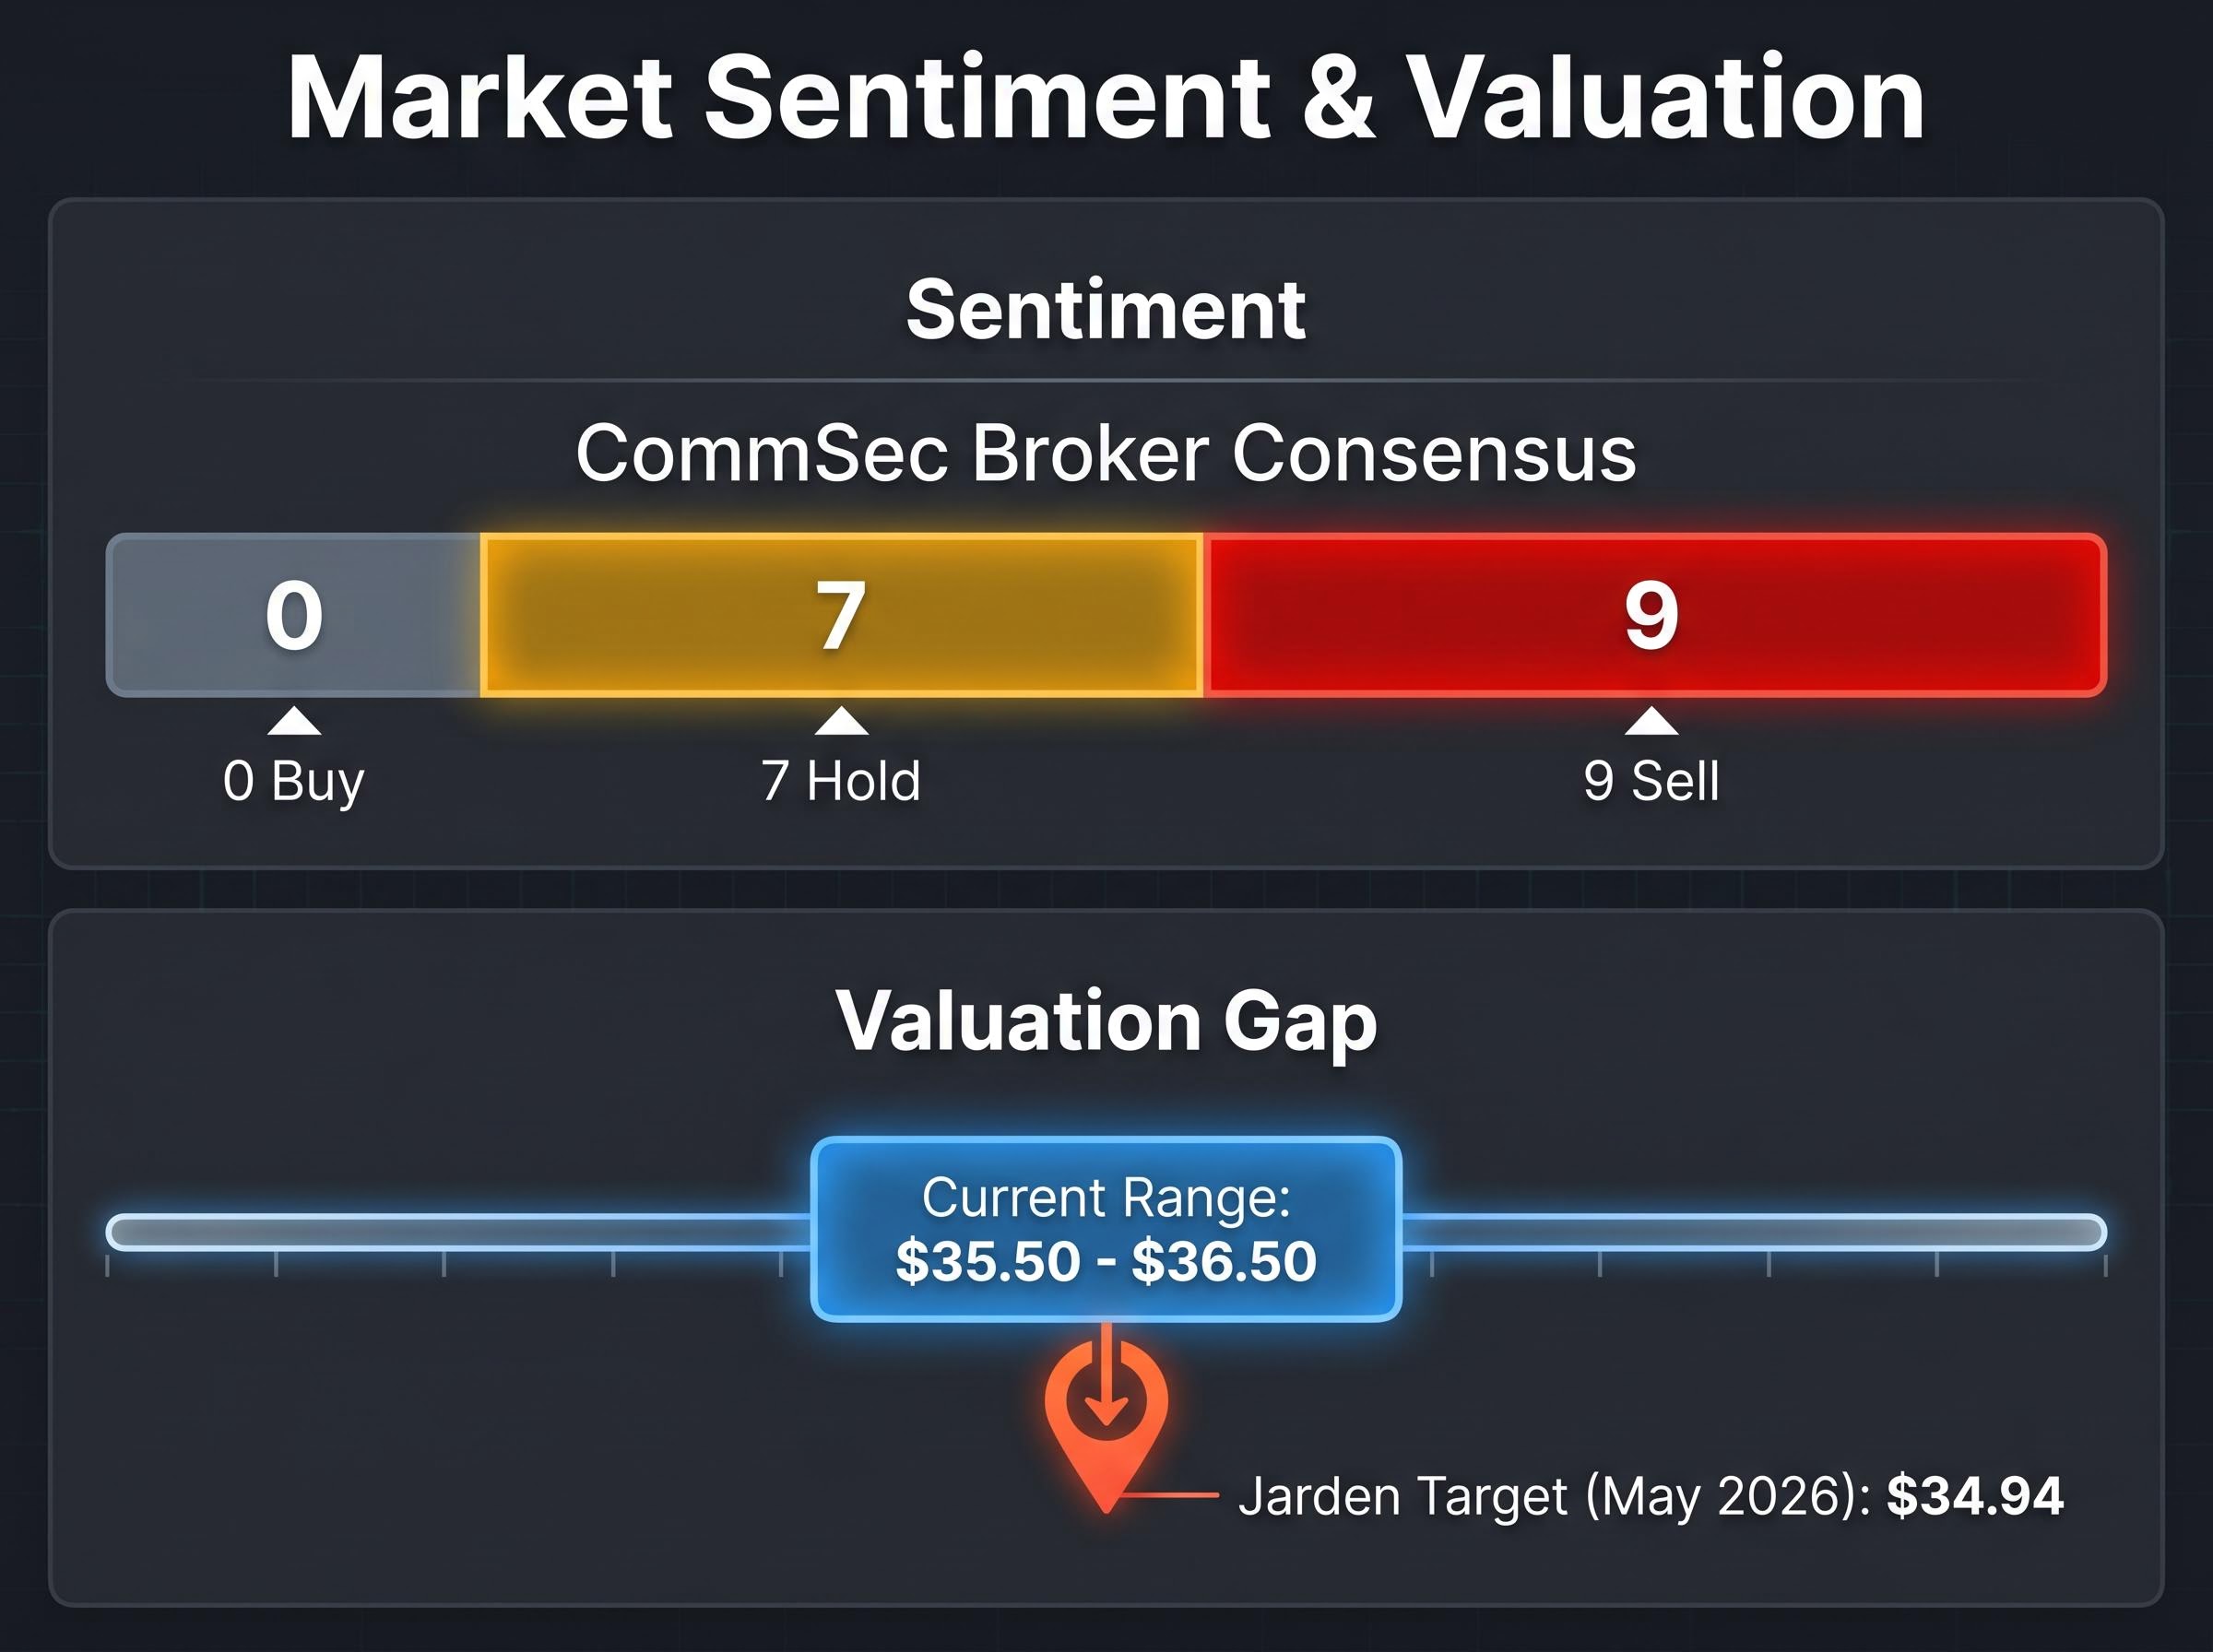
Zero buy ratings. Across the CommSec consensus, not a single broker currently recommends buying Westpac shares.
The full breakdown is stark:
| Rating | Number of brokers |
|---|---|
| Buy | 0 |
| Hold | 7 |
| Sell | 9 |
The consensus label is Moderate Sell. Jarden maintained a sell rating in early May 2026 with a price target of $34.94, sitting below the current trading range of approximately $35.50-$36.50.
The sector-wide margin pressure that drove ASX bank shares down between 7% and 14% during May 2026 reporting season confirms that Westpac’s NIM compression is not a company-specific problem; NAB recorded the steepest decline at roughly 14% for the month as deposit competition and refinancing pressure compressed margins from both sides across all four majors.
The 38% price appreciation over five years provides context for that consensus. An investor who deployed $10,000 into WBC in May 2021 acquired approximately 389 shares. The same $10,000 today buys roughly 281 shares. The stock’s higher base compresses the forward return potential from current levels and means each additional dollar of capital deployed carries a different risk profile than it did at lower prices.
For existing shareholders, the calculus is specific to cost basis. A holder who bought at $26 has banked significant unrealised gains and faces a different question than someone who added at $34. The broker consensus suggests that from current prices, the balance of risk and reward tilts toward caution rather than further accumulation.
Investors wanting to stress-test the broker consensus figures against a broader valuation framework will find our full explainer on ASX bank stock valuation covers the specific reasons why PE ratios can mislead in a rate-cycle environment, including how NIM trajectory, regulatory fee compression, and existing index concentration through products like VAS interact to produce outcomes that a single earnings multiple does not capture.
This article is for informational purposes only and should not be considered financial advice. Investors should conduct their own research and consult with financial professionals before making investment decisions.
The competing signals are genuine, and neither resolves neatly in favour of the other. On one side: 16% business lending growth, 7% volume expansion, a fully franked 77 cent dividend, and a proprietary channel strategy that is gaining traction. On the other: a 1% profit decline, NIM compression, zero buy ratings, and a 38% five-year run that has priced in much of the recovery.
Factors supporting a hold:
Factors supporting reducing exposure:
The next catalyst arrives on 16 June 2026 with the RBA’s scheduled rate decision. A further hike would intensify the NIM headwind across Australian banks; a hold would offer the sector a window for margin stabilisation. Neither outcome changes the structural question Westpac faces, but the rate path will shape the speed at which the answer arrives.
Past performance does not guarantee future results. Financial projections are subject to market conditions and various risk factors.
Net interest margin (NIM) is the difference between what a bank earns on its loans and what it pays depositors, expressed as a percentage of interest-earning assets. Westpac's NIM fell to 1.89% in 1H FY26, meaning margin compression is offsetting the bank's strong volume growth and limiting profit improvement.
Westpac reported a statutory net profit of $3.4 billion (down 3% year-on-year), business lending growth of 16%, total lending and deposit volume growth of 7%, a cost-to-income ratio of 51.7%, and an interim fully franked dividend of 77 cents per share.
Across the CommSec consensus, nine brokers rate Westpac a sell and seven rate it a hold, with the overall label being Moderate Sell. Analysts cite NIM compression, a 38% five-year price appreciation that limits forward return potential, and FY29 targets framed in relative rather than absolute terms as key reasons for caution.
When the RBA raises rates, deposit funding costs tend to reprice upward faster than loan rates adjust, compressing the spread between what Westpac earns and what it pays. The RBA's May 2026 hike to 4.35% intensified this dynamic, and the next scheduled decision on 16 June 2026 could extend or begin to ease that pressure.
Westpac is targeting a cost-to-income ratio and a return on tangible equity (ROTE) that both beat the peer group average by FY29, starting from a current ROTE of approximately 11% and a cost-to-income ratio of 51.7%. Because these targets are defined relative to peers rather than as fixed numbers, execution risk is amplified: Westpac could improve meaningfully and still miss if competitors improve by more.