How Listed Property Funds Managers Actually Make Money
53 mins ago

In May 2026, a Dividend Discount Model applied to Westpac shares can produce an implied value anywhere between $17.89 and $80.50, depending on the assumptions fed into it. That extraordinary range is not a flaw in the model. It is the model revealing something important about what it cannot do.
Price-to-earnings ratios and dividend discount models give ASX bank investors a useful numerical starting point, but Australian banking is structurally complex: an oligopoly heavily exposed to residential property, subject to active regulatory oversight from APRA and the RBA, and shaped by management cultures that the Global Financial Crisis demonstrated can matter as much as any balance sheet figure. Numbers derived from recent benign credit cycles can embed assumptions about property prices, unemployment, and loss rates that may not hold under stress. This piece explains the qualitative and macroeconomic factors that quantitative valuation models for Australian bank shares cannot capture, and shows investors how to incorporate them into a more complete assessment. By the end, readers will have a practical framework for moving beyond the numbers when evaluating institutions such as Westpac, CBA, NAB, and their peers.
PE ratios and dividend discount models are legitimate tools. Applied to Westpac’s FY24 earnings per share of $1.92, a PE-based valuation using the sector average multiple of 18x produces an implied value of $34.34, compared with a prevailing share price of $35.89 at the time of analysis. That is a reasonable, defensible starting point for a conversation about value.
The DDM tells a similar story at its midpoint: a central estimate of $35.10, or $48.64 when adjusted for franking credits. But the model’s full output range tells a different story entirely.
The PE and DDM methods each anchor to earnings and dividends as the primary outputs of bank value creation, but applying them to CBA illustrates how acutely output ranges depend on input assumptions: a DDM sensitivity table for CBA spans from approximately $52.89 to $238.00 across reasonable growth and discount rate combinations, a spread that makes Westpac’s $17.89 to $80.50 range look comparatively narrow.
A Dividend Discount Model applied to Westpac’s FY24 financials produces valuations ranging from $17.89 (using an 11% discount rate and 2% growth assumption) to $80.50 (using a 6% discount rate and 4% growth assumption). The gap is not noise. It is the model exposing the sensitivity of its own assumptions.

That spread exists because the model’s output is almost entirely determined by three input variables, each of which is a qualitative judgement disguised as a number:
An investor who treats a single DDM output as an answer is effectively hiding these assumptions rather than examining them. The model’s wide range is an invitation to do the qualitative work that follows.
Australia’s Big Four banks operate within one of the most concentrated banking systems in the developed world. That concentration produces durable competitive advantages. Repeated attempts by large international institutions, including HSBC, to gain meaningful market share in Australian retail and business banking have achieved minimal success, reinforcing the structural durability of incumbent franchises.
Morningstar’s December 2024 update characterised Westpac as holding a “wide moat” based on its funding scale and deposit franchise advantages. That assessment reflects a broader reality: the Big Four benefit from economics that are difficult to replicate.
The oligopoly delivers clear advantages:
It also generates risks that standard valuation ratios do not capture:
Commentary from CPA Australia and Finsia (published across 2024-2025) highlights this dual nature explicitly: the same structure that produces stable earnings and strong pricing power also exposes banks to political backlash and the risk that management under-invests in systems or misprices risk. Investors need to hold both parts of this picture simultaneously. A PE ratio captures the earnings the oligopoly produces. It does not capture the specific risks that the oligopoly creates.
Management quality for a bank is not an abstraction. It is observable in specific, measurable outcomes: risk culture, incentive structures, technology execution timelines, compliance track records, and the willingness of boards to challenge internal model outputs rather than ratify them.
Westpac’s trajectory since 2019 makes this concrete. The AUSTRAC anti-money-laundering and counter-terrorism financing breaches triggered remediation spending that weighed directly on efficiency ratios for years. As of March 2025, fund managers at Perpetual and Pendal continued to characterise Westpac as a “repair story,” still working through the operational and cultural legacy of those failures.
APRA’s June 2024 information paper, “Risk Culture: Transformation into Action,” confirmed that risk mindsets in frontline decision-making remain an ongoing concern across major authorised deposit-taking institutions. The regulator drew explicitly on both GFC and royal commission experiences to stress that institutional failures were governance and culture failures as much as model failures.
The contrast with CBA is instructive. Where Westpac is positioned as a turnaround candidate, CBA is broadly framed as a quality compounder. Morningstar’s December 2024 assessment rated Westpac slightly behind CBA in execution quality, despite both holding “wide moat” designations. That gap in management perception translates directly into the premium or discount investors apply to each institution’s earnings.
Westpac’s FY24 strategy of portfolio simplification, exiting non-core wealth and institutional exposures, represents a positive risk-reduction step. It also concentrates the earnings base more heavily in domestic retail and business banking, limiting non-interest income upside and increasing sensitivity to Australian credit conditions.
Investors do not need insider access to assess management quality. Several publicly available sources provide meaningful signal:
These are not soft considerations layered on top of a valuation. They are the inputs that determine what multiple the market is willing to pay for each dollar of bank earnings.
Australian major bank loan books are structurally concentrated in residential mortgages. That concentration means two macroeconomic variables dominate credit quality outcomes: property prices and unemployment. Understanding why they matter, and which matters more, is the mechanism that connects macro conditions to bank earnings.
The logic is direct. Property prices determine the collateral value underpinning the mortgage book. When prices fall, loss-given-default rises because recoveries on distressed sales are lower. Unemployment determines the probability of default itself: borrowers who lose their jobs are the ones who miss payments.
The RBA has been explicit about the hierarchy. Financial stability commentary across 2024 and 2025 identifies the connection between labour market outcomes and arrears as “the single most important swing factor” for bank credit quality.
The RBA has repeatedly identified a sharp rise in unemployment as the primary trigger for materially higher mortgage arrears, more consequential than property price movements in isolation.
| Variable | Current Status (2025-2026) | Direction of Travel | Implication for Bank Credit Quality |
|---|---|---|---|
| Residential property prices | National dwelling values rising at a slower pace; Perth and Brisbane strong, Melbourne softer (CoreLogic HVI) | Growth moderating; supply constraints providing a floor | Collateral values supported but upside limited; regional divergence creates pockets of risk |
| Unemployment | Mid-3% to low-4% range (ABS Labour Force data) | RBA projects drift toward mid-4% | Contained at current levels; a sharp rise would be the primary catalyst for higher arrears |
| Housing loan arrears (90-day-plus) | Around or below 1% (APRA quarterly ADI statistics) | Drifting gradually higher from very low levels | Manageable under base case; tail risk concentrated in outer-suburban, highly indebted cohorts |
Digital Finance Analytics’ 2025 estimates show rising household mortgage stress, particularly in outer-suburban markets, consistent with the RBA’s observation that many borrowers have adapted to higher rates through reduced discretionary spending. The official arrears figure remains below 1%, but that number is a snapshot of a specific macro environment. It is not a structural feature of the loan book.
Deteriorating credit quality beneath headline profit is already visible in real-time results data: CBA’s Q3 2026 disclosure showed personal loan arrears spiking 30 basis points in a single quarter and a $200 million collective provision top-up, translating directly the macro trajectory the RBA’s unemployment projections implied into observable bank-level credit outcomes.
The GFC’s relevance to Australian bank valuation in 2026 is not historical. It is diagnostic. The specific ways that quantitative models failed in 2008-2009 map directly onto the assumptions embedded in any bank valuation model built today.
Three model failure modes from the GFC remain directly applicable:
ASX Investor Update commentary (2024-2025) noted that high dividend yields heading into a downturn can become a value trap if capital adequacy and loan-loss risks are underweighted in the investment case.
The lesson is not that models are useless. It is that models require qualitative conditioning. Governance, funding structure, capital adequacy, and incentive design are the buffers against scenarios that quantitative outputs cannot anticipate.
On the positive side of the ledger, APRA’s “unquestionably strong” capital framework (implemented January 2023) has produced Common Equity Tier 1 ratios well above pre-crisis levels. APRA stress tests conducted across 2023-2024 confirm that major banks remain above minimum capital requirements even in severe adverse scenarios involving sharp property price falls combined with higher unemployment. The system is more resilient. But resilience is not immunity: under those same stress scenarios, earnings and dividends would be substantially impaired.
CET1 ratio and loan book dynamics interact in ways that stress the resilience argument: CBA’s Q3 FY2026 Pillar 3 disclosure showed risk-weighted assets growing 2.4% in a single quarter as commercial and residential mortgage portfolios expanded, meaning the capital buffer above APRA’s minimum was being consumed by loan book growth even before any provision deterioration scenario was applied.
The preceding sections cover distinct analytical domains, but they share a common function: each one conditions or challenges the assumptions embedded inside a PE ratio or DDM. The qualitative work is not an add-on to quantitative valuation. It is the process that makes quantitative inputs defensible.
Westpac’s FY24 simplification strategy illustrates the point. The exit of non-core wealth and institutional businesses de-risks the portfolio, but it also concentrates income more heavily in Australian and New Zealand retail and business banking, making the earnings base more sensitive to domestic credit conditions. UBS and Citi commentary from late 2024 to early 2025 highlights structural fee income pressure from no-fee transaction models and reduced wealth-management economics across the Big Four. These are qualitative realities that a headline PE does not reflect.
APRA’s capital adequacy framework and CET1 ratios above “unquestionably strong” benchmarks represent a genuine valuation-supportive factor, not merely a regulatory technicality. Meanwhile, the Council of Financial Regulators (comprising the RBA, APRA, ASIC, and Treasury) identified cyber risk and operational resilience as increasingly prominent qualitative risks in its 2024-2025 quarterly statements.
Before trusting the output of any quantitative bank valuation model, assess each of the following:
For investors wanting to apply the same qualitative discipline to a different major bank, our dedicated guide to the NAB qualitative framework covers the seven dimensions — including management credibility, loan-book quality, and net interest margin durability — that determine whether NAB’s reported earnings will hold up over time, along with a worked example of why sourcing the strongest bearish analyst thesis before committing capital is a core investment discipline.
APRA Prudential Standard APS 110 sets the minimum capital adequacy requirements for authorised deposit-taking institutions, including the CET1 benchmarks that define what qualifies as unquestionably strong capital, and it is these thresholds that APRA stress tests use to determine whether major banks remain adequately capitalised under severe adverse scenarios.
PE ratios and dividend discount models remain useful tools. They are not discredited by their limitations; they are incomplete without the qualitative framework that makes their assumptions visible and testable.
Westpac’s FY24 earnings per share of $1.92 and dividend per share of $1.66 support a valuation range from under $18 to over $80 depending on the growth, discount, and loss-rate assumptions an investor chooses. The qualitative checklist does not replace that calculation. It is the mechanism that tells the investor which end of the range is more defensible.
In the current environment, with the RBA projecting unemployment drifting toward the mid-4% range, arrears on a gradual upward trend, and property price growth moderating, the qualitative inputs are becoming more consequential. The benign macro conditions that underpinned recent low loss rates are shifting, and the assumptions embedded in backward-looking models are shifting with them.
A benign arrears figure is a snapshot of a specific macro environment. It is not a structural feature of the loan book.
The investor who masters both the numbers and the qualitative framework around them is doing something categorically different from the investor who relies on either alone. For ASX bank shares, the model provides the starting point. The qualitative work determines whether that starting point leads somewhere defensible.
This article is for informational purposes only and should not be considered financial advice. Investors should conduct their own research and consult with financial professionals before making investment decisions. Past performance does not guarantee future results. Financial projections are subject to market conditions and various risk factors.
A Dividend Discount Model (DDM) estimates a share's intrinsic value by discounting expected future dividends back to present value using a required rate of return. Applied to Westpac's FY24 financials, the DDM produces a central estimate of around $35.10, but the full output range spans $17.89 to $80.50 depending on the growth and discount rate assumptions used.
PE ratios and DDMs anchor to recent earnings and dividends, which reflect a specific macro environment and can embed assumptions about property prices, unemployment, and loss rates that may not hold under stress. They also cannot capture qualitative factors such as management quality, regulatory risk, and risk culture, all of which directly influence the multiple the market is willing to pay.
Property prices determine the collateral value underpinning mortgage books, affecting loss-given-default in a downturn, while unemployment drives the probability of default itself. The RBA has identified a sharp rise in unemployment as the single most important trigger for materially higher mortgage arrears, making these two variables the primary macro inputs for Australian bank credit quality.
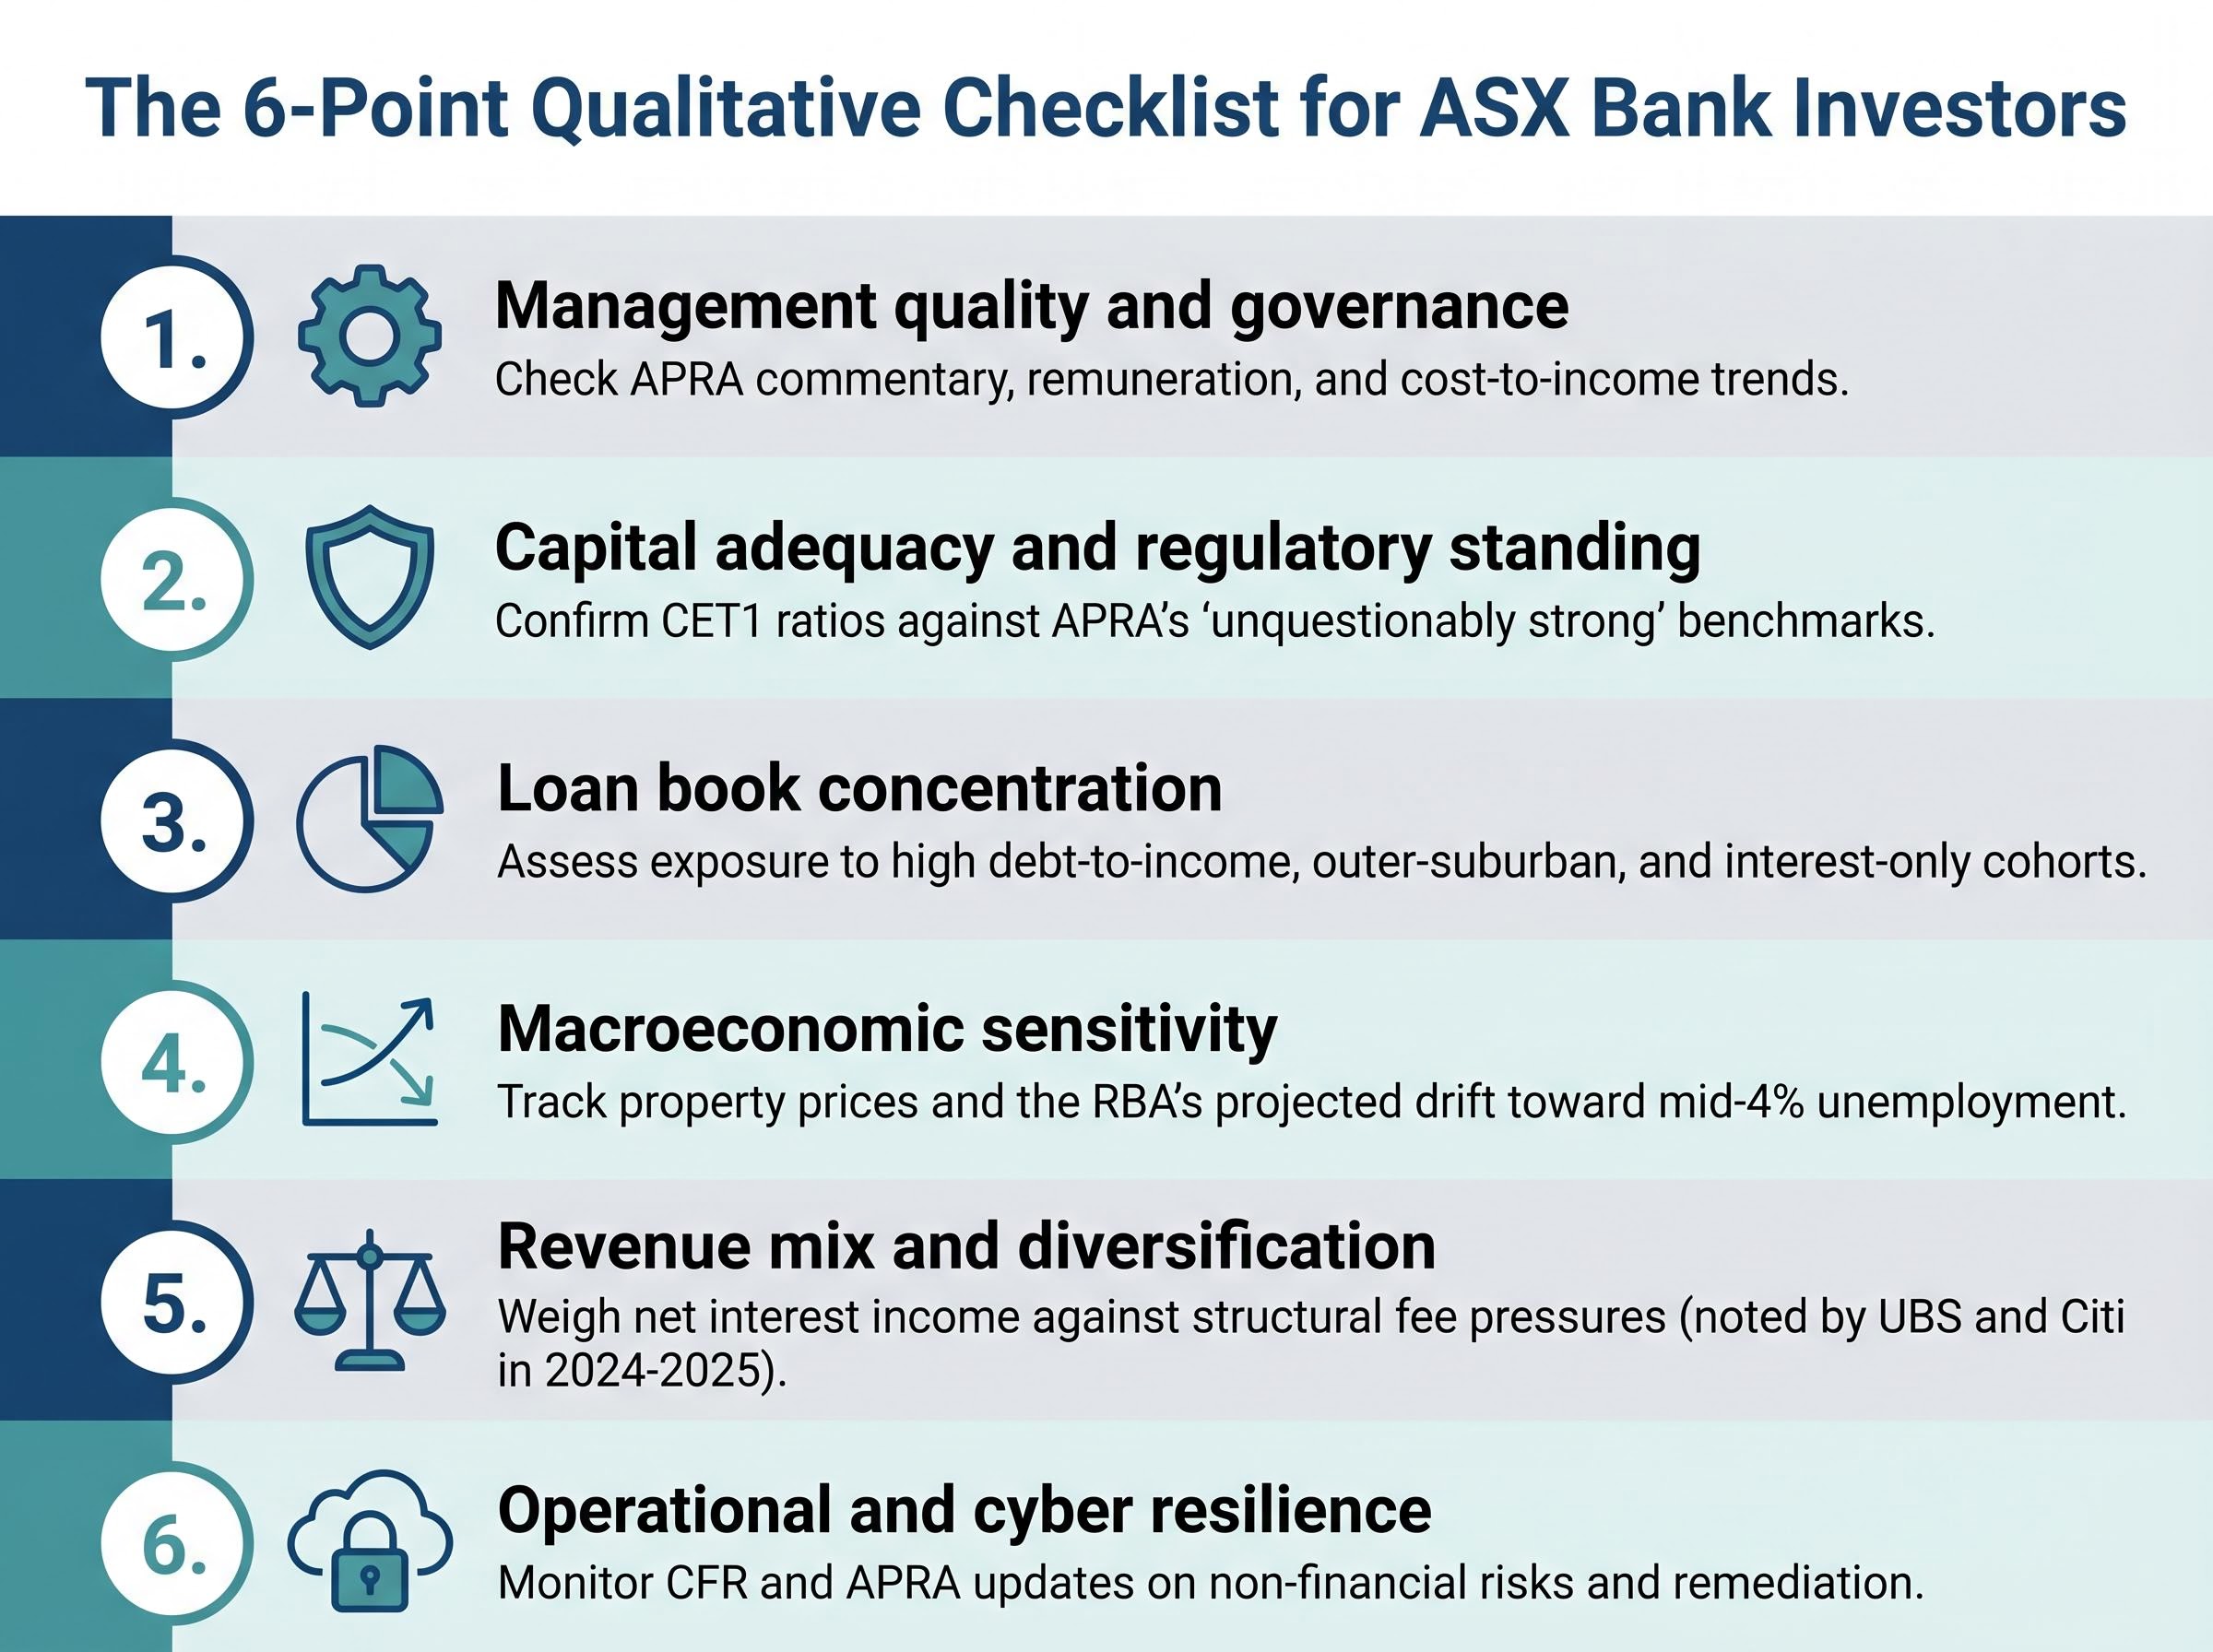
Investors should assess management quality and governance through APRA commentary and remuneration reports, confirm CET1 capital ratios relative to APRA's unquestionably strong benchmarks, evaluate loan book concentration in higher-risk mortgage cohorts, review the unemployment and property price outlook, consider revenue diversification, and examine operational and cyber resilience disclosures.
The GFC showed that backward-looking loss-rate data creates false confidence, normal-distribution models underestimate tail risk, and diversification benefits collapse under stress when correlations surge simultaneously. These failures map directly onto assumptions embedded in bank valuation models today, particularly any model that extrapolates Australia's recent low credit loss environment forward.