Valuing ASX Bank Stocks: What the Ratios Don’t Tell You
58 mins ago

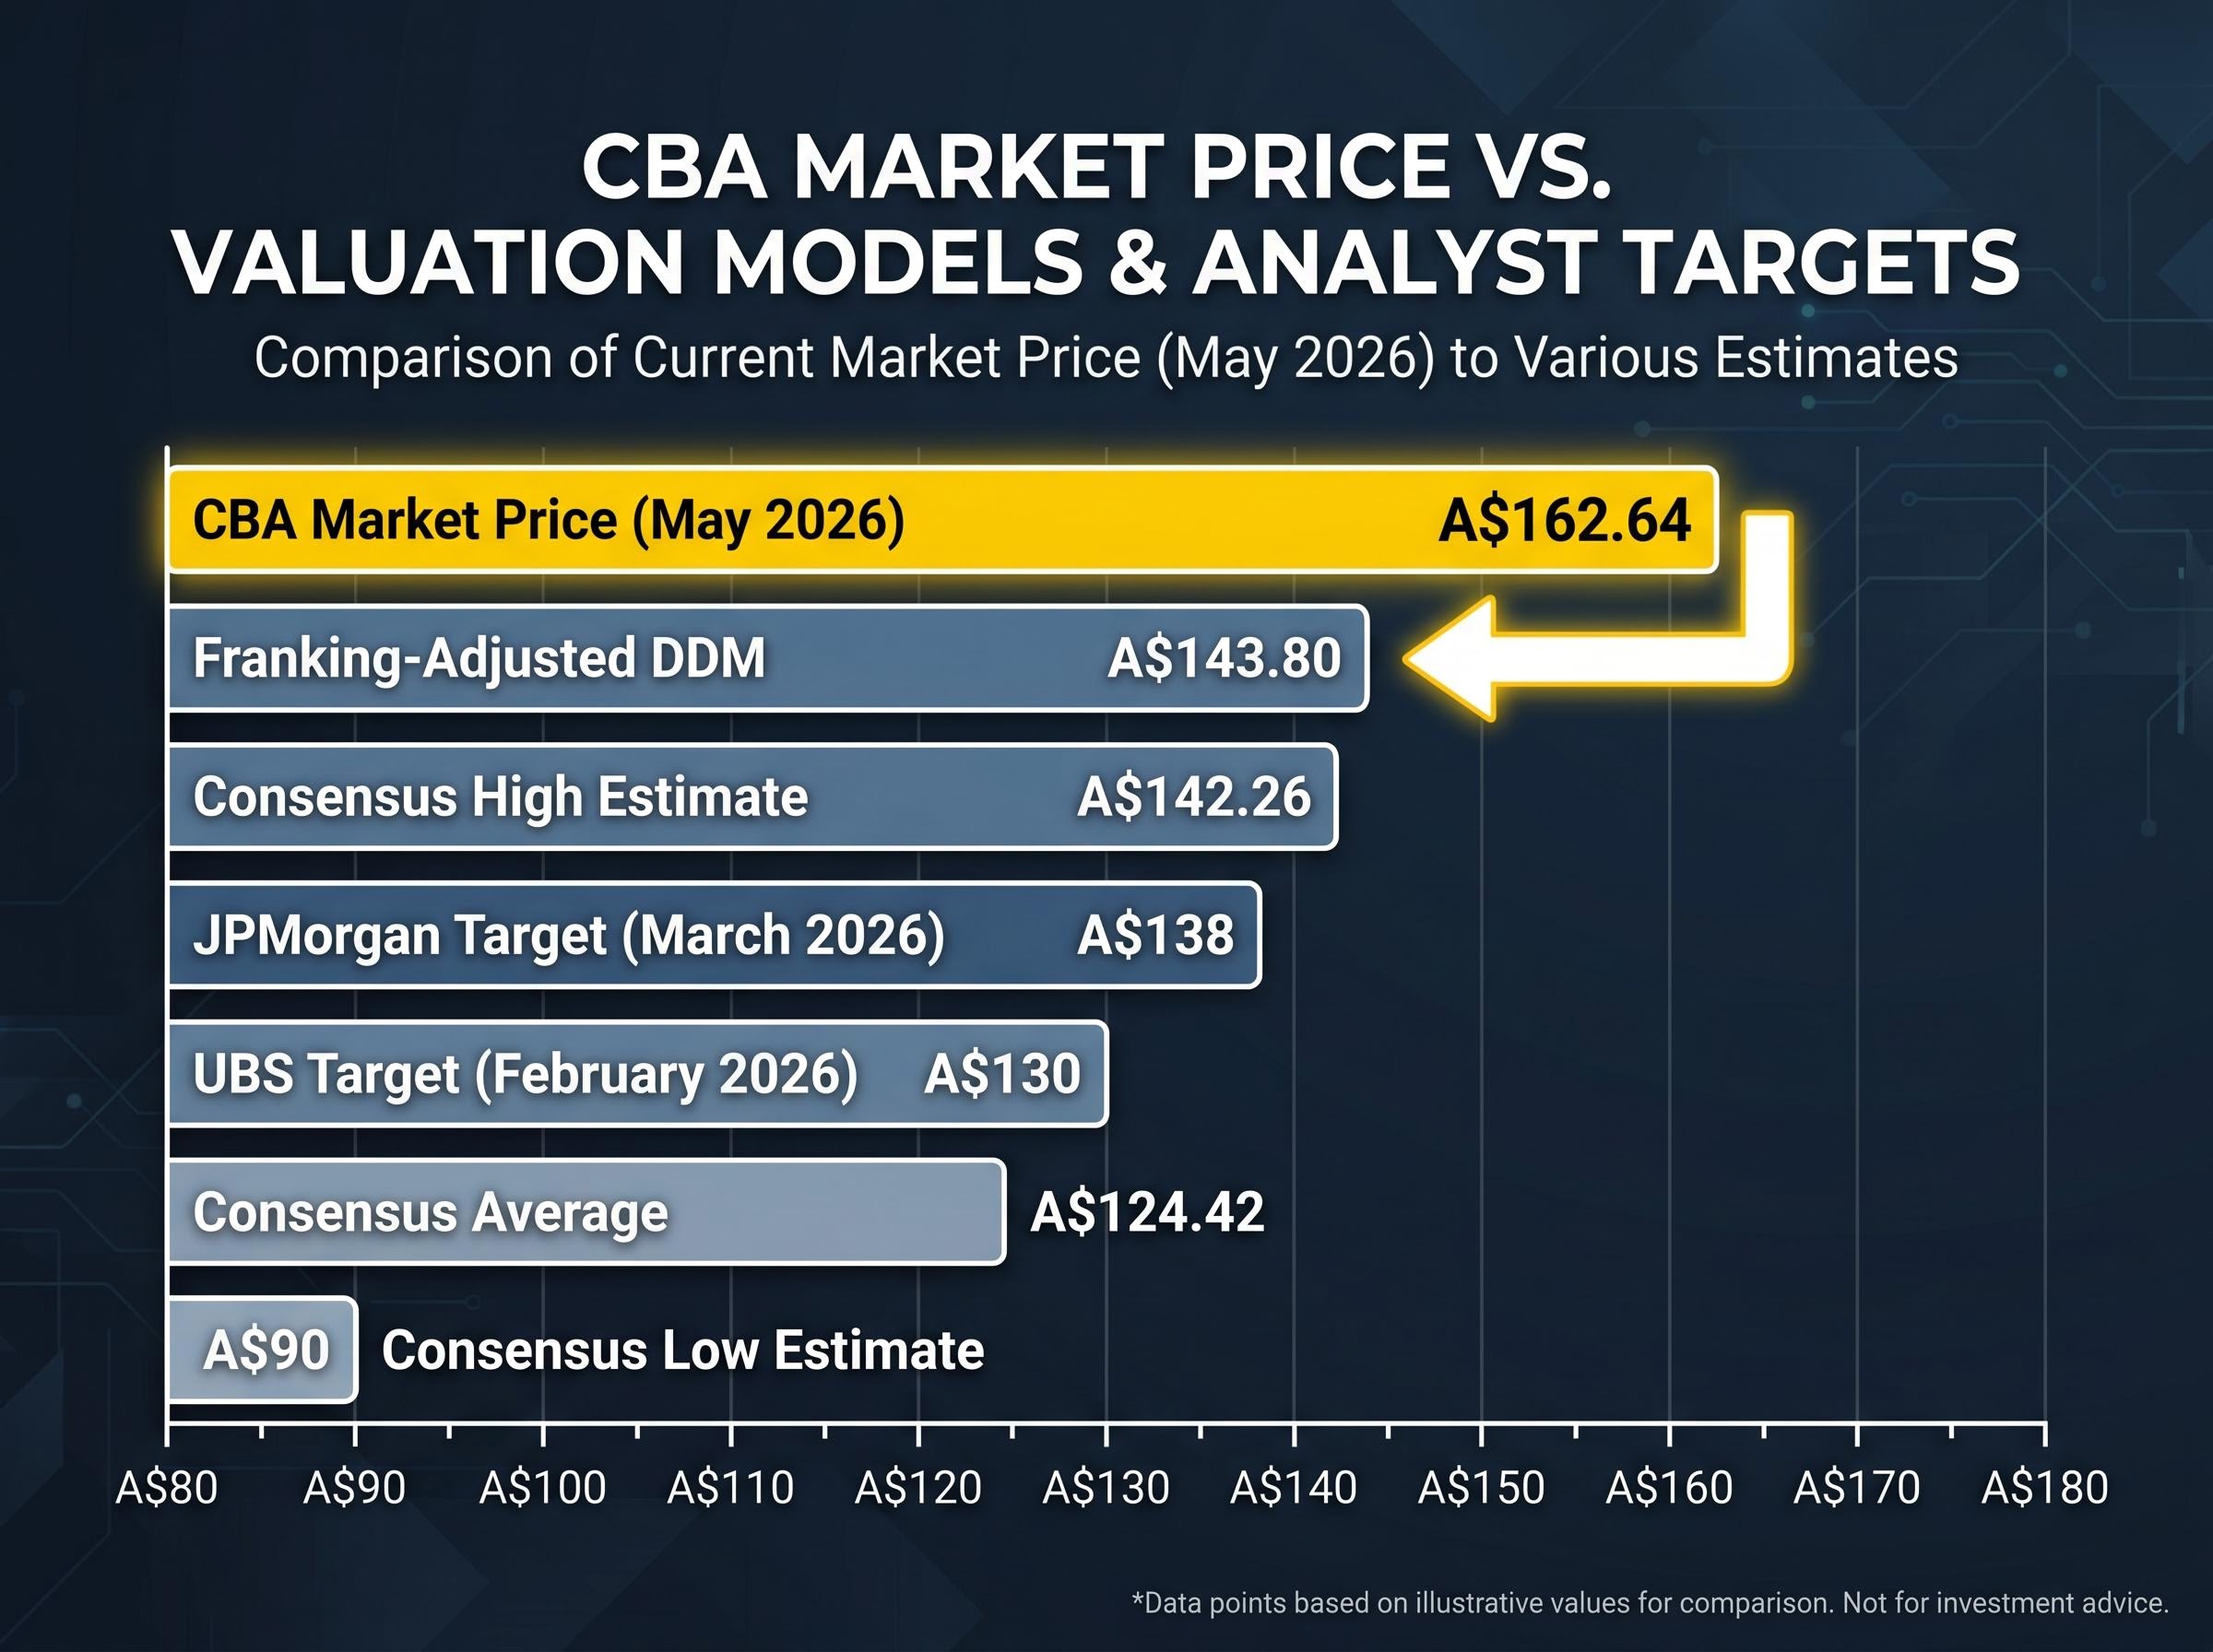
Commonwealth Bank of Australia shares closed near A$162.64 in May 2026. The average analyst price target sat at A$124.42. That gap, roughly 23%, is not a rounding error or a minor disagreement between optimists and pessimists. It is the widest divergence between CBA’s market price and broker consensus in recent memory, and it raises a question that every holder of the stock needs to answer: is the market right, or are the analysts?
This article applies the Dividend Discount Model (DDM), the most widely used valuation framework for dividend-paying bank stocks among Australian retail investors, to CBA’s real dividend data. It walks through the model step by step, shows how different assumptions about risk and growth produce valuations ranging from A$52.89 to A$238.00, and explains how franking credit adjustments shift the picture meaningfully for Australian taxpayers. By the end, readers will have both the methodology and the specific numbers needed to form their own view on whether CBA is overvalued at today’s price.
The tension is simple. CBA trades at approximately A$162. The verified analyst consensus target is A$124.42. Even the most optimistic estimate in the consensus range, A$142.26, sits more than A$20 below the current market price.
Two of the most prominent global investment banks have put sell ratings on the stock:
The premium is not costless. On 13 May 2026, CBA suffered its largest single-day percentage decline on record.
CBA’s analyst consensus has been uniformly bearish on valuation for an extended period, with 14 of 16 analysts holding sell or strong sell ratings even as the stock delivered more than 190% in total returns including dividends since mid-2020, a paradox that illustrates how long a premium can persist before it corrects.
CBA fell 10.4% in a single session on 13 May 2026, closing at A$153.67, the largest recorded daily decline for the stock.
The share price has since recovered toward A$162, but that session demonstrated how quickly a valuation premium can compress. The stock traded in a range of A$151 to A$176 during May 2026 alone.
With that context established, the question becomes: what framework can investors use to judge whether the current price is justified?
The logic behind the DDM starts with an intuition most dividend investors already hold. A stock that pays reliable dividends is worth the present value of all the future income it will deliver. The model simply formalises that intuition into a formula.
The Gordon Growth Model, the most common DDM variant, expresses this as:
Intrinsic Value = Annual Dividend ÷ (Discount Rate − Dividend Growth Rate)
Three inputs drive every output:
The DDM suits CBA because the bank is a mature, dividend-stable business. Lending activities account for approximately 85% of total income, providing a recurring revenue base that supports consistent payouts. CBA’s return on equity (ROE) of 13.1%, compared with an ASX banking sector average of 9.35%, further supports its capacity to sustain dividends over time.
Growth stocks that reinvest earnings rather than paying them out are poorly suited to DDM analysis. CBA is the opposite case: a business whose primary appeal to shareholders is the dividend itself.
The DDM formula is simple. The outputs are not. The table below shows how CBA’s estimated intrinsic value shifts across a range of discount rate and dividend growth rate assumptions, using the forward dividend estimate of A$4.76.
| Growth Rate | Discount Rate 6% | Discount Rate 7% | Discount Rate 9% | Discount Rate 10% | Discount Rate 11% |
|---|---|---|---|---|---|
| 2% | $119.00 | $95.20 | $68.00 | $59.50 | $52.89 |
| 3% | $158.67 | $119.00 | $79.33 | $68.00 | $59.50 |
| 4% | $238.00 | $158.67 | $95.20 | $79.33 | $68.00 |
The range spans from A$52.89 (an 11% discount rate with 2% growth) to A$238.00 (a 6% discount rate with 4% growth). The same company, the same dividend, and the same formula produce outputs that differ by a factor of more than four.
The base case DDM outputs, before any franking credit adjustment, sit at A$98.33 (using the historical dividend) and A$100.66 (using the forward dividend estimate). Both are well below the current share price of approximately A$162.
For the current market price to be justified under the DDM, an investor would need to assume both a low discount rate (closer to 6%) and a relatively high long-term dividend growth rate (near 3-4%). Whether those assumptions are reasonable depends on the investor’s own view of interest rates, bank earnings growth, and the risk premium appropriate for a single stock.
The lesson is not that one number in the table is correct. It is that valuation is a range, and anyone quoting a single “fair value” figure without disclosing the assumptions behind it is offering less certainty than they appear to be.
CBA’s dividends are fully franked at the 30% corporate tax rate. For eligible Australian taxpayers, that franking credit has real economic value, and the DDM should account for it.
Franking credit mechanics operate differently depending on the investor’s tax position: pension-phase SMSF members can receive the full credit as a cash refund from the ATO, while investors on higher marginal rates use the credit as a tax offset against personal income tax, meaning the same fully franked dividend carries meaningfully different after-tax value across investor types.
The grossing-up calculation works as follows:
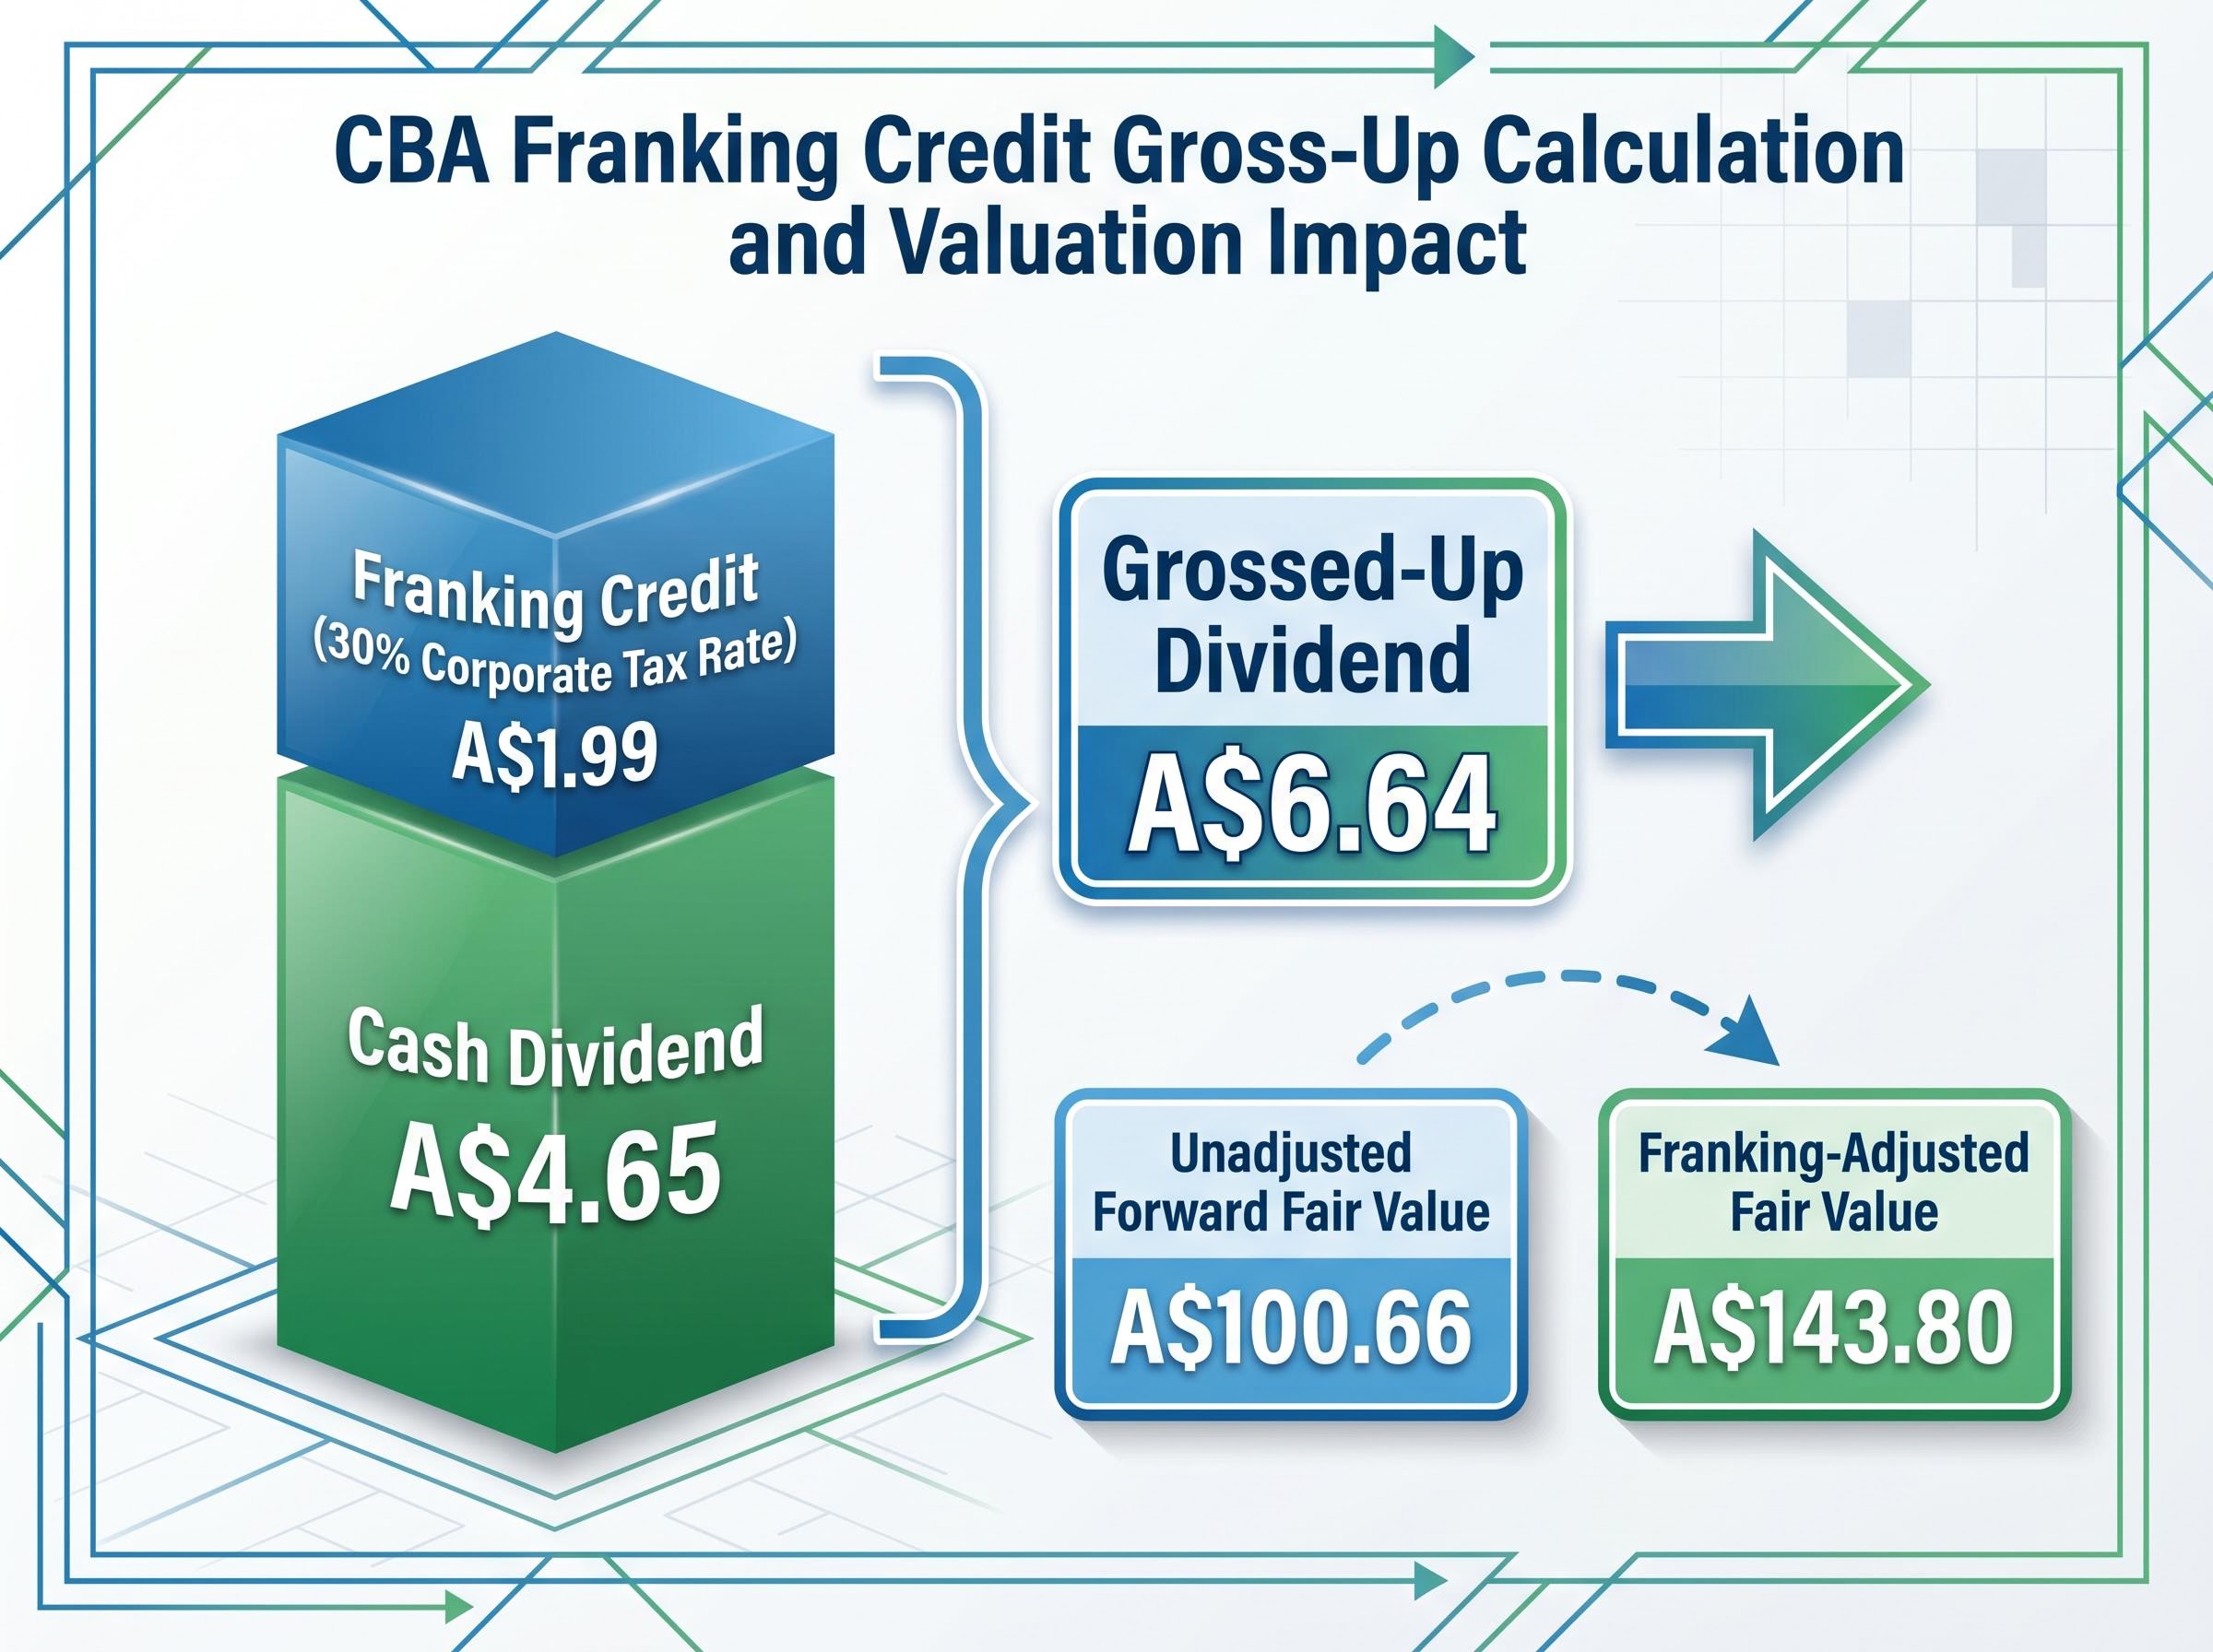
That is a meaningful lift from the unadjusted base case of approximately A$100. For investors who receive the full benefit of franking credits, the DDM paints a less severe picture of overvaluation.
The full range of DDM outputs now looks like this: A$100 (unadjusted base case), A$143.80 (franking-adjusted), and A$162.64 (current market price).
The franking adjustment closes roughly half the gap between the unadjusted DDM and the market. It does not close all of it. An approximately A$19 gap, or roughly 12%, remains between the franking-adjusted fair value and the current share price.
Closing that remaining gap would require either a lower discount rate, a higher growth assumption, or both. At the current price, the market appears to be pricing in a combination of assumptions that sits at the optimistic end of the reasonable range, even after accounting for the full value of franking credits.
The DDM is a model. CBA is a business. The quality of that business is what underpins investor willingness to pay a premium, and the quality metrics are genuine.
| Metric | CBA | ASX Banking Average |
|---|---|---|
| Return on Equity (ROE) | 13.1% | 9.35% |
| Net Interest Margin (NIM) | 1.99% | 1.78% |
| CET1 Capital Ratio | 12.3% | N/A |
CBA holds a mortgage market share exceeding 20%, a credit card market share exceeding 25%, and a customer base of over 15 million. On every operating metric that matters to a bank, CBA leads its peers.
CBA’s H1 FY2026 results, which included a record cash net profit after tax of $5.445 billion and a 4% interim dividend increase to $2.35 per share fully franked, represent the strongest piece of evidence in the bull case, reinforcing the capacity to sustain dividends even as the valuation gap relative to broker targets has remained wide.
Market commentary has consistently characterised CBA’s valuation premium over ANZ, NAB, and Westpac as a “quality/safety premium,” reflecting investor preference for CBA as a perceived defensive compounder rather than a reflection of superior near-term earnings growth.
That characterisation is a market narrative, not a quantitative conclusion. And it contains a tension. CBA’s earnings growth and dividend yield have lagged its valuation multiple relative to its peers, which means the premium has expanded faster than the fundamentals behind it. CBA is objectively a high-quality bank. The question is not whether it deserves a premium. The question is whether it deserves this much of one at A$162.
The weight of evidence leans in one direction. The DDM outputs, the analyst consensus, and the peer comparison all converge on the same broad finding: CBA appears overvalued at approximately A$162.
The key DDM outputs, summarised:
The analyst consensus target of A$124.42 sits approximately 23% below the current price. Even the franking-adjusted DDM of A$143.80, the most favourable mainstream retail assumption, leaves a gap of roughly 12%.
CBA’s culture rating of 3.4 out of 5, compared with an ASX banking average of 3.1, offers one additional qualitative data point supporting the quality characterisation. But qualitative strengths do not automatically justify any price.
The DDM is one analytical tool and should not be used in isolation. It works best alongside other valuation methods, earnings-based models, and qualitative assessment of management, competitive positioning, and macroeconomic conditions. What it offers is a transparent, replicable framework that any investor can run using CBA’s published dividend data and their own assumptions about required returns and growth.
For investors who want to see the PE ratio and DDM methods applied together, our dedicated guide to valuing ASX bank stocks walks through both frameworks using CBA illustrative data, shows how the PE-derived sector-adjusted fair value and the DDM output converge at a similar level, and explains why that convergence carries more analytical weight than either model alone.
The methodology can be trusted. The conclusion, like all valuation conclusions, should be held lightly and updated as the inputs change.
This article is for informational purposes only and should not be considered financial advice. Investors should conduct their own research and consult with financial professionals before making investment decisions. Past performance does not guarantee future results. Financial projections are subject to market conditions and various risk factors.
The Dividend Discount Model (DDM) values a stock by calculating the present value of all future dividends. For CBA, using its forward dividend estimate of A$4.76 per share and a base case discount rate and growth assumption, the model produces an unadjusted fair value of approximately A$100.66, well below the current share price.
Because CBA pays fully franked dividends at the 30% corporate tax rate, eligible Australian taxpayers can gross up the dividend from A$4.65 to A$6.64, which lifts the DDM fair value estimate from approximately A$100 to around A$143.80, closing roughly half the gap between the unadjusted model and the current market price.
In May 2026, CBA traded near A$162.64 while the analyst consensus target sat at A$124.42, a gap of roughly 23%. Fourteen of sixteen analysts held sell or strong sell ratings, with major banks including UBS and JPMorgan citing valuation as the primary concern rather than any weakness in CBA's underlying business quality.
To reach a fair value near A$162 using the DDM, an investor would need to combine a low discount rate of around 6% with a long-term dividend growth rate of approximately 3-4%, assumptions that sit at the optimistic end of the reasonable range even after accounting for franking credit benefits.
Very sensitive. Using CBA's forward dividend of A$4.76, the same DDM formula produces outputs ranging from A$52.89 (11% discount rate, 2% growth) to A$238.00 (6% discount rate, 4% growth), a more than fourfold difference driven entirely by assumption changes.