
Morningstar does not value Australian bank stocks using PE ratios. Neither does a typical professional fund manager at Perpetual or Martin Currie. Yet for most retail investors, a PE multiple and a quick check of the dividend yield is where the analysis begins and ends.
In the current Australian market, with the ASX banking sector trading at roughly 19 to 21 times earnings and major banks regularly appearing on “best dividend stocks” lists, the temptation to treat a low PE or a high yield as confirmation of value is understandable. But analysts and financial educators who study this sector closely have repeatedly warned that for cyclical, heavily regulated businesses like banks, those numbers can actively mislead. A ratio that looks cheap may simply reflect peak-cycle earnings that are about to deteriorate. A yield that looks generous may be one APRA directive away from a cut.
This guide explains why quantitative models like PE ratios and dividend discount models are only a starting point for bank stock analysis, and then provides a practical, step-by-step due diligence framework that Australian retail investors can apply to any ASX-listed bank, from CBA to BOQ to Bendigo Bank.
Why PE ratios and dividend models can point you in the wrong direction
The three most common valuation shortcuts applied to bank stocks each carry a structural flaw that standard usage ignores:
- Pro-cyclical PE trap: PE ratios compress when bad debts are low, making the bank appear cheap at the peak of the credit cycle, precisely when risk is highest.
- Policy-constrained dividends: APRA’s capital-first regulatory posture means dividends are subordinated to capital buffer maintenance, making dividend discount models (DDMs) anchored to historical payout ratios structurally unreliable.
- DDM sensitivity: Small changes in the growth rate or cost of equity assumptions produce wildly different outputs, and banks’ shifting risk profiles make these inputs particularly unstable.
The PE trap at the top of the credit cycle
When bad-debt charges are low, as they have been across much of the Australian banking sector through 2023 and 2024, earnings per share are elevated. That elevated denominator compresses the PE ratio and creates a false signal of cheapness. An investor who extrapolates current earnings into a PE-based valuation model is effectively assuming the credit cycle will not turn.
Morningstar has stated that “simple price/earnings multiples can be misleading given the cyclicality of bank earnings and changing capital rules,” and values CBA using a residual income model and scenario analysis rather than headline multiples.
The implication is straightforward: a PE that looks attractive today may reflect unsustainably high earnings rather than genuine value.
A qualitative checklist for ASX bank investors, covering management quality, capital adequacy, loan book concentration, macroeconomic sensitivity, revenue mix, and operational resilience, is the mechanism that converts quantitative inputs into a defensible valuation conclusion; without it, a low PE or high yield is simply an unexamined hypothesis.
Why dividend discount models are especially fragile for banks
APRA Chair John Lonsdale, speaking at the AFR Banking Summit in March 2024, reinforced that capital buffers and stress-testing preparedness take priority over shareholder distributions. Continuing implementation of Basel 3/4 capital standards in Australia means banks may need to retain more earnings to support regulatory buffers, directly constraining dividend growth regardless of what historical payout ratios suggest.
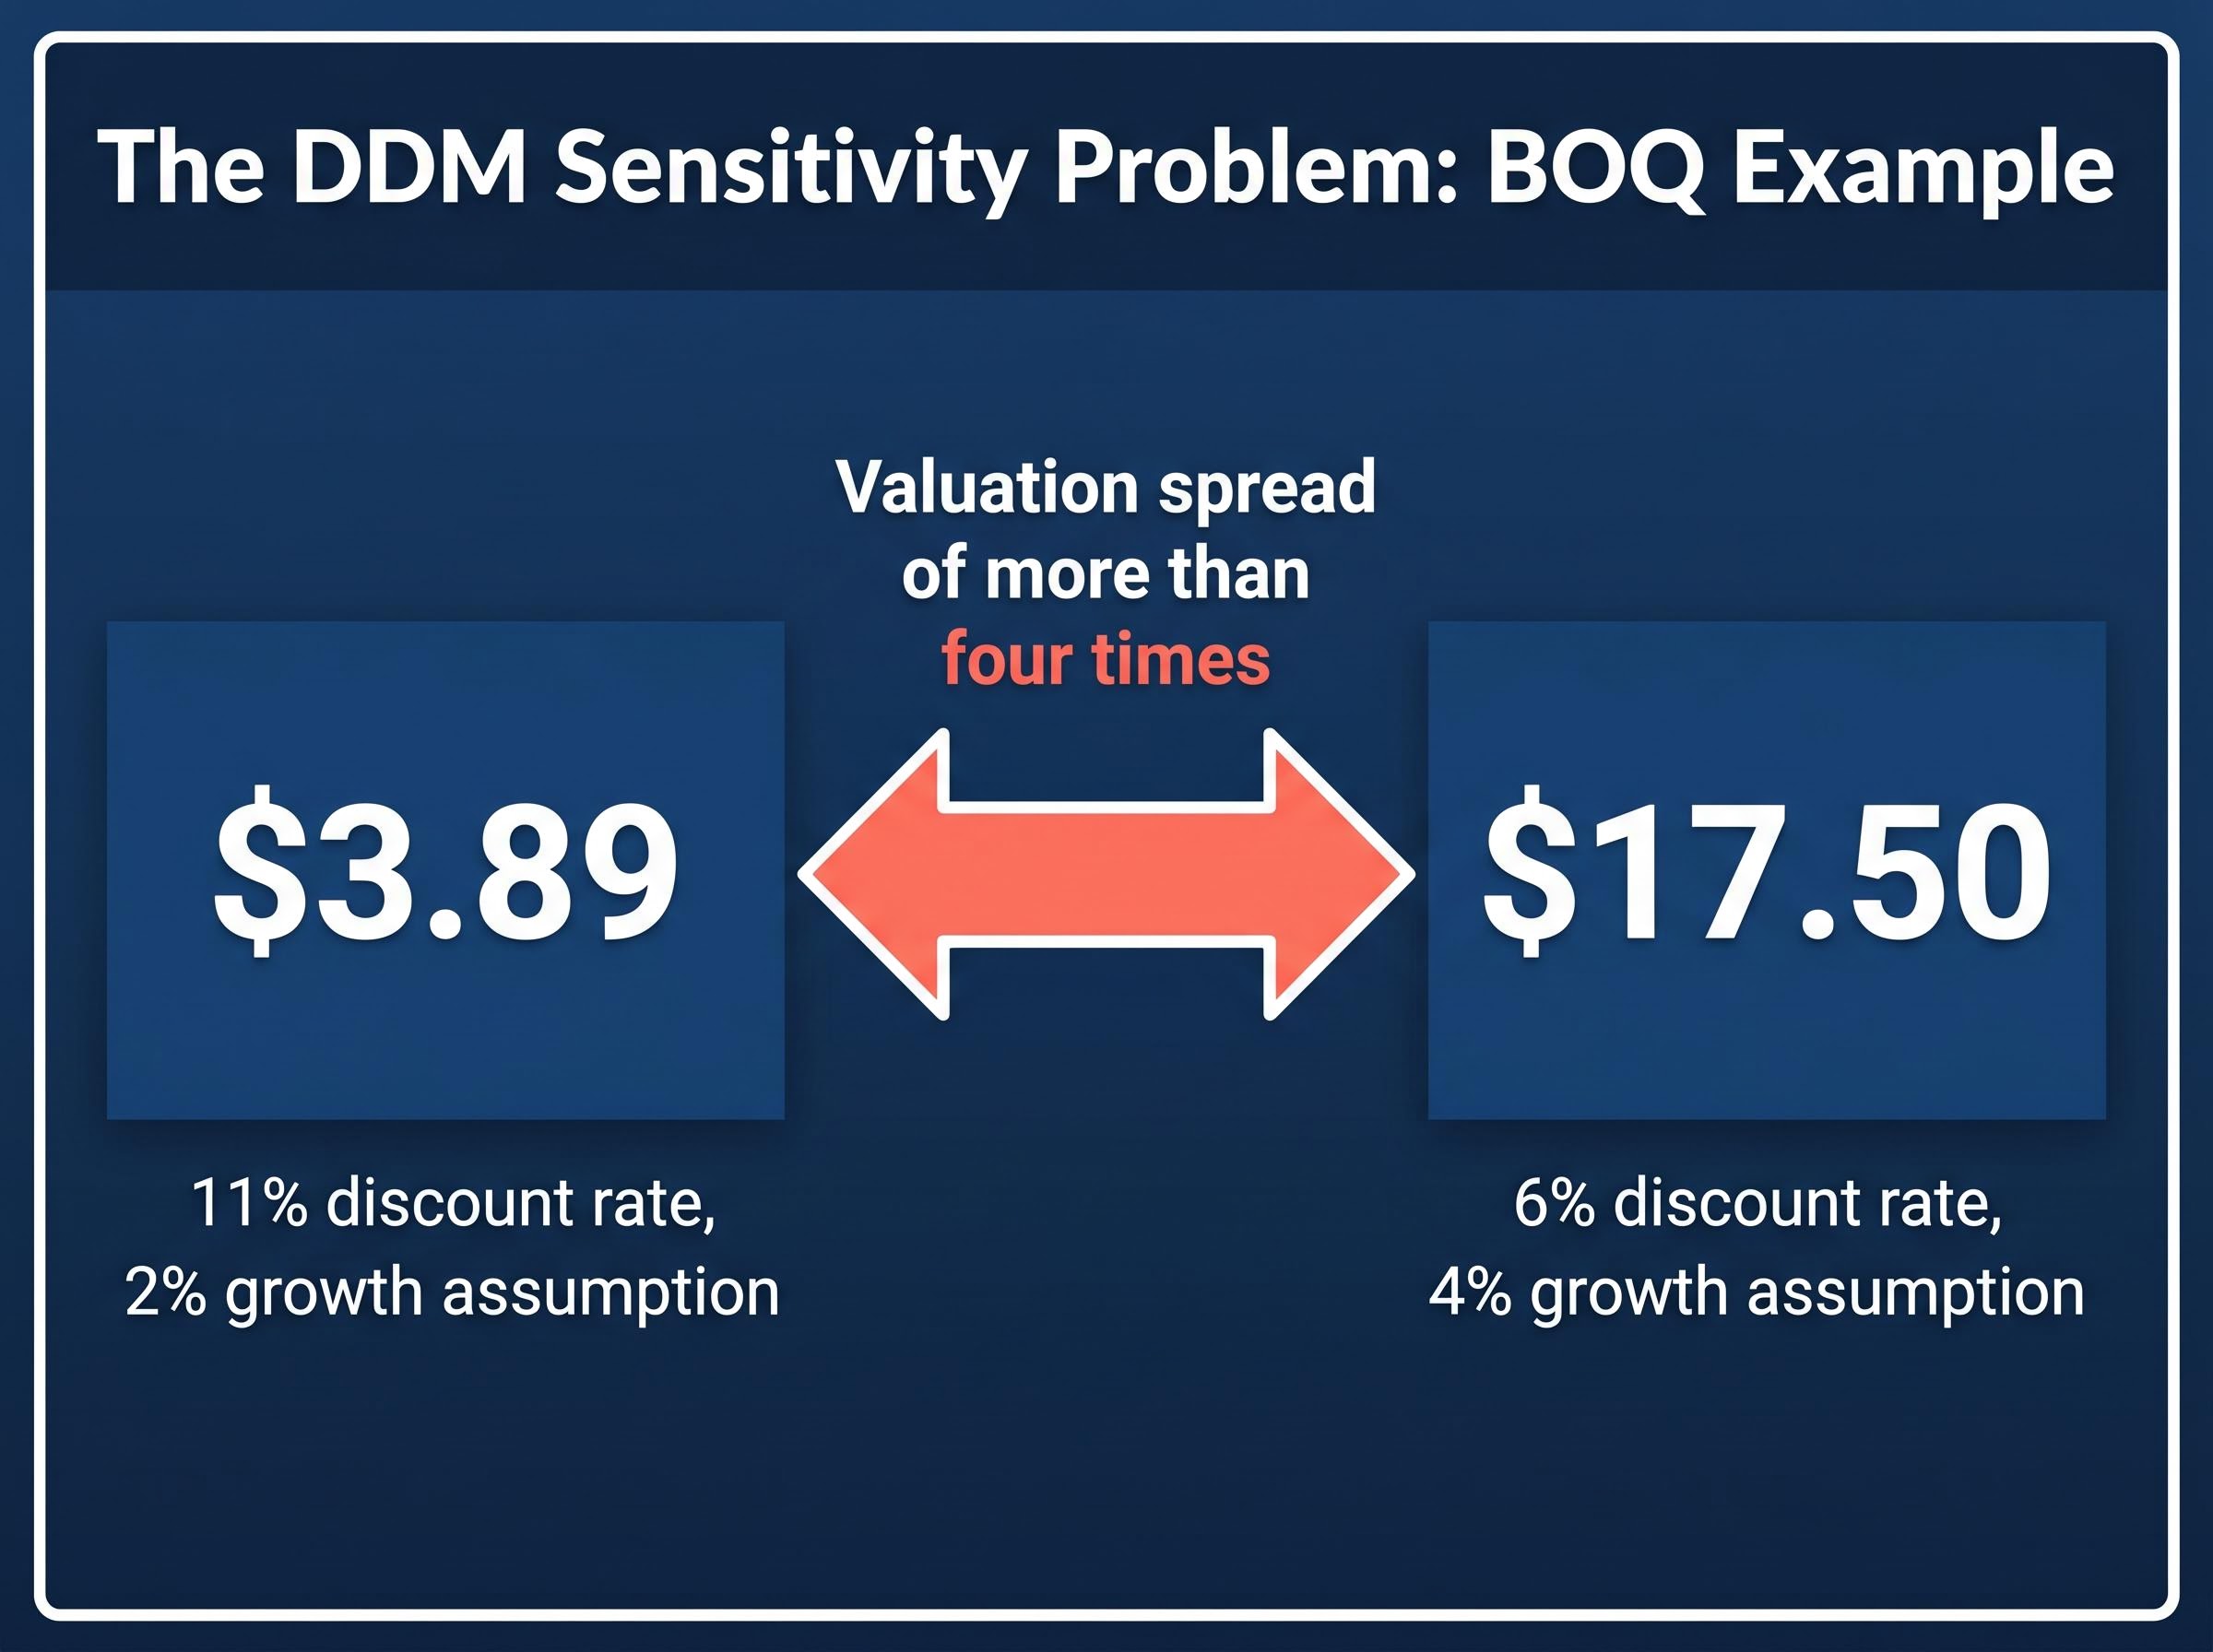
The model sensitivity problem compounds this. Using BOQ’s dividend data, a DDM produces outputs ranging from $3.89 (at an 11% discount rate and 2% growth assumption) to $17.50 (at a 6% discount rate and 4% growth assumption). That is a valuation spread of more than four times, driven entirely by reasonable-looking changes in assumptions. For a sector where the risk profile shifts with rate cycles, property markets, and regulatory directives, those inputs are anything but stable.
When big ASX news breaks, our subscribers know first
What professional analysts look at instead
Institutional analysts do not abandon quantitative tools. They simply refuse to stop at them. The professional approach treats PE and dividend yield as screening tools: useful for identifying candidates, inadequate for forming conclusions.
Morningstar’s Australian bank coverage uses excess returns, discounted cash flow, and scenario analysis. The firm’s reports on ANZ, CBA, NAB, and Westpac consistently note that headline multiples do not capture loan loss cycles or regulatory capital needs. The real valuation work happens beneath the ratio.
Fund managers who spoke during Livewire’s May 2024 “Buy Hold Sell” coverage of the bank reporting season reinforced this hierarchy. Managers from Martin Currie and Perpetual argued that investors should prioritise NIM trends, funding costs, and capital ratios over PE and yield when assessing bank value.
Fund managers featured in Livewire’s May 2024 bank coverage stressed that NIM trends, funding costs, and capital adequacy ratios should take precedence over PE multiples and headline yield in any serious bank analysis.
The four qualitative pillars that professional managers consistently return to are:
- Asset quality: Arrears trends, provisioning coverage, and loan concentration by sector or geography.
- Funding and liquidity: Deposit concentration, wholesale funding reliance, and the maturity profile of liabilities.
- Regulatory outlook: APRA capital expectations, Basel 3/4 implementation progress, and macro-prudential settings.
- Competitive position: Share in core lending segments, pricing power, technology capability, and exposure to fintech disruption.
PE and yield do not disappear from this process. They sit at the front door, generating hypotheses. The analytical work that follows is what determines whether those hypotheses hold.
The qualitative dimensions of bank valuation, including management credibility, loan-book discipline, NIM durability, and governance standards, are what determine whether reported earnings will hold up over a full credit cycle; a DDM sensitivity table for NAB, for example, produces outputs ranging from $19.00 to $85.50 depending solely on discount and growth rate assumptions, confirming that the inputs themselves require qualitative grounding before any output is meaningful.
Understanding the metrics that actually drive bank earnings
Open any major bank’s annual report, and the numbers that determine whether earnings and dividends are durable sit in predictable places. Knowing what to look for first is the difference between reading the report and using it.
Income-statement metrics: NIM and cost efficiency
Net interest margin (NIM) is the spread between what a bank earns on its loans and what it pays on deposits and other funding. It is the single largest driver of bank revenue. A single-year NIM figure is informative; the trend over at least five years is what reveals whether the bank’s earnings base is expanding or contracting.
The metrics professional analysts prioritise, NIM, ROE and CET1, each measure a distinct dimension of bank earnings quality: NIM captures revenue durability, ROE reveals how efficiently capital is being deployed, and CET1 determines how much buffer sits between the bank and a forced capital retention event.
During the 2024 bank result season, NIMs that had expanded in the early rate-hike cycle were beginning to peak and in some cases contract, as deposit competition intensified and wholesale funding costs rose. Investors who relied on a current PE based on elevated earnings were, in effect, pricing in a NIM that was already turning.
The cost-to-income ratio reflects operational efficiency. Several regional banks have reported elevated cost-to-income ratios in recent years due to technology remediation programmes, and these costs are visible in annual report segmental disclosures.
Capital and asset quality metrics
The CET1 ratio (Common Equity Tier 1) is the core equity buffer APRA requires banks to maintain. A bank operating close to its minimum buffer has less room to grow dividends and more exposure to forced capital retention if conditions deteriorate. APRA’s publicly available Pillar 3 capital disclosures provide CET1, non-performing loan data, and liquidity coverage ratios at no cost to the investor.
APRA Prudential Standard APS 330 mandates the specific capital, risk, and liquidity disclosures that authorised deposit-taking institutions must publish, giving retail investors free access to the CET1 ratios, non-performing loan data, and liquidity coverage ratios referenced throughout this framework.
Loan loss provisions and impaired assets act as leading indicators. Rising provisions typically precede earnings downgrades. Watching these figures across reporting periods is more informative than any single PE calculation.
As Rask Australia has noted, PE and DDM work only when investors have confidence in future earnings and dividend stability, and for banks, that confidence depends entirely on macro conditions, regulation, and credit quality.
| Metric | What It Measures | Where to Find It | Deterioration Signal |
|---|---|---|---|
| Net interest margin (NIM) | Spread between loan income and funding costs | Results presentation, annual report income statement | Declining NIM over two or more half-year periods |
| Cost-to-income ratio | Operating efficiency | Annual report segmental disclosures | Rising ratio without corresponding revenue growth |
| CET1 ratio | Core equity capital buffer | APRA Pillar 3 disclosures, results presentations | Ratio falling toward APRA’s minimum requirement |
| Loan loss provisions | Expected credit losses reserved against loan book | Annual report balance sheet notes | Rising provisions or declining coverage ratios |
Loan book composition also matters. The mix of mortgages, business lending, institutional exposure, and geographic diversification reveals risk concentration:
- Mortgage-heavy books carry property market exposure.
- Business lending books carry economic cycle sensitivity.
- Institutional and wholesale lending introduces counterparty concentration risk.
- Geographic diversification (or lack of it) signals whether downturns in a single state could disproportionately affect credit quality.
How to evaluate management quality in an annual report
The gap between what management says and what actually happens is one of the most revealing signals available in a bank’s public disclosures. Most retail investors skip it entirely.
Annual reports contain a letter to shareholders and an operating and financial review that together set out management’s strategic narrative. Reading this year’s version alongside last year’s version is where the signal emerges. Did the cost savings materialise? Were the technology milestones met? Did revenue targets land, or were they quietly revised?
Evaluating management quality follows a straightforward checklist:
- Prior-year targets versus actual delivery: Compare stated objectives from the previous annual report against reported outcomes. Pay attention to cost reduction targets, customer satisfaction scores, and technology programme timelines.
- Tone of problem disclosure: Does management acknowledge setbacks candidly, or does the language minimise challenges with promotional framing?
- CEO and CFO tenure and peer comparison: Long-tenured executives with a track record of meeting targets carry different weight than recent appointments. Compare long-term ROE and ROA against peers over a full credit cycle, not a single year.
- Technology and regulatory investment quantification: Is spending on technology remediation and regulatory compliance quantified with clear milestones, or described in vague aspirational terms?
Comparing what management said last year against what they report this year is the single most accessible management quality test available to a retail investor. The annual report provides both sides of that comparison in the same document.
Motley Fool Australia has emphasised that understanding business quality alongside balance sheet strength is a prerequisite before treating any valuation metric as meaningful. Rask Australia’s educational framework reinforces this, positioning management evaluation, including stated strategy against actual progress, as a core analytical step that precedes any valuation conclusion.
For Australian bank investors, management quality has been particularly consequential. Remediation charges and technology write-offs across several banks during the post-Royal Commission period eroded earnings materially, and much of this was visible in the gap between prior-year guidance and subsequent reported outcomes.
Building a stress-tested investment thesis and guarding against confirmation bias
A well-researched bullish case is only half the work. The other half is actively searching for reasons it might be wrong.
Confirmation bias is the tendency to selectively gather evidence supporting a conclusion already reached. When a PE ratio or a yield figure has already triggered a positive first impression, the risk of filtering subsequent information to confirm that impression is substantial.
The discipline that counteracts this has two steps:
- Write the bear case before finalising any position. Identify at least two credible scenarios, such as regulatory tightening or a property market downturn, and model how each would affect earnings, dividends, and capital. If the investment thesis cannot survive either scenario, revisit the position sizing or the thesis itself.
- Read at least one dissenting view before acting. Actively seek out a contrarian broker note, article, or analysis on any bank being considered. If the thesis rests on a single ratio, treat that as a signal to expand the analysis, not proceed.
The structural headwinds a bear case for Australian bank stocks should incorporate in 2025 and beyond include:
The macro forces compressing bank earnings in 2026, including a rapid RBA re-hiking cycle, federal budget property measures, and an energy price shock, are precisely the kind of simultaneous headwinds that stress-test any thesis built on a single PE multiple or stable dividend assumption, and collectively drove falls of up to 14% across the major banks in May 2026 alone.
- NIM normalisation as rate cycles shift and deposit competition persists.
- Rising capital requirements under Basel 3/4 implementation.
- Heavy technology investment expenditure that elevates cost-to-income ratios.
- Credit quality deterioration in highly leveraged borrower segments.
APRA’s 2024 communications explicitly cautioned against extrapolating benign credit conditions indefinitely, providing a regulatory reference point for constructing realistic stress scenarios.
Rask Australia recommends writing down pre-investment assumptions (target NIM, credit cost, dividend growth) and comparing them systematically to actual outcomes over time. This post-investment discipline converts a one-off analysis into a repeatable process that improves with each reporting season.
Putting the framework together: a six-step due diligence process for ASX bank stocks
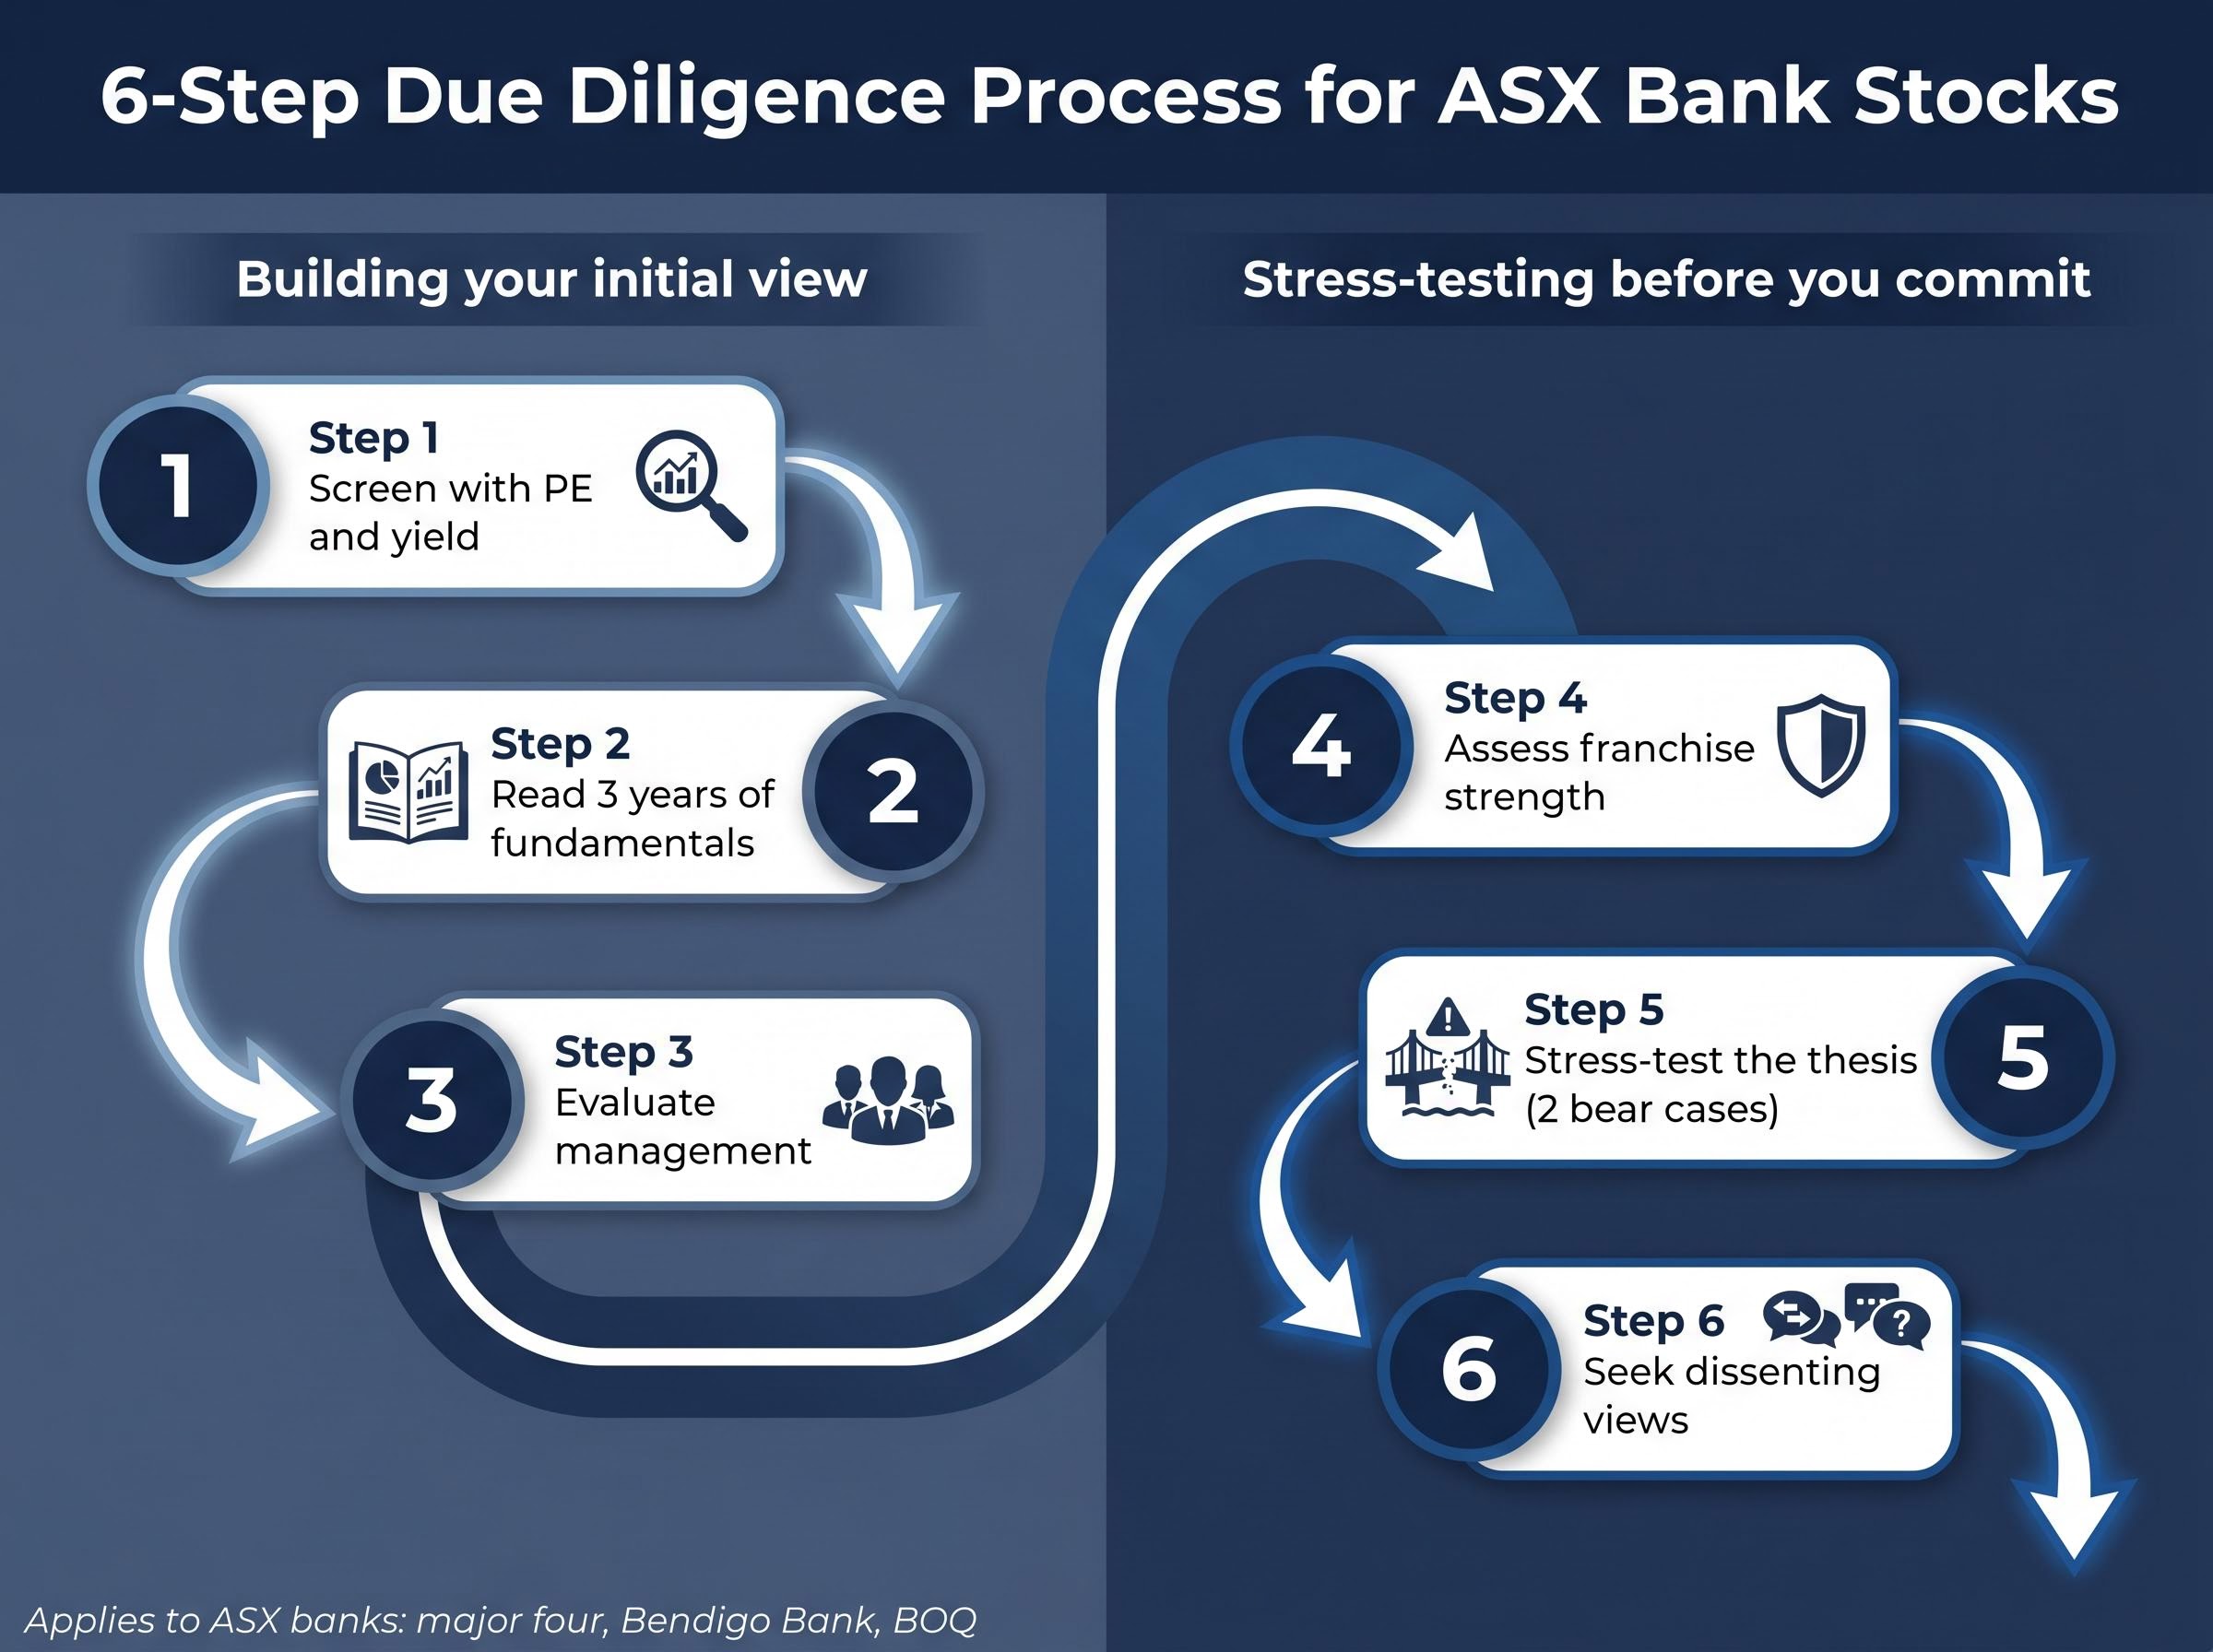
The analysis covered in this guide synthesises into a single repeatable process. Each step builds on the one before it, and the framework applies to any ASX-listed bank, from the major four to regionals like Bendigo Bank and BOQ.
Steps one to three: building your initial view
- Screen with PE and yield. Use headline multiples and dividend yield to identify candidates and generate a starting hypothesis. This is a filter, not a conclusion.
- Read three years of fundamentals. Review the last two to three annual reports and most recent results presentations, focusing on NIM trend, cost-to-income ratio, loan book composition, capital ratios versus APRA requirements, loan loss provisions, and deposit and wholesale funding profiles.
- Evaluate management. Compare stated strategy against actual progress. Assess CEO and CFO tenure, long-term ROE and ROA versus peers, and whether technology and regulatory investment has been quantified with clear milestones.
These three steps should be completed before forming any valuation conclusion.
Steps four to six: stress-testing before you commit
- Assess franchise strength. Evaluate the bank’s competitive positioning across these dimensions:
- Brand strength and distribution network.
- Digital capability relative to peers.
- Customer satisfaction scores.
- Competitive position in core mortgage and business lending segments.
- Stress-test the thesis. Write down at least two credible bear cases and model how each would affect earnings, dividends, and capital.
- Seek dissenting views. Read at least one contrarian or negative article or broker note before finalising any position.
Steps four to six are where overconfidence and confirmation bias are most likely to derail an otherwise well-researched thesis. The discipline of actively seeking challenge, rather than confirmation, is what separates a repeatable investment process from a series of isolated decisions.
APRA’s publicly available Pillar 3 disclosures provide the capital adequacy, asset quality, and liquidity data required for steps two and five at no cost.
Models are a map, not the territory
PE ratios and dividend discount models are tools for generating hypotheses, not conclusions. The real analytical work is qualitative, structural, and forward-looking: reading the annual reports, tracking management delivery, understanding where the bank sits in the credit cycle, and pressure-testing the thesis against credible bear cases.
The six-step framework above is not a one-time exercise. It works best as a living document, updated against actual outcomes each reporting season rather than treated as a permanent verdict. The next time a bank stock catches attention on a valuation screen, open the last two annual reports before reaching for a calculator.
This article is for informational purposes only and should not be considered financial advice. Investors should conduct their own research and consult with financial professionals before making investment decisions.