
What UK Traders Lose When Their CFD Account Goes Offshore
29 mins ago

A company reports earnings that beat analyst estimates on both revenue and EPS. The stock falls 12% the next morning. This is not a paradox; it is a pattern. Understanding why it happens is the single most valuable skill a retail investor can develop around earnings season. Every quarter, thousands of U.S. publicly traded companies release earnings reports that can move share prices by double digits in hours. The SEC mandates that these disclosures be accurate and complete, which means the information is there. The challenge is knowing which numbers actually drive the market’s reaction and which ones are noise. This guide provides a structured, step-by-step framework for analysing earnings reports the way institutional investors do: starting with forward guidance rather than headline beats, scrutinising margin trends, interrogating cash flow quality, and identifying the behavioural mistakes that cause retail investors to systematically misread what the numbers are saying.
Most retail investors read earnings reports top-to-bottom as presented, which buries forward guidance near the end. Markets do not read them that way. Inverting the order to match how prices actually move is the first and most consequential adjustment to make.
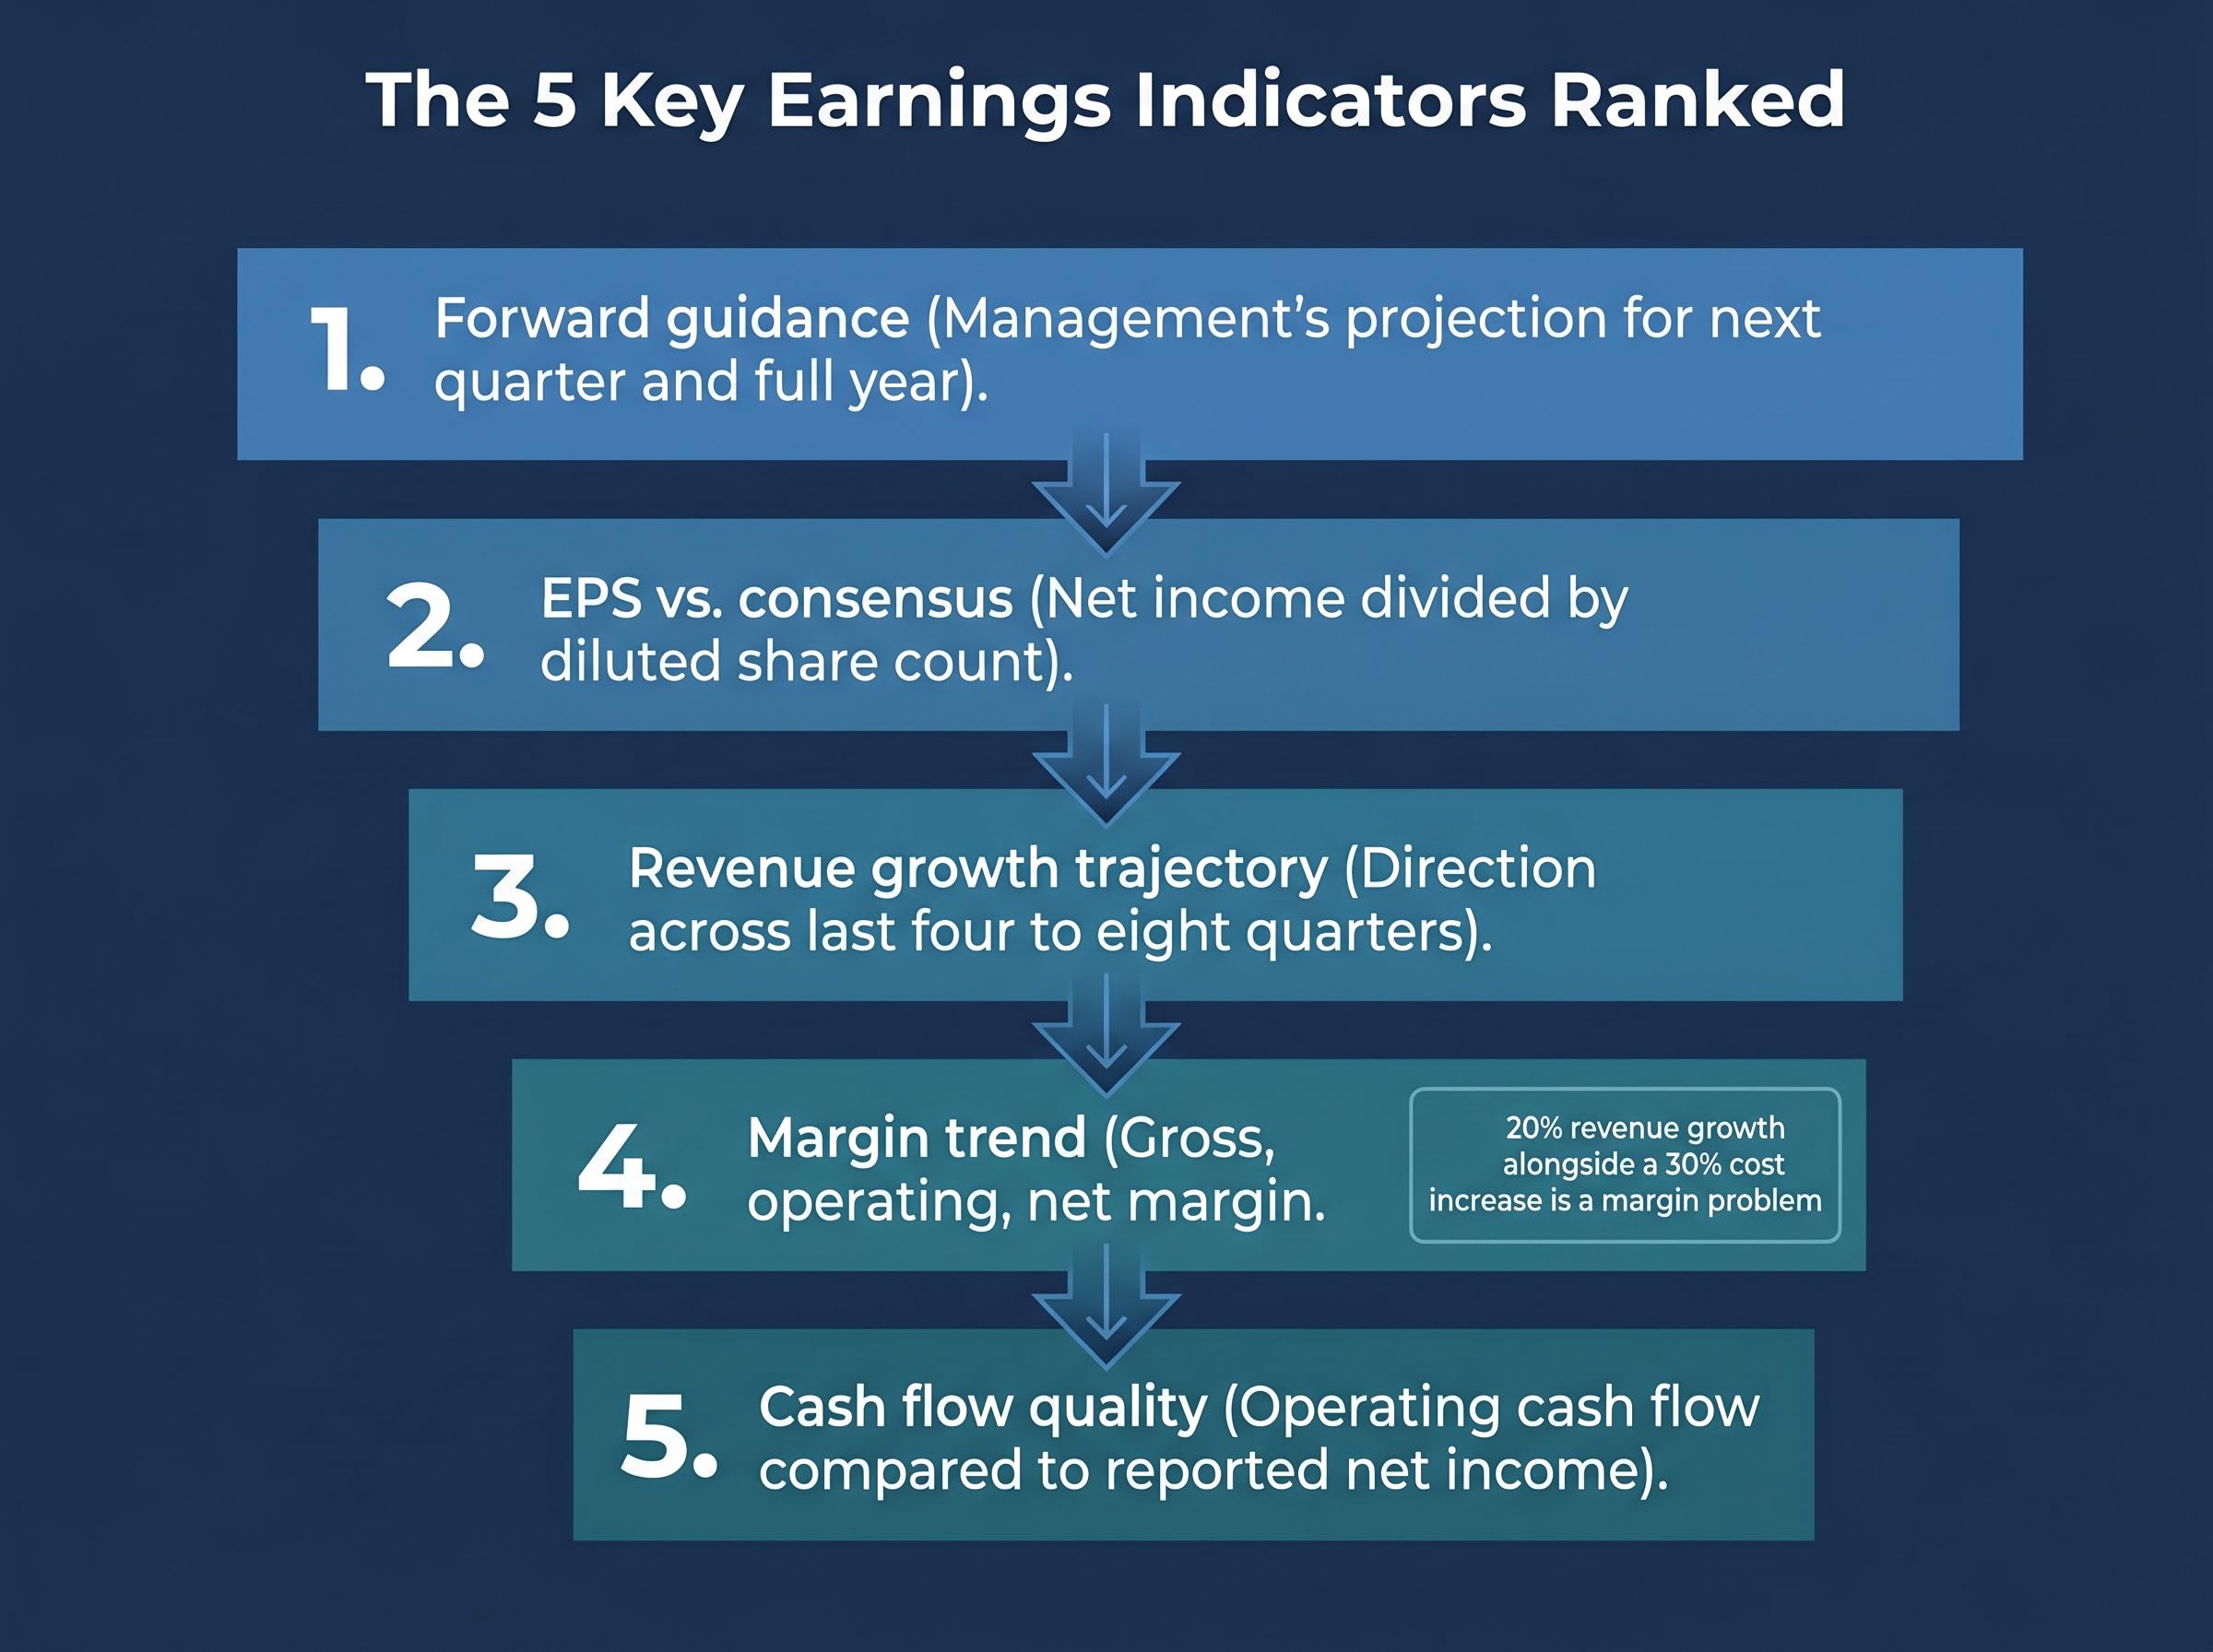
The five metrics below are ranked by market-moving importance, not by where they appear in the filing:
A company reporting 20% revenue growth alongside a 30% cost increase is a company with a margin problem, not a growth story. As Marcel Miu’s illustrative scenario demonstrates, the top-line headline can mask erosion that the income statement’s lower lines expose clearly.
EPS, despite being the most-cited headline figure, is the least forward-looking of the five. Evaluate it last, not first.
Operating cash flow is harder to manipulate than net income because it tracks actual cash moving through the business rather than accounting accruals. When net income runs significantly above operating cash flow, the gap often sits in working capital adjustments, deferred revenue timing, or aggressive revenue recognition.
Two balance sheet items deserve specific attention. Inventory buildup in retail and manufacturing companies can signal weakening demand before the income statement reflects it. Accounts receivable growth that outpaces revenue growth may indicate a company booking sales that have not yet been collected, a potential warning about the quality of reported revenue.
Stock prices do not reflect last quarter’s results. They reflect the next 12 months of expected earnings, discounted back to today. When a company reports, the backward-looking numbers confirm or deny what the market already anticipated. Forward guidance, by contrast, resets that expectation entirely.
The mechanism works in stages. Before the report, analysts set price targets based on projected earnings streams. The reported quarter either validates or adjusts those projections marginally. Guidance, however, can shift the entire forward earnings curve, and it is that curve the stock price tracks.
This is why specific guidance warning signs matter more than the size of a beat. A company narrowing its guidance range without raising the midpoint is signalling reduced confidence. A shift from quantitative projections to qualitative language (“we remain cautiously optimistic”) removes precision the market previously had. Withdrawn guidance is the maximum uncertainty signal, and markets price uncertainty with a discount.
Management credibility compounds the effect. A company with a track record of conservative guidance receives more credit for a raise than one with a history of missing its own projections. The same guidance revision carries different weight depending on who issues it.
The S&P 500 earnings guidance signals from the late-April 2026 reporting week, when companies representing roughly 44% of index market cap reported simultaneously, illustrated exactly this dynamic: Microsoft, Alphabet, and Meta each faced investor scrutiny centred on forward capex commitments and revenue acceleration, not on whether their reported quarters cleared the consensus bar.
Research published on SSRN (abstract ID 4916490) finds that earnings guidance meaningfully reduces investor uncertainty and, in documented cases, creates larger stock price movements than the reported beat or miss outcome itself.
FactSet data for Q4 2025 showed 52 S&P 500 companies issued negative EPS guidance versus 48 issuing positive guidance. That near-even split underscores how guidance directionality, not just reported beats, is the key differentiating variable in post-earnings stock performance.
Home Depot illustrated the pattern directly. The company beat estimates in a 2024-2025 reporting period but experienced a notable stock selloff when it failed to raise forward guidance, fitting the documented pattern of companies that beat but do not raise forward estimates facing disproportionate selling pressure.
| Scenario | Reported EPS | Guidance | Typical Stock Reaction |
|---|---|---|---|
| Beat + Raised Guidance | Above consensus | Raised | Positive, often gap up |
| Beat + Flat Guidance | Above consensus | Unchanged | Muted or negative |
| Beat + Lowered Guidance | Above consensus | Lowered | Negative, often sharp selloff |
| Miss + Raised Guidance | Below consensus | Raised | Mixed; guidance often offsets miss |
The third row explains the “beat and drop” phenomenon that confuses retail investors every quarter. The stock is not reacting to last quarter. It is repricing the future.
A company beats published analyst consensus. The stock drops. The retail investor checks the headline, confirms the beat, and concludes the market is irrational. It is not.
Published consensus estimates represent one segment of investor opinion, typically the average of sell-side analyst projections compiled by services like FactSet or Bloomberg. The actual market expectation is broader. It includes positioning by institutional funds, options market pricing, and the “whisper number,” the unofficial expectation that often sits above published consensus. A company can beat the published estimate while still disappointing the market’s real expectation.
Beat magnitude matters as well. A $0.01 EPS beat on $2.00 consensus is statistical noise. A 15% revenue miss is material. Calibrating reaction to the scale of the surprise, not just its direction, separates useful analysis from headline-chasing.
Lowe’s experienced a similar earnings-related decline during the 2024-2025 period, consistent with demand normalisation in the home improvement sector post-pandemic. Both Lowe’s and Home Depot demonstrated the same principle: the beat itself was not the signal that mattered.
GAAP (Generally Accepted Accounting Principles) figures follow standardised accounting rules mandated by the SEC. Non-GAAP figures, also labelled “adjusted EPS” or “core earnings,” exclude items management considers non-recurring or non-operational.
The exclusions are where the trap lies. Common non-GAAP exclusions include:
The SEC Regulation G non-GAAP reconciliation rules require companies to present a quantitative reconciliation between any non-GAAP measure and its most directly comparable GAAP figure, which means every adjusted EPS disclosure must disclose precisely what was stripped out and why.
Retail investors frequently compare non-GAAP current results to GAAP prior-period results without realising the mismatch. This apples-to-oranges comparison can make a flat or declining business appear to be growing. When “non-recurring” charges recur consistently, that recurrence itself is a signal worth noting.
A single analytical checklist does not work across industries. The metrics that reveal a software company’s trajectory differ fundamentally from those that signal a bank’s credit quality or a retailer’s demand outlook. Adapting the analytical lens to the specific business model in front of you is what separates surface-level reading from useful analysis.
| Sector | Key Metrics | What to Watch For |
|---|---|---|
| Technology / SaaS | Net Revenue Retention, operating leverage, billings vs. revenue | NRR below 100% signals customer contraction; billings declining while revenue grows suggests future deceleration |
| Retail / Consumer | Same-store sales, inventory levels, traffic vs. ticket | Inventory buildup alongside slowing comps is a demand warning; ticket growth without traffic growth suggests price-driven, not volume-driven, performance |
| Financials / Banks | Net interest margin, loan loss provisions, non-performing loan ratios | Rising provisions signal management expects credit deterioration ahead; NIM compression in a falling rate environment pressures profitability |
| Industrials | Order backlog, book-to-bill ratio, tariff exposure | Book-to-bill below 1.0x means orders are declining relative to shipments; tariff disclosures are especially material in 2025 |
| Healthcare / Biotech | Pipeline milestones, regulatory status, revenue concentration | Single-drug revenue dependence creates binary risk; delayed regulatory timelines can reset the valuation thesis entirely |
Earnings calls frequently surface sector-specific signals that do not appear in the financial statements. Supply chain commentary, hiring conditions, and pricing power language from management all carry information that the reported numbers alone cannot convey.
The errors below are documented in academic and professional research. The question is not whether they occur; it is whether you recognise them in your own process.
The cognitive biases in investor decision-making that drive these earnings misreads are not random; prospect theory research shows that losses feel approximately twice as painful as equivalent gains, a fundamental asymmetry that pushes investors toward anchoring on recent price levels and headline beats rather than the forward-looking data that actually reprices the stock.
NBER Working Paper w33625 documents that retail investors show a strong preference for price chart analysis and analyst buy/sell recommendations while showing relatively little engagement with risk statistics, forward guidance language, and fundamental financial ratios.
A CFA Institute survey, “Clicks and Credibility,” finds that financial influencers on social media can significantly shape retail investor interpretation of earnings results, often through selective presentation, omission of material risks, and inadequate conflict-of-interest disclosure.
Enphase Energy illustrates how these errors compound. Shares declined approximately 61% from roughly $95 in mid-October 2024 to approximately $37 by October 2025. A deteriorating guidance environment in a rate-sensitive sector overwhelmed any near-term earnings beats, yet investors anchored to the headline numbers may have held through the decline expecting the beat narrative to reassert itself.
One structural factor amplifies all five mistakes: institutional algorithmic systems respond to earnings data within milliseconds. Retail investors attempting to trade around releases face this speed disadvantage by default. Recognising the disadvantage is itself a corrective.
The information gap between institutional and retail investors has narrowed substantially since 2020. The remaining gap is process, not access. The tools below close the access component.
| Tool | Cost | Primary Use Case | Best For |
|---|---|---|---|
| SEC EDGAR | Free | 10-Q, 10-K, and 8-K filings | Authoritative primary source; building multi-year trend spreadsheets |
| TIKR | Free tier available | Historical financials, transcripts, consensus estimates | Comprehensive single-platform earnings analysis |
| Quartr | Free tier available | Earnings call transcripts and audio | Reviewing management language changes across quarters |
| AlphaSense | Limited free; enterprise pricing | AI-powered cross-call language analysis | Surfacing subtle guidance language shifts over time |
| Seeking Alpha | Freemium | Transcripts, community analysis | Core transcript access without a subscription |
| Earnings Whispers | Free tier available | Whisper number tracking | Understanding the market’s unofficial expectation vs. published consensus |
| Broker platforms | Free (with account) | Consensus EPS and revenue estimates | Fidelity, Schwab, and E*TRADE integrate estimates directly into stock pages |
SEC EDGAR remains the foundation. Every other tool draws from the same filings available there for free. Building multi-year spreadsheets from EDGAR data remains one of the most effective practices for identifying the trends that single-quarter snapshots obscure.
The quarterly reporting cadence that structures the entire earnings calendar is itself under regulatory review: the SEC proposed in May 2026 to allow eligible domestic companies to switch from four annual filings to two, a change that would extend information gaps between disclosures and alter how investors build the multi-period trend comparisons this guide relies on.
The stock price reaction to earnings is driven by forward guidance, margin trends, and cash flow quality, not by whether a headline EPS number beat a consensus estimate. The framework covered in this guide condenses into a repeatable workflow: check consensus estimates before reading; go directly to guidance; examine margin direction; verify cash flow quality; read the earnings call for language precision; compare against multi-period trends; separate GAAP from non-GAAP; and use the tools that make institutional-grade data accessible.
Investors with a multi-year holding horizon can afford to process earnings over days rather than minutes, which eliminates the algorithmic speed disadvantage entirely. The pressure to react immediately is artificial.
One practical step to start: identify one company on your watchlist, pull up its last three 10-Q filings on SEC EDGAR, and compare the guidance language across the three periods before reading any analyst commentary. The patterns will be visible.
This article is for informational purposes only and should not be considered financial advice. Investors should conduct their own research and consult with financial professionals before making investment decisions.
Forward guidance is management's projection for the next quarter and full year, giving investors the most current information about a company's future earning power. It matters because stock prices reflect expected future earnings, meaning guidance revisions move prices more than whether a reported quarter beat or missed consensus estimates.
Start by checking consensus estimates before reading the report, then go directly to the guidance section, examine margin direction, verify that operating cash flow aligns with net income, and read the earnings call transcript for changes in management language. Finally, compare the results against at least four to eight quarters of historical trends rather than treating the quarter in isolation.
A stock can fall after a beat when the company fails to raise forward guidance, because prices reflect the next 12 months of expected earnings rather than last quarter's results. If guidance is unchanged or lowered, the market reprices the forward earnings curve downward even though the reported quarter cleared the consensus bar.
GAAP earnings follow standardised accounting rules mandated by the SEC, while non-GAAP earnings exclude items management labels as non-recurring, such as stock-based compensation, restructuring charges, and acquisition costs. Investors should examine every exclusion in the reconciliation table, because items described as one-time often recur quarter after quarter.
SEC EDGAR provides free access to all 10-Q, 10-K, and 8-K filings and is the authoritative primary source for earnings data. TIKR, Quartr, Seeking Alpha, and Earnings Whispers all offer free tiers covering historical financials, earnings call transcripts, and whisper number tracking alongside published consensus estimates.