AI Sounds Like a Financial Adviser, but It Isn’t One
2 hrs ago

At a current share price of $37.44, Westpac Banking Corporation (ASX: WBC) looks like either a bargain or a fair price depending entirely on which model an investor applies. A Dividend Discount Model, built with consistent inputs, produces a valuation range of roughly $34 to $49. The gap between those two figures is not a flaw in the model; it is the model working as intended, because the output is only as reliable as the assumptions feeding it. This guide walks through the DDM step by step using Westpac as a live worked example. By the end, readers will understand the three required inputs, how to account for franking credits, how to read a sensitivity table, and where the model reaches its limits. The framework applies to any dividend-paying ASX stock.
The Dividend Discount Model requires one thing above all else: predictable, recurring dividends. Without that, the formula’s assumption of perpetual cash distributions collapses. Australian banks satisfy this requirement more cleanly than almost any other category on the ASX.
Three structural characteristics make bank stocks particularly well suited to DDM analysis:
As Rask Media noted in January 2026: “A DDM, which stands for Dividend Discount Model, is a more interesting and robust way of valuing companies in the banking sector, given that the dividends are pretty consistent.”
The DDM formula origins trace back to John Burr Williams in 1938, developed as a direct response to the speculative excesses of the 1920s bull market; his core insight, that a stock’s value derives from its future income stream rather than its resale price, remains the intellectual foundation of everything in this guide.
Australian bank stocks represent roughly one-third of total ASX market capitalisation by the All Ordinaries Index. That weighting alone makes DDM a tool worth learning for any domestic equity investor.
The S&P/ASX 200 sector weights published by S&P Dow Jones Indices show Financials comprising approximately 40% of the index as of April 2026, a concentration that makes fluency with dividend-based valuation methods a practical necessity for any investor building exposure to Australian equities.
Companies that retain most of their earnings, whether technology firms reinvesting in product development or miners still in the exploration phase, produce unreliable DDM outputs. The model treats dividends as the primary value mechanism. When a company pays no dividend, or pays one that fluctuates sharply with project cycles, the model’s perpetual-growth assumption becomes meaningless.
This contrast helps identify when to reach for DDM and when to use alternatives such as discounted cash flow analysis or price-to-earnings multiples. DDM is a precision instrument for income-producing stocks, not a universal valuation calculator.
The Gordon Growth Model formula is deceptively simple: Intrinsic Value equals the Dividend divided by the Discount Rate minus the Growth Rate. Three inputs, one division. The complexity is not in the arithmetic. It sits in the choices behind each number.
The three inputs, in sequence:
Each is a variable the analyst must consciously choose rather than look up. Reasonable people can disagree on all three.
| Input | What it represents | WBC working value |
|---|---|---|
| Starting dividend | Most recent full-year ordinary dividend | $1.51 per share (FY24 ordinary) |
| Growth rate | Long-term annual dividend growth assumption | 2.5% (base case) |
| Discount rate | Required return / cost of equity | 10% (base case) |
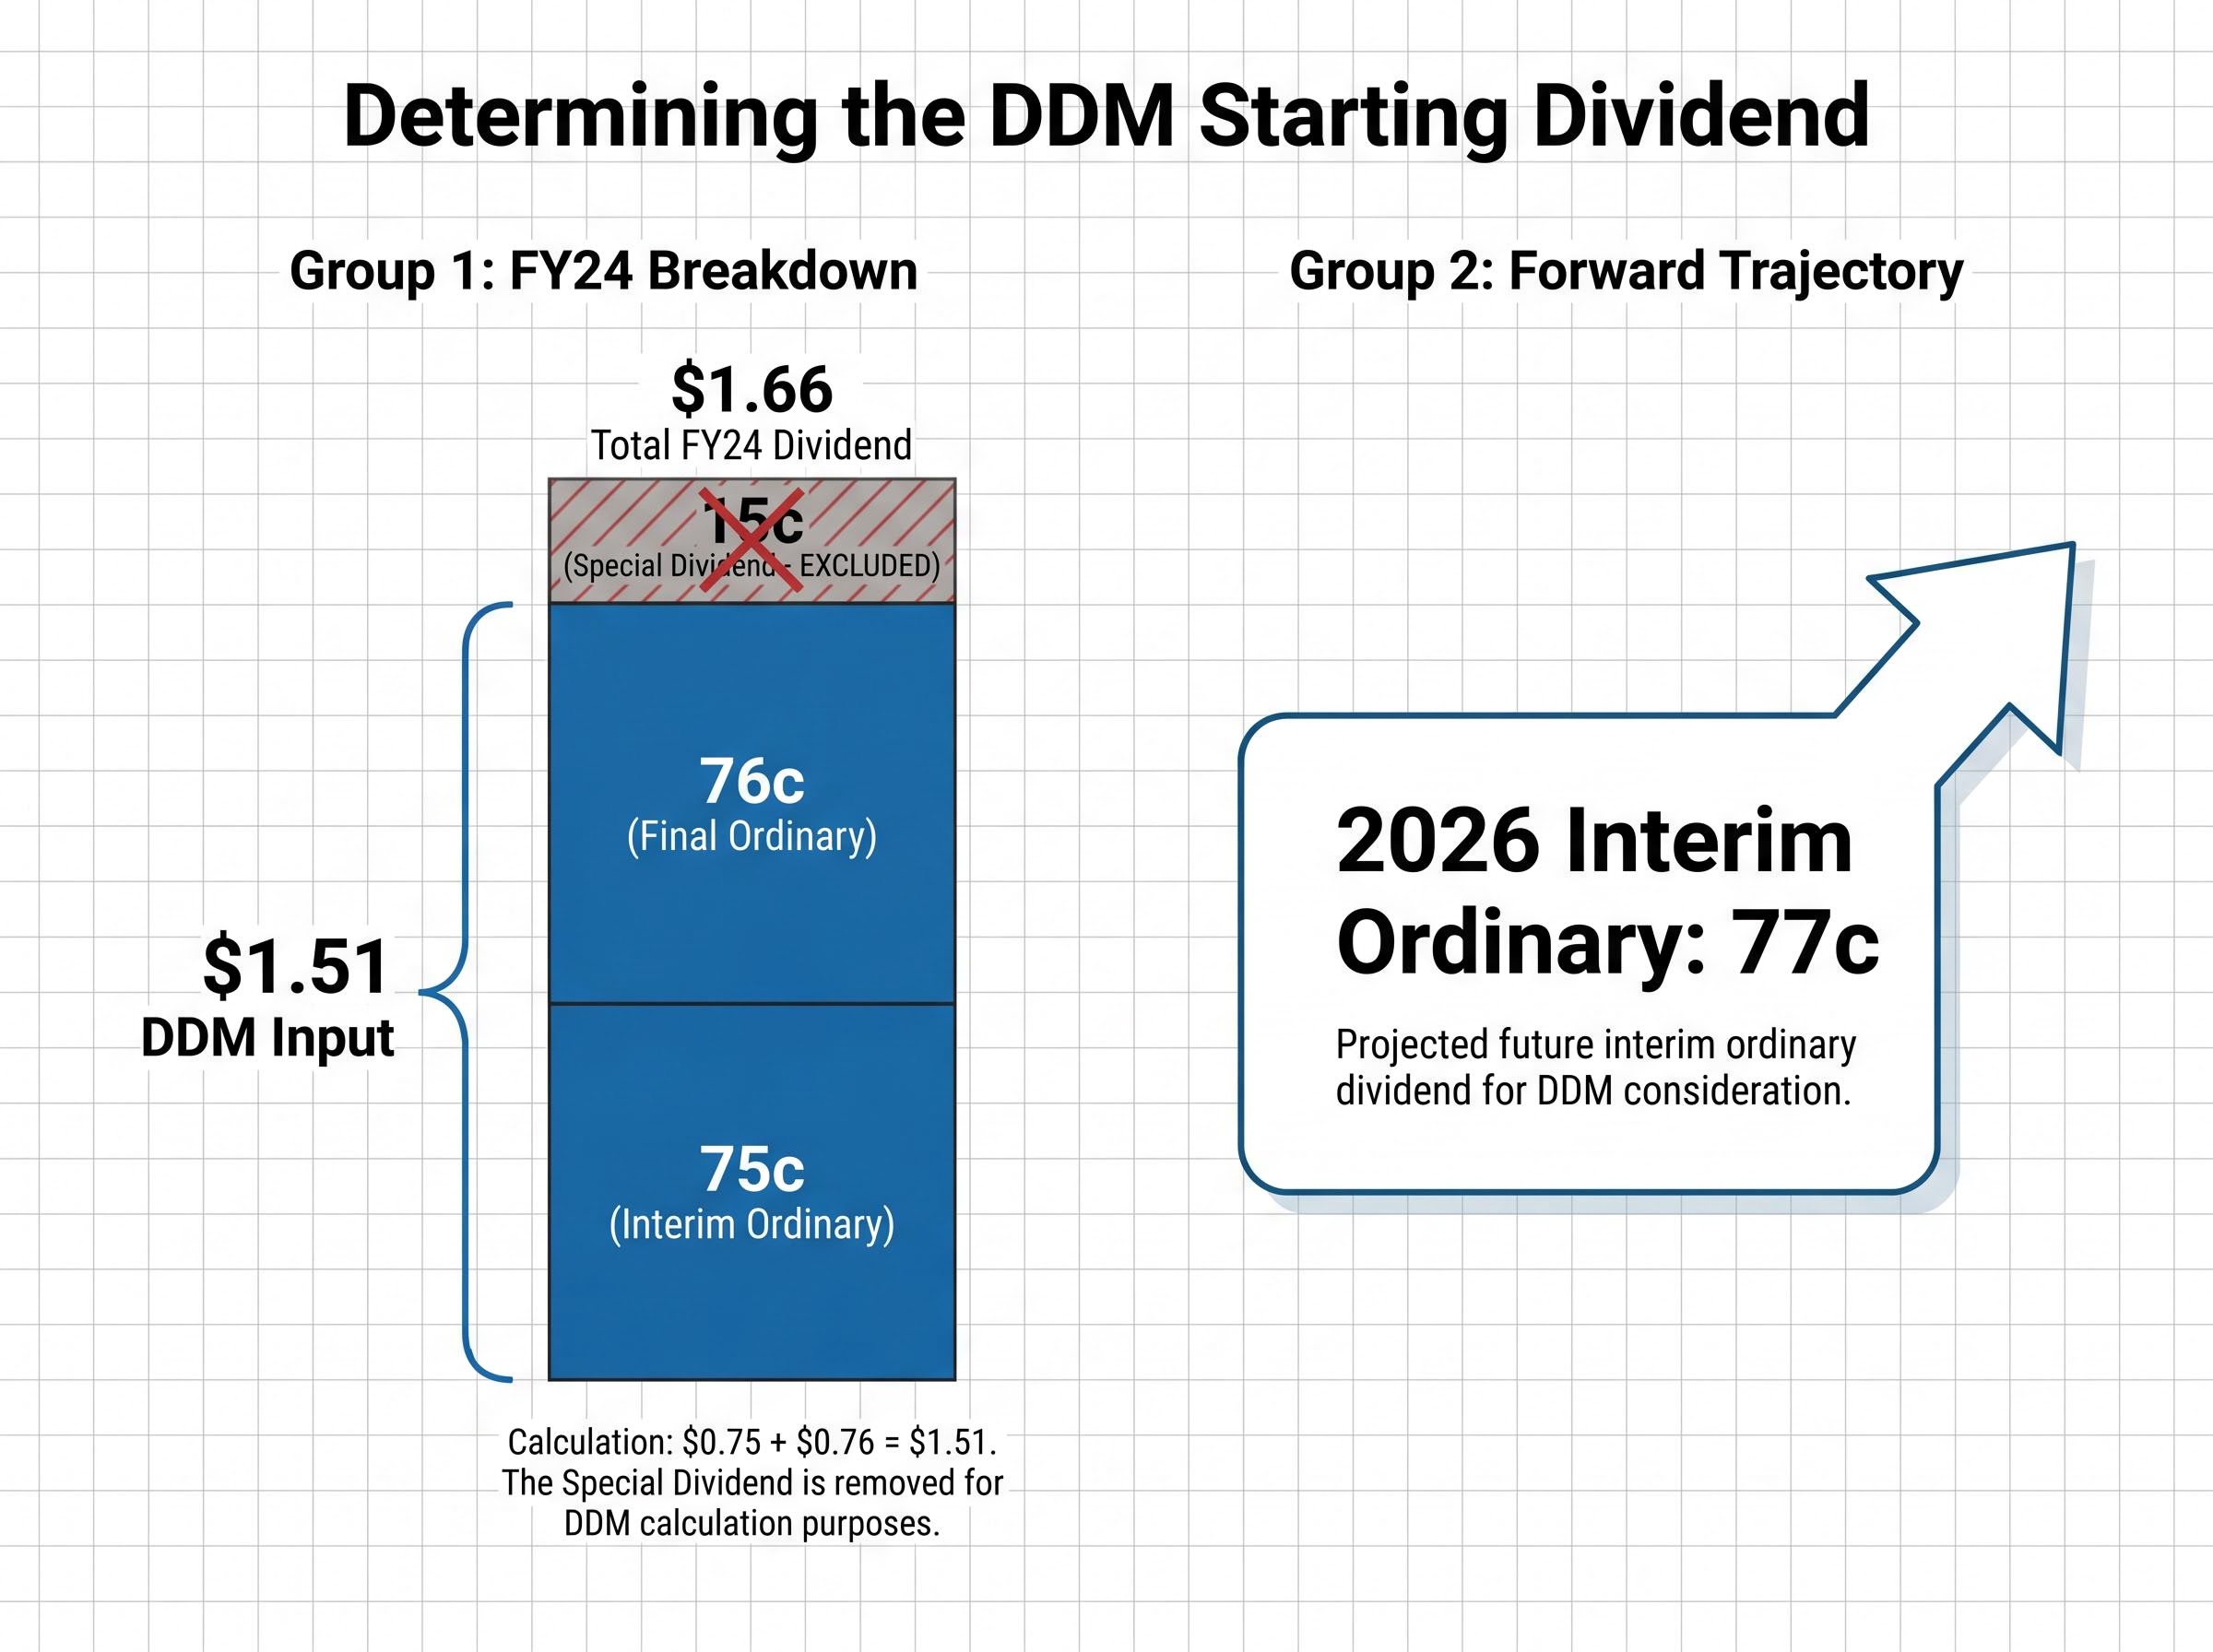
Starting dividend: why $1.51, not $1.66. Westpac paid a total of $1.66 per share in FY24, but 15 cents of that was a special dividend. Special dividends are non-recurring by definition. Including one in the DDM base implies it will repeat every year in perpetuity, inflating the valuation. The ordinary dividend of $1.51 is the methodologically correct input.
Growth rate: anchored to GDP. Long-term Australian GDP growth consensus sits at 2.0-2.6% as of May 2026, according to the RBA Statement on Monetary Policy. A 3% growth assumption is modestly optimistic relative to this consensus. The base case of 2.5% sits within the consensus range.
Discount rate: the CAPM link. The discount rate is derived from the Capital Asset Pricing Model: the risk-free rate (anchored to the RBA cash rate, currently 4.35% as of 5 May 2026) plus an equity risk premium. A 10% base case with a 9-11% sensitivity range is consistent with published Australian educational examples from SelfWealth and Rask Media.
“A DDM, which stands for Dividend Discount Model, is a more interesting and robust way of valuing companies in the banking sector, given that the dividends are pretty consistent.” — Rask Media, January 2026
With the three inputs established, the calculation itself takes five steps. Each builds on the last.
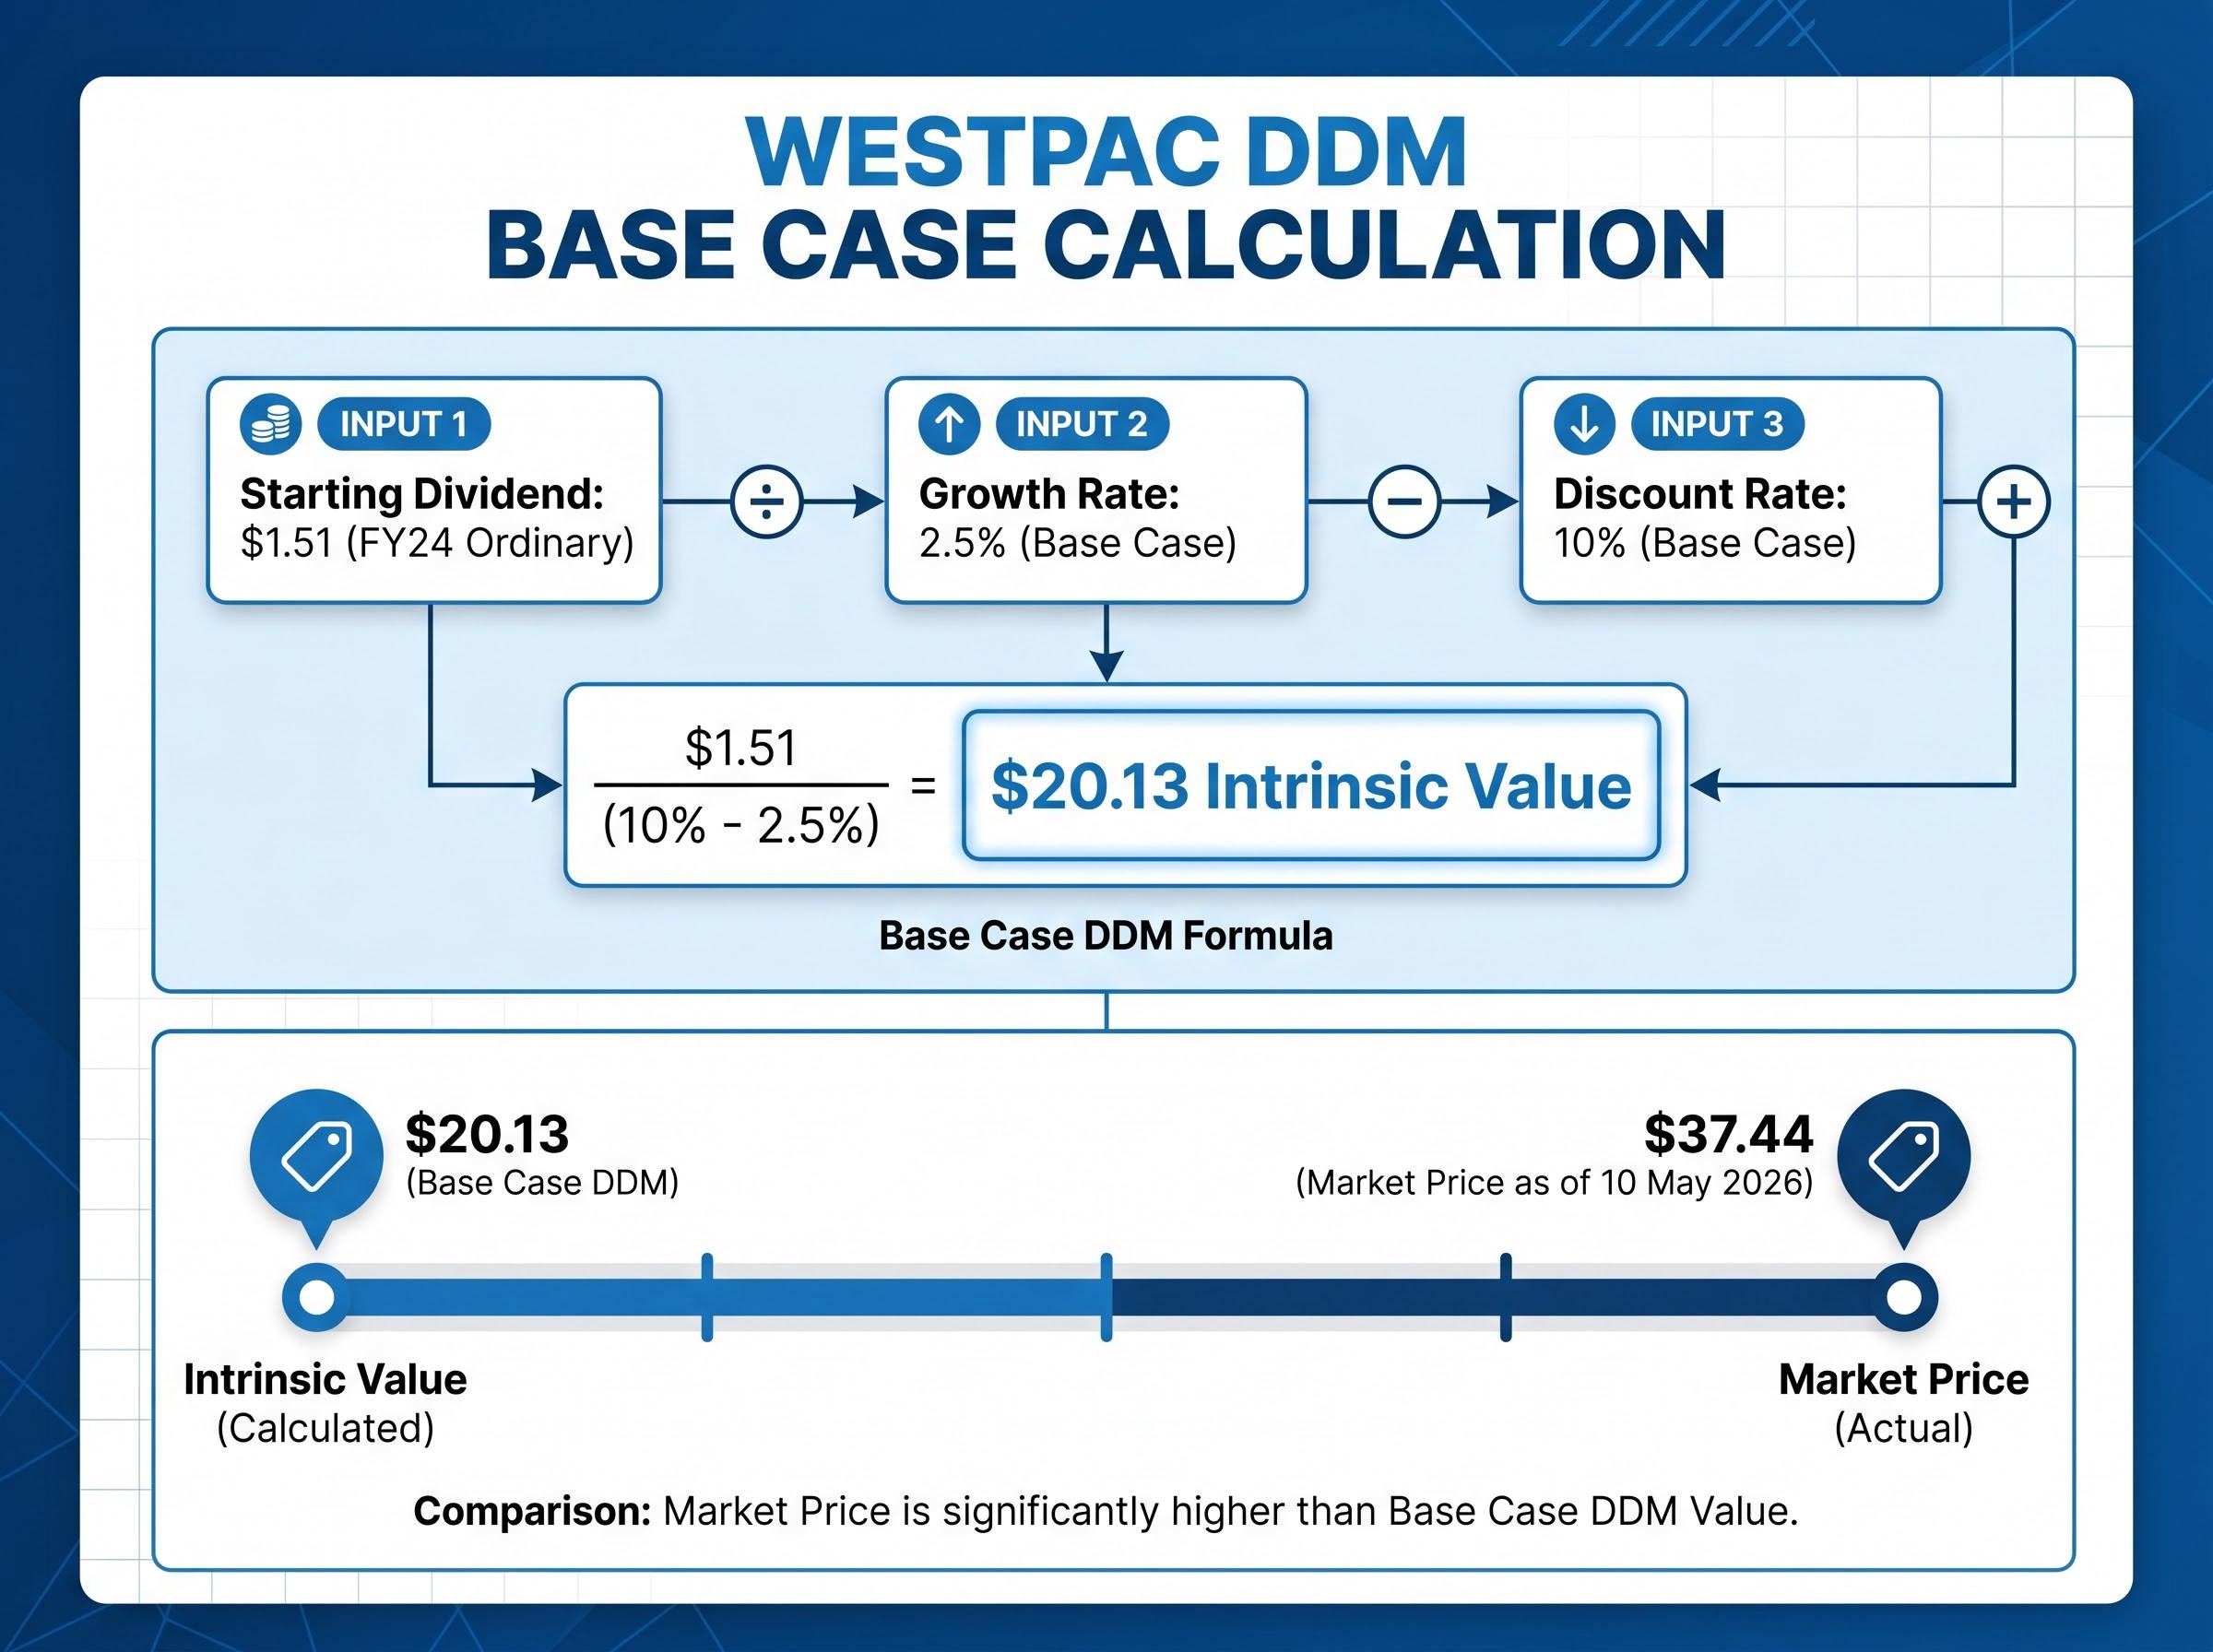
That base-case result of $20.13 sits well below the current market price. This is not an error; it is exactly why the sensitivity table in the next section matters.
A single base-case output is a starting point, not a conclusion. The $20.13 figure tells the analyst that at a 10% required return and 2.5% growth, the model implies Westpac is overvalued. But the discount rate assumption is the pivotal variable. A modest reduction from 10% to 9% produces a materially different result.
Treat this number as one data point in a range. The sensitivity analysis is what gives it analytical weight.
One additional data point supports the forward trajectory: Westpac announced a 2026 interim ordinary dividend of 77 cents on 5 May 2026 (payable 26 June 2026), confirming modest growth from the FY24 ordinary base.
The power of DDM sits not in the single output but in the range of outputs produced when assumptions shift. A sensitivity table varies two inputs simultaneously, typically the discount rate and the growth rate, to show how the valuation moves across plausible scenarios.
The table below applies the same Westpac starting dividend of $1.51 across nine combinations of discount rate (9%, 10%, 11%) and growth rate (2.0%, 2.5%, 3.0%).
| Growth rate | Discount rate 9% | Discount rate 10% | Discount rate 11% |
|---|---|---|---|
| 2.0% | $21.57 | $18.88 | $16.78 |
| 2.5% | $23.23 | $20.13 | $17.76 |
| 3.0% | $25.17 | $21.57 | $18.88 |
The range spans from $16.78 to $25.17 using cash dividends alone. Source material notes that across a wider range of assumptions, DDM sensitivity outputs can span from $17.89 to $80.50, reinforcing that extreme assumptions produce extreme results.
RBA rate context: The cash rate was raised to 4.35% on 5 May 2026, the third rate hike in 2026. Higher cash rates lift the risk-free rate component of the discount rate and, all else equal, compress DDM valuations. This is a live consideration for any DDM built in the current environment.
The table above uses the cash dividend of $1.51. For eligible Australian resident shareholders, the effective dividend is higher because Westpac’s dividends are fully franked.
A fully franked $1.51 dividend carries a corporate tax credit attached at the 30% company tax rate. The gross dividend calculation: $1.51 divided by (1 minus 0.30) equals approximately $2.16. Running the DDM with $2.16 rather than $1.51 produces higher intrinsic value estimates across the entire sensitivity matrix.
The grossed-up dividend calculation follows a consistent formula regardless of which ASX stock is being assessed: multiply the cash dividend by 30 and divide by 70, reflecting the 30% corporate tax already remitted by the company, which converts Westpac’s $1.51 ordinary dividend into an effective $2.16 for eligible investors before the sensitivity table is even built.
Not all Australian investors can fully utilise franking credits. Superannuation funds in accumulation phase, some individuals with complex tax positions, and non-resident shareholders may not receive the full benefit. The gross dividend DDM should be treated as the upper bound of a range rather than a universal adjustment.
As a cross-check, Rask Media’s January 2026 dividend-yield-based analysis implied a Westpac valuation of approximately $38.74, which sits closer to the franking-adjusted DDM range and the current market price of $37.44.
A model that assumes dividends grow in perpetuity will, by definition, fail when dividends stop or shrink. For bank stocks specifically, three failure modes deserve attention:
DDM is most reliable as one input within a broader analytical framework. Signals to cross-check against the DDM output include:
Price-to-earnings cross-checks sit alongside DDM in any complete bank valuation toolkit: the banking sector’s current PE of approximately 22.7x is significantly above its three-year average of 17.6x, which means the same stock can appear reasonably valued under a franking-adjusted DDM while simultaneously appearing stretched relative to historical peer multiples.
Research from industry sources notes that comprehensive bank investment assessment may involve extensive qualitative analysis before financial modelling begins.
Common Equity Tier 1 (CET1) is the primary measure of a bank’s core capital buffer: the highest-quality capital a bank holds, expressed as a percentage of its risk-weighted assets. APRA sets minimum CET1 thresholds, and dividends can only flow from earnings that sit above those thresholds.
A bank whose CET1 ratio is under pressure will reduce or suspend dividends regardless of what the DDM model assumes. APRA announced consultations in March 2026 on enhancements to bank capital and liquidity frameworks, including reforms to risk weightings for infrastructure lending. Monitoring these developments is a practical necessity for anyone relying on DDM to value Australian bank shares.
APRA Prudential Standard APS 110 specifies that capital distribution constraints apply automatically when a bank’s CET1 ratio falls within the extended capital buffer range, meaning dividend restrictions are triggered by the regulatory framework itself rather than by a board decision alone.
The DDM framework is a discipline for thinking rigorously about the present value of future income. It is not a calculator that produces a definitive answer. The value lies in the process: forcing explicit assumptions about dividends, growth, and required returns, then stress-testing those assumptions across a range.
The reusable five-step process:
Input quality drives output quality. A DDM built on special dividends, an unjustified growth rate, or a discount rate that ignores the current RBA environment will produce a misleading valuation regardless of how correctly the formula is applied. The same framework applies to any fully franked, dividend-paying ASX stock, making DDM a transferable analytical skill rather than a one-off exercise.
For investors who have worked through the DDM framework and now want to build a portfolio around it, our comprehensive walkthrough of ASX dividend portfolio construction covers payout ratio analysis, the 45-day holding rule for franking credit eligibility, dividend reinvestment plan compounding, and the warning signs that distinguish a genuine high yield from a dividend trap about to be cut.
Data currency note: The inputs used in this guide reflect conditions as of 10 May 2026. The WBC share price, the most recent ordinary dividend, the RBA cash rate (4.35%), and Australian GDP growth forecasts all require periodic refresh as conditions change. Westpac’s 2026 interim ordinary dividend of 77 cents (announced 5 May 2026) signals continued modest growth from the FY24 ordinary base of $1.51 and can be used to update the model when the full FY25 figure is available.
This article is for informational purposes only and should not be considered financial advice. Investors should conduct their own research and consult with financial professionals before making investment decisions. Past performance does not guarantee future results. Financial projections are subject to market conditions and various risk factors.
The Dividend Discount Model (DDM) is a valuation method that estimates a stock's intrinsic value based on the present value of its future dividend payments. The Gordon Growth Model version uses three inputs: the starting dividend, a long-term growth rate, and a required return (discount rate), divided into a single formula to produce an estimated share price.
Australian banks like Westpac pay consistent, high-payout dividends regulated by APRA, making their future distributions more predictable than most other ASX sectors. This predictability satisfies the DDM's core assumption of recurring cash distributions, which is why analysts frequently apply it to the banking sector.
Franking credits represent corporate tax already paid by the company, and eligible Australian resident shareholders can add this back to the cash dividend before running the DDM. For Westpac's fully franked $1.51 ordinary dividend, the grossed-up value is approximately $2.16, which produces higher intrinsic value estimates across the entire sensitivity table.
Special dividends are non-recurring by definition, so including them in the DDM base implies they will be paid every year in perpetuity, artificially inflating the valuation. For Westpac's FY24 total of $1.66 per share, only the $1.51 ordinary dividend is the methodologically correct starting input.
The DDM breaks down when dividends are cut during financial stress, when regulators like APRA restrict distributions regardless of earnings, or when structural changes to payout ratios permanently shift the sustainable dividend level. It is most reliable as one input within a broader analytical framework that also considers price-to-book ratios, CET1 capital ratios, and qualitative factors.