In 1929, a young Wall Street analyst watched the speculative bubble collapse around him and decided the entire industry had been asking the wrong question. That analyst was John Burr Williams, and the framework he built in response became one of modern finance’s most enduring valuation tools.
The dividend discount model is taught in CFA curricula worldwide and remains central to how Australian fund managers and retail investors assess dividend-paying equities. Its origins in crisis, and the philosophical argument it was built to make, are rarely told alongside the formula. What follows traces the DDM from its crash-era beginnings through its mechanical logic, its philosophical underpinnings, its practical use for Australian income investors today, and the reasons its founding argument feels newly urgent amid 2025’s speculative environment.
From the trading floor to Harvard: How a market crash built a valuation model
John Burr Williams was not an academic theorist who wandered into finance. He worked in 1920s financial markets, watching the speculative mania build from the inside. When the crash came, and the Depression followed, he did not simply move on. He enrolled at Harvard to answer a question that the trading floor had failed to address: how should an asset actually be valued?
That choice was an act of inquiry, not retreat. Williams wanted to understand, in systematic terms, what had gone wrong with the way Wall Street priced securities. The answer, he believed, lay in the gap between what companies paid their shareholders and what speculators imagined someone else might later pay for the stock.
The doctoral thesis that became a foundational text
Williams’ Harvard doctoral thesis examined the crash, the Great Depression, and the question of how assets should properly be valued. The resulting publication, The Theory of Investment Value (1938), gave the finance world a systematic alternative to price-momentum thinking, approximately 11 years before Benjamin Graham published The Intelligent Investor.
Graham was among the first to review Williams’ published work, praising its dividend-focused framework as a corrective to the speculative excesses that had defined the previous decade.
That a practitioner of Graham’s stature endorsed the thesis so early speaks to the force of Williams’ central claim: that a stock’s value is not what someone will pay for it tomorrow, but what it will pay you over time.
When big ASX news breaks, our subscribers know first
What the dividend discount model actually says
The DDM makes a single, specific claim: a stock’s intrinsic value equals the present value of all the dividends it will ever pay. Every other element of the model, the formula, the variables, the growth assumptions, follows from that foundational idea.
Before reaching the formula, it helps to understand what each component asks of the investor:
- D1: The dividend expected in the next period. This requires a judgment about the company’s near-term payout.
- r: The required rate of return. This is the minimum annual return the investor demands for holding the stock instead of a risk-free alternative.
- g: The constant dividend growth rate. This requires a judgment about how durably the company can grow its payments over time.
The most widely used formulation is the Gordon Growth Model:
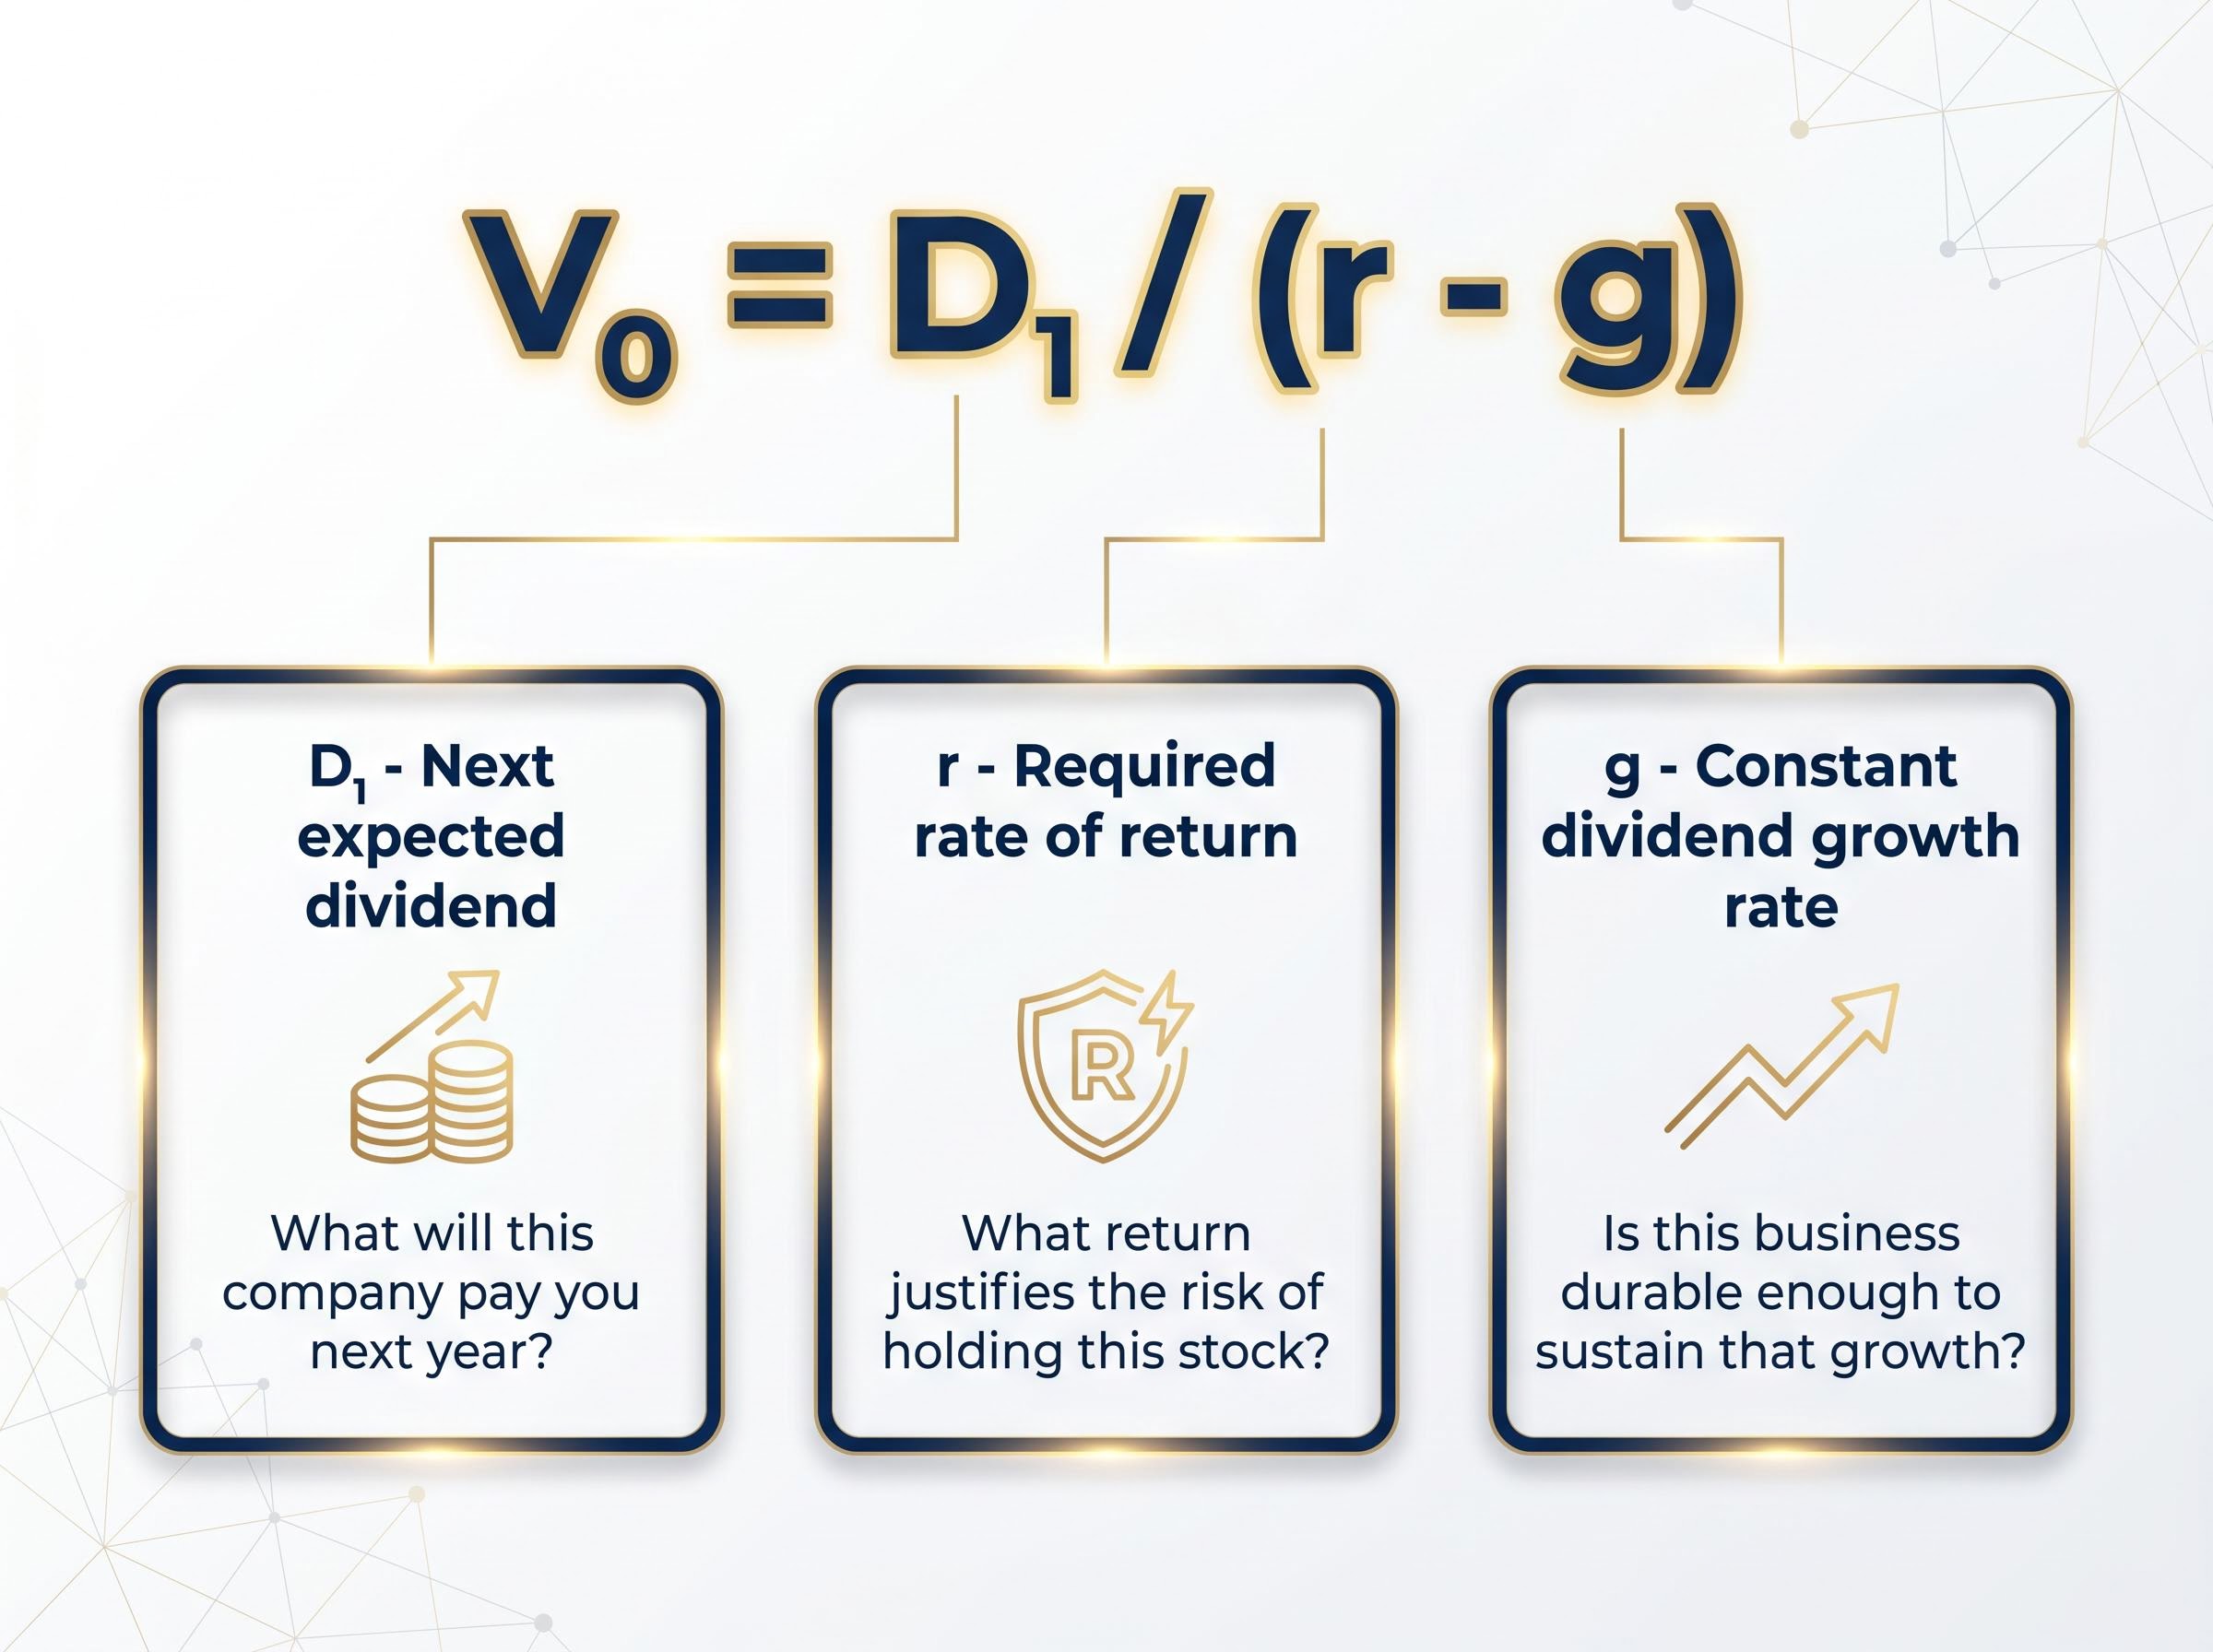
V₀ = D₁ / (r – g)
| Variable | What it means | The practical question it asks |
|---|---|---|
| D1 | Next expected dividend | What will this company pay you next year? |
| r | Required rate of return | What return justifies the risk of holding this stock? |
| g | Constant dividend growth rate | Is this business durable enough to sustain that growth? |
The relationship can also be rearranged: D1/P0 + g = r. In plain terms, the dividend yield plus the growth rate equals the investor’s expected return. This reframing turns the formula into a diagnostic question: does the income this stock promises, combined with the growth it can deliver, meet the return the investor requires?
Calibrating the required rate of return (r) in the Gordon Growth Model demands a clear view of risk and return across asset classes; with Australian high-interest savings accounts paying up to 5.65% p.a. in mid-2026, the opportunity cost of holding equities over cash is unusually compressed, which pushes the hurdle rate for dividend-paying stocks higher than historical norms suggest.
The CFA Institute affirms DDMs as core equity valuation tools within the broader discounted cash flow family, a lineage that traces directly to Williams’ 1938 work.
The CFA Institute discounted dividend valuation curriculum treats the DDM as a core component of the discounted cash flow family, confirming that the profession’s flagship credentialing body regards Williams’ income-based framework as essential to rigorous equity analysis.
Investors versus speculators: The philosophical argument behind the formula
Williams did not simply build a formula. He drew a line between two types of people in financial markets and argued that one was doing something fundamentally different from the other. Investors, in his framing, were motivated by dividend income: the cash a business would actually pay them. Speculators were chasing price gains: betting that someone else would pay more later.
This was not an academic categorisation. It was a verdict on what had gone wrong in the 1920s. Williams saw the crash as the inevitable result of an entire market oriented around the speculator’s question (“What will someone else pay?”) rather than the investor’s question (“What will this business pay me?”).
He made the point memorably. Williams compared stocks to productive assets: dairy cattle valued by their milk, fruit orchards valued by their harvest.
A stock, Williams argued, should be valued the way a farmer values a cow: not by what the cow might sell for at auction, but by the milk it will produce over its lifetime.
The metaphor is simple, but the implication is sharp. If an asset’s value comes from what it yields, then any price untethered from that yield is speculation by definition.
Graham’s verdict on Williams’ framework
Benjamin Graham reviewed The Theory of Investment Value early and endorsed its central claim. Graham’s own framing brought the two thinkers into close alignment: reinvested earnings, he argued, derive their value from the future dividends they make possible. An earnings stream that never converts to shareholder income has no tangible value to the owner.
That alignment matters. It means the two most influential valuation thinkers of the twentieth century converged independently on the same principle: price divorced from income is a bet, not an investment.
How the model works in practice for Australian income investors
The DDM’s practical strength lies in companies where dividend trajectories are reasonably foreseeable. In the Australian market, that means banks, utilities, real estate investment trusts (REITs), and infrastructure companies, sectors with established payout histories and relatively stable cash flows.
A practitioner approach works by projecting future dividends using analyst forecasts and historical dividend data, then discounting those projected payments back to a present value. The bulk of analytical effort goes not into the formula itself but into understanding the business: its competitive position, the durability of its earnings, and the industry conditions that support or threaten its payout.
Non-dividend cash flows, including buybacks and retained earnings, are treated as inputs that should ultimately support future dividend growth. This makes the DDM implicitly more conservative than full free-cash-flow approaches, because it values only what is actually returned to shareholders as income.
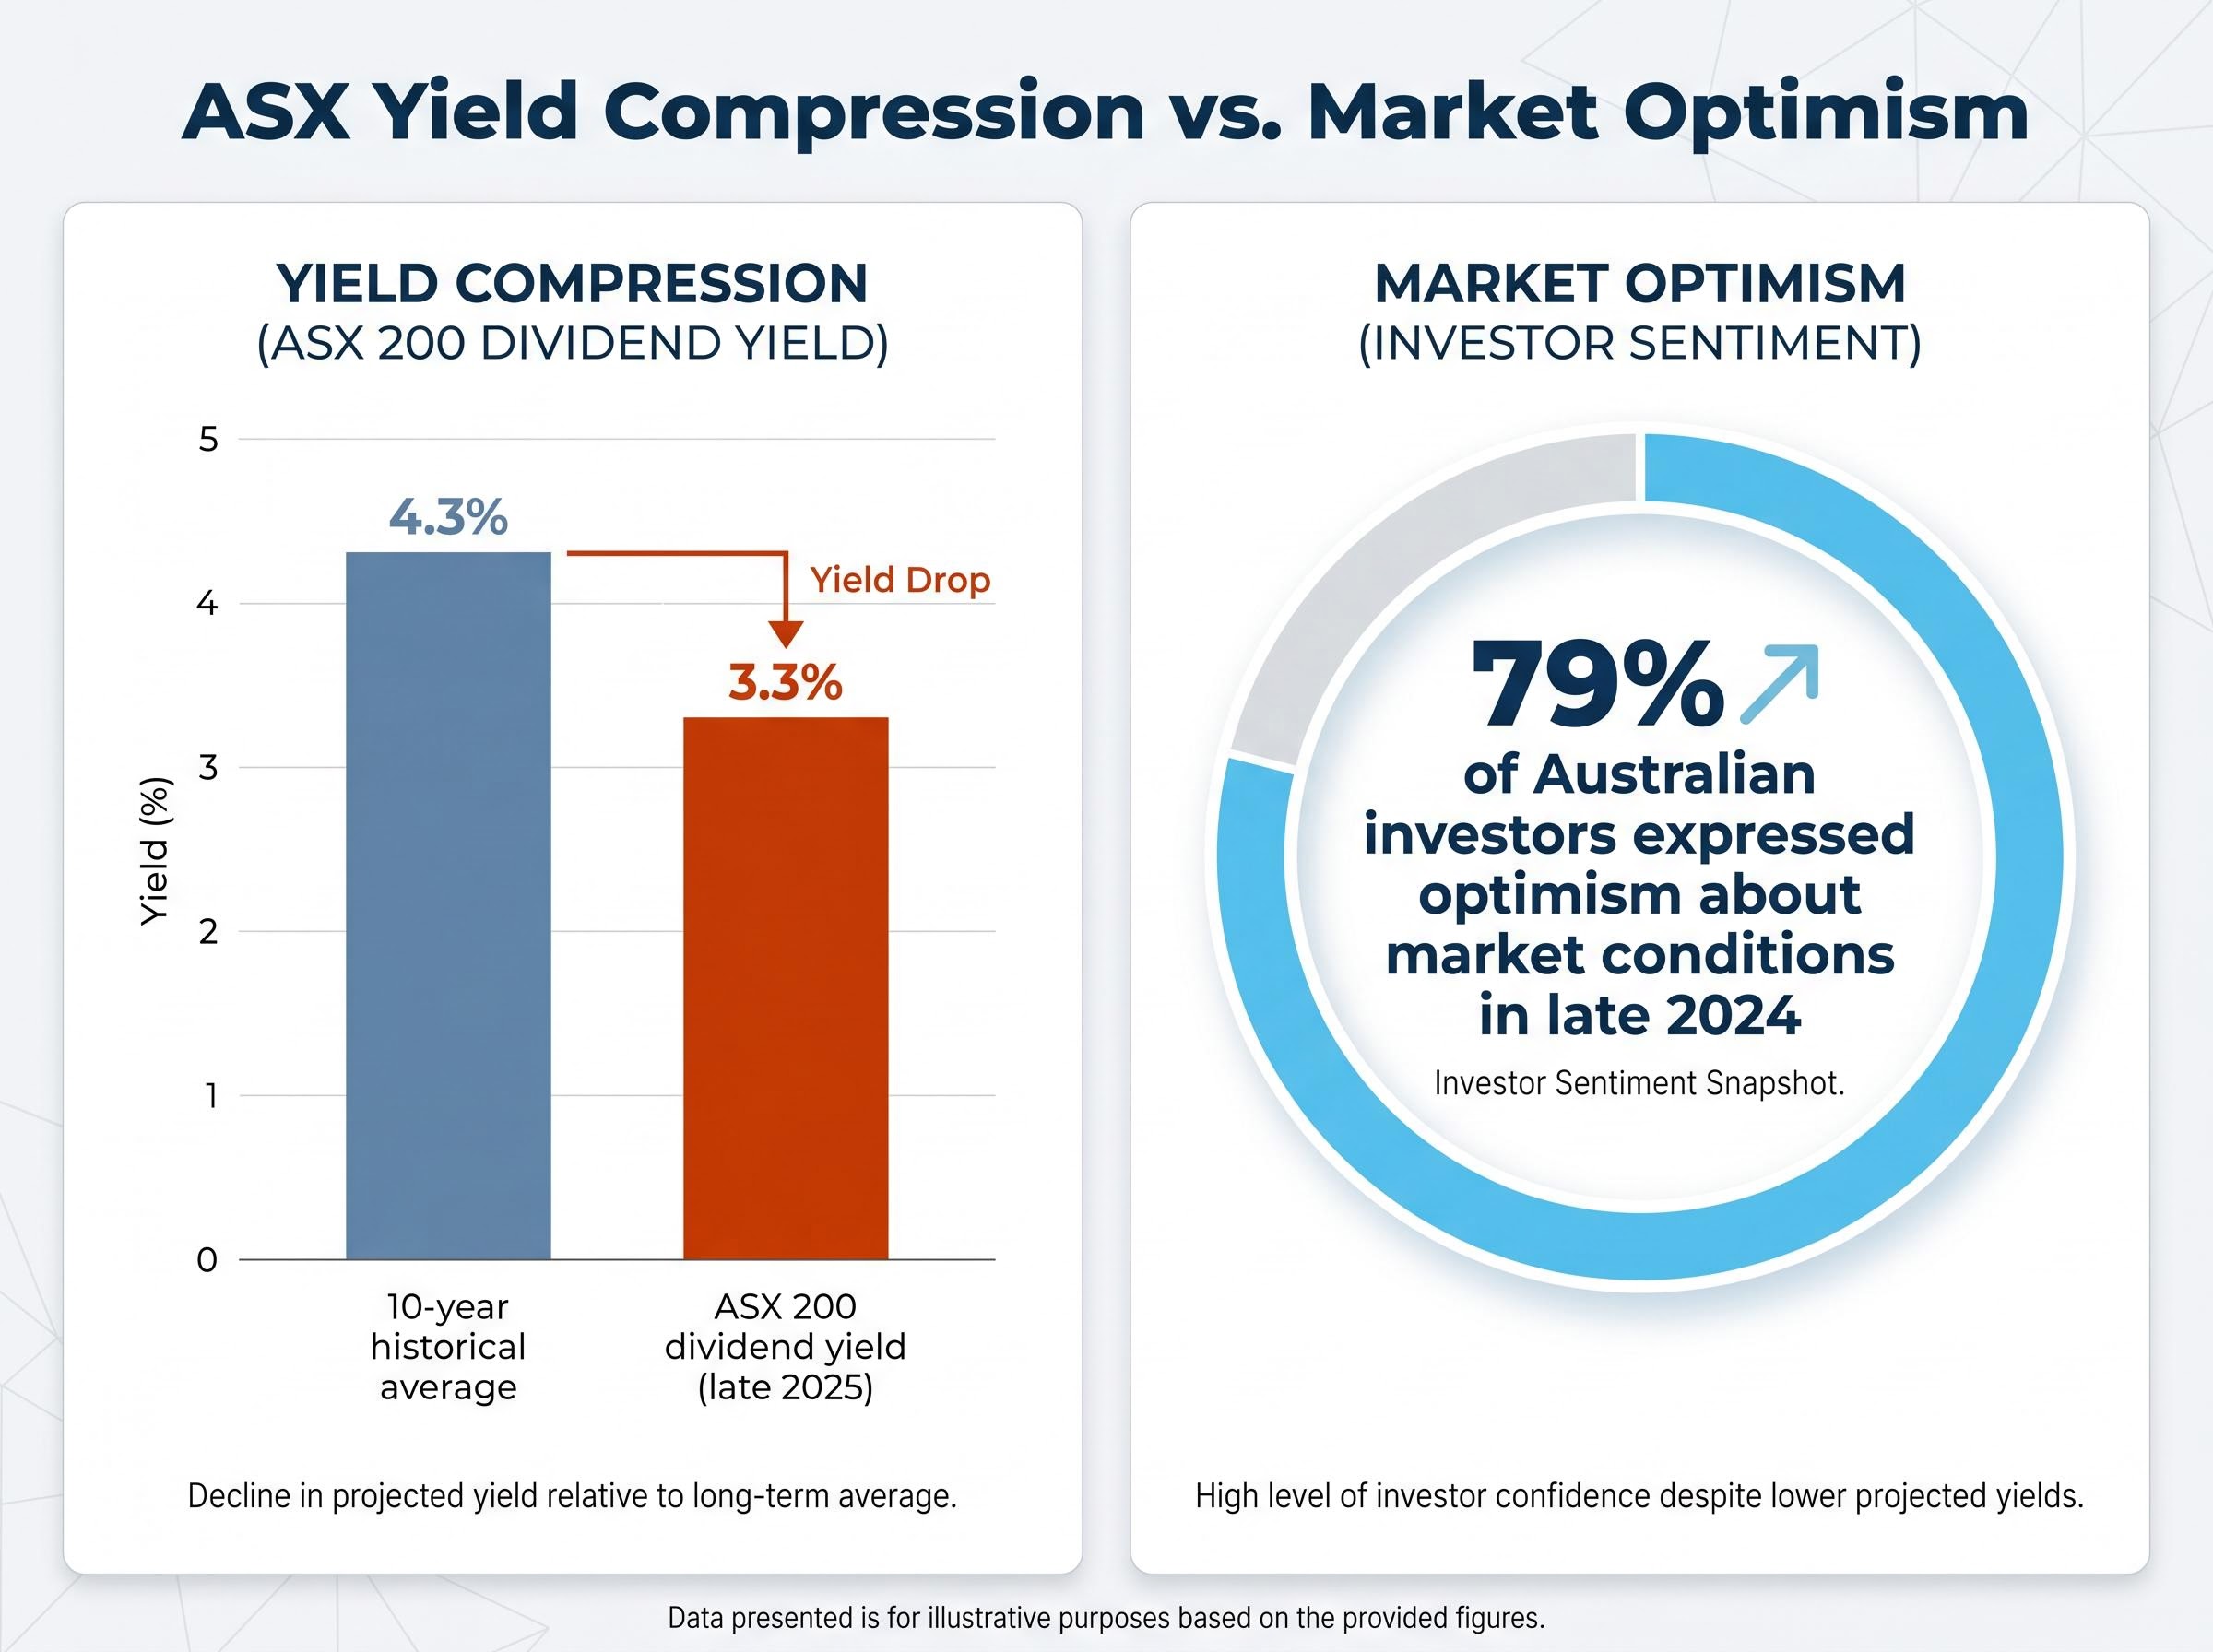
ASX 200 dividend yield (late 2025): approximately 3.3%, compared with a 10-year historical average of approximately 4.3%.
That gap matters. Superannuation fund returns were strong double-digit figures for FY2024-25, and approximately 79% of Australian investors expressed optimism about market conditions in late 2024. Optimism and strong returns can obscure the fact that income yields have compressed well below their long-term norms.
The yield compression visible in the ASX’s current 3.3% dividend yield becomes more significant when measured against real return benchmarks for Australian income portfolios; with CPI running at 4.6% as of March 2026, a portfolio anchored entirely in domestic dividend income is delivering a guaranteed negative real return before any valuation risk is considered.
| ASX sector | Typical dividend predictability | DDM applicability |
|---|---|---|
| Major banks | High | High |
| Utilities | High | High |
| REITs | Moderate to high | High |
| Infrastructure | Moderate to high | Moderate to high |
| Technology | Low | Low |
In a below-average yield environment, the DDM gives Australian income investors a structured way to ask whether current prices reflect fair value, or whether yield compression signals that dividend-paying stocks are priced beyond what their income streams justify.
Where the model has limits and what critics get wrong
The DDM attracts three recurring criticisms. Two of them are valid complaints about valuation modelling in general. One of them is a genuine limitation specific to the DDM.
- Inapplicability to non-dividend-paying companies. The model cannot value a company that does not pay, and has no intention of paying, dividends. This is a real constraint.
- Dependence on the accuracy of dividend forecasts. If growth assumptions are wrong, the valuation output is wrong. This is true, but it applies equally to every discounted cash flow model. A free-cash-flow DCF is just as sensitive to its growth inputs.
- Sensitivity to the chosen discount rate. Small changes in the required return produce large changes in the calculated value. Again, this is a characteristic of all present-value calculations, not a distinctive DDM weakness.
The second and third criticisms are features of discounting itself, not of the dividend approach specifically. Any valuation model that converts future cash flows to a present value shares these sensitivities.
The one criticism that sticks
The DDM’s genuine scope limitation is that it cannot assess companies that do not distribute dividends. Technology firms that return capital through buybacks, or reinvest entirely, fall outside the model’s design. For these companies, analysts default to free-cash-flow DCF models.
Technology stocks cited in bubble comparisons reached valuations equivalent to approximately 101% of US GDP in 2024-25, illustrating the class of companies for which the DDM is inapplicable. This is not a flaw in the model. It is a scope condition: the DDM does what it claims to do for the companies it is designed to assess.
The DDM and its variants continue to feature in the CFA Institute curriculum as foundational equity valuation tools, a status that reflects the profession’s judgment that the model’s utility within its scope remains strong.
Why a crash-era framework still matters in an AI boom
Williams built his framework in response to a market that had replaced income analysis with speculative momentum. Nearly a century later, the parallels are visible again.
The Wall Street Journal identified “eerie parallels” between the 2024-25 AI stock mania and the dot-com bubble in a December 2025 report.
GMO’s research in January 2026 examined whether the AI boom represents an extreme bubble, a new golden era, or both. The specific echoes of the 1920s are hard to dismiss:
GMO’s January 2026 bubble assessment, drawing on Jeremy Grantham’s analysis of the AI rally, explicitly weighs whether the concentration of capital in a single sector theme constitutes an extreme speculative episode or the early stage of a productivity-driven era, a distinction that carries direct implications for income-based valuation approaches.
- Debt-financed infrastructure investment in AI mirrors the leveraged speculation of the late 1920s
- Narrative-driven valuations have concentrated capital in a single sector theme
- Technology stock valuations reached approximately 101% of US GDP, echoing the concentration of earlier speculative periods
- Investor optimism has outpaced the income fundamentals that underpin long-term equity returns
Williams developed his framework as a direct corrective to exactly this pattern. The DDM and intrinsic value methodology anchor judgment to what a business will actually pay, rather than to what someone else might later offer for the shares. That discipline does not age.
The pattern Williams diagnosed in the 1920s, of sentiment diverging from economic fundamentals as narratives replace income analysis, is visible in contemporary data: retail investor bullishness in April 2026 reached 46.0% despite surging energy costs, compressed savings rates, and institutional warnings that equity valuations had priced out most of the available upside.
For Australian investors, the practical situation reinforces the point. With ASX dividend yields sitting well below their historical average and equity valuations elevated, the question Williams built his model to answer, “Is the income this stock will pay me worth the price I am being asked to pay?”, is precisely the right one.
A 1938 formula built for exactly the market we have now
Williams did not construct the dividend discount model as an academic exercise. He built it as a practical antidote to a specific kind of market failure, and that failure recurs. Whenever narrative replaces income as the basis for valuation, the DDM’s founding logic becomes freshly relevant.
For Australian income investors, the model offers a structured, disciplined way to assess whether the dividend income from a stable business justifies its current price. In a below-average yield environment, that question is not a theoretical one.
The lineage Williams established connects directly to the present. Every investor who asks what a dividend stream is worth, rather than what someone else might pay for the shares, is working within the framework a disillusioned 1920s analyst carried from the trading floor to Harvard and set down in 1938.
This article is for informational purposes only and should not be considered financial advice. Investors should conduct their own research and consult with financial professionals before making investment decisions.