
Why Harvest’s MicroStrategy ETF Is Down 90% but Still Running
3 hrs ago

Most income investors pick a covered call ETF based on its headline yield. A 12% figure looks better than a 7% figure on a spreadsheet. But after three years, the 12% fund may have returned more capital than income, leaving the investor with a smaller portfolio than when they started. The difference between those two outcomes is not luck or timing; it is fund design.
The covered call ETF universe has expanded considerably, and two structurally distinct fund types now coexist: index-proxy funds that cap upside in exchange for elevated distributions, and concentrated active funds that sacrifice some yield for NAV stability. Both serve legitimate purposes. The question investors increasingly face is not which type is superior, but how to combine them intelligently within a single portfolio.
This guide walks through the strategic logic of building a blended covered call ETF portfolio, covering yield tier selection, NAV sustainability thresholds, allocation ratios by investor type, and the specific warning signs that signal when a position needs rebalancing.
Every covered call ETF shares the same basic mechanism. The fund holds a portfolio of equities and sells call options on those holdings. The premium collected from selling those options is paid out as distributions. That premium is the source of the elevated yield that distinguishes these funds from conventional equity ETFs.
The mechanism is universal. What differs, and what drives the performance gap investors actually experience, is the design of the call overlay itself.
The covered call ETF structure debate has deepened as the distinction between equity-linked notes and FLEX options now carries a larger after-tax impact than headline yield differences of 1-2 percentage points for many investors evaluating these funds.
The structural fork separating covered call ETFs into two distinct categories comes down to where the strike price is set. Index-proxy funds such as QYLD and XYLD sell at-the-money (ATM) calls on a broad index. ATM calls are set at or near the current price of the index, meaning the fund surrenders all upside above the strike in exchange for maximum premium income.
Concentrated funds such as JEPI and JEPQ take a different approach. They sell out-of-the-money (OTM) calls, typically set 5-10% above the current price, on a smaller selection of actively managed holdings. OTM calls collect less premium per contract but allow the fund to participate in meaningful capital appreciation before the cap takes effect.
This single design choice drives most of the NAV divergence observed across fund types. Through April 2025, index-proxy funds averaged approximately -9.3% in one-year NAV change. Concentrated funds averaged approximately -2% over the same period. The yield gap mirrors the NAV gap: QYLD offered a trailing 12-month yield of 12.1%, while JEPI offered 7.8%.
The higher yield is not a bonus. It is compensation for the capital erosion embedded in the ATM design.
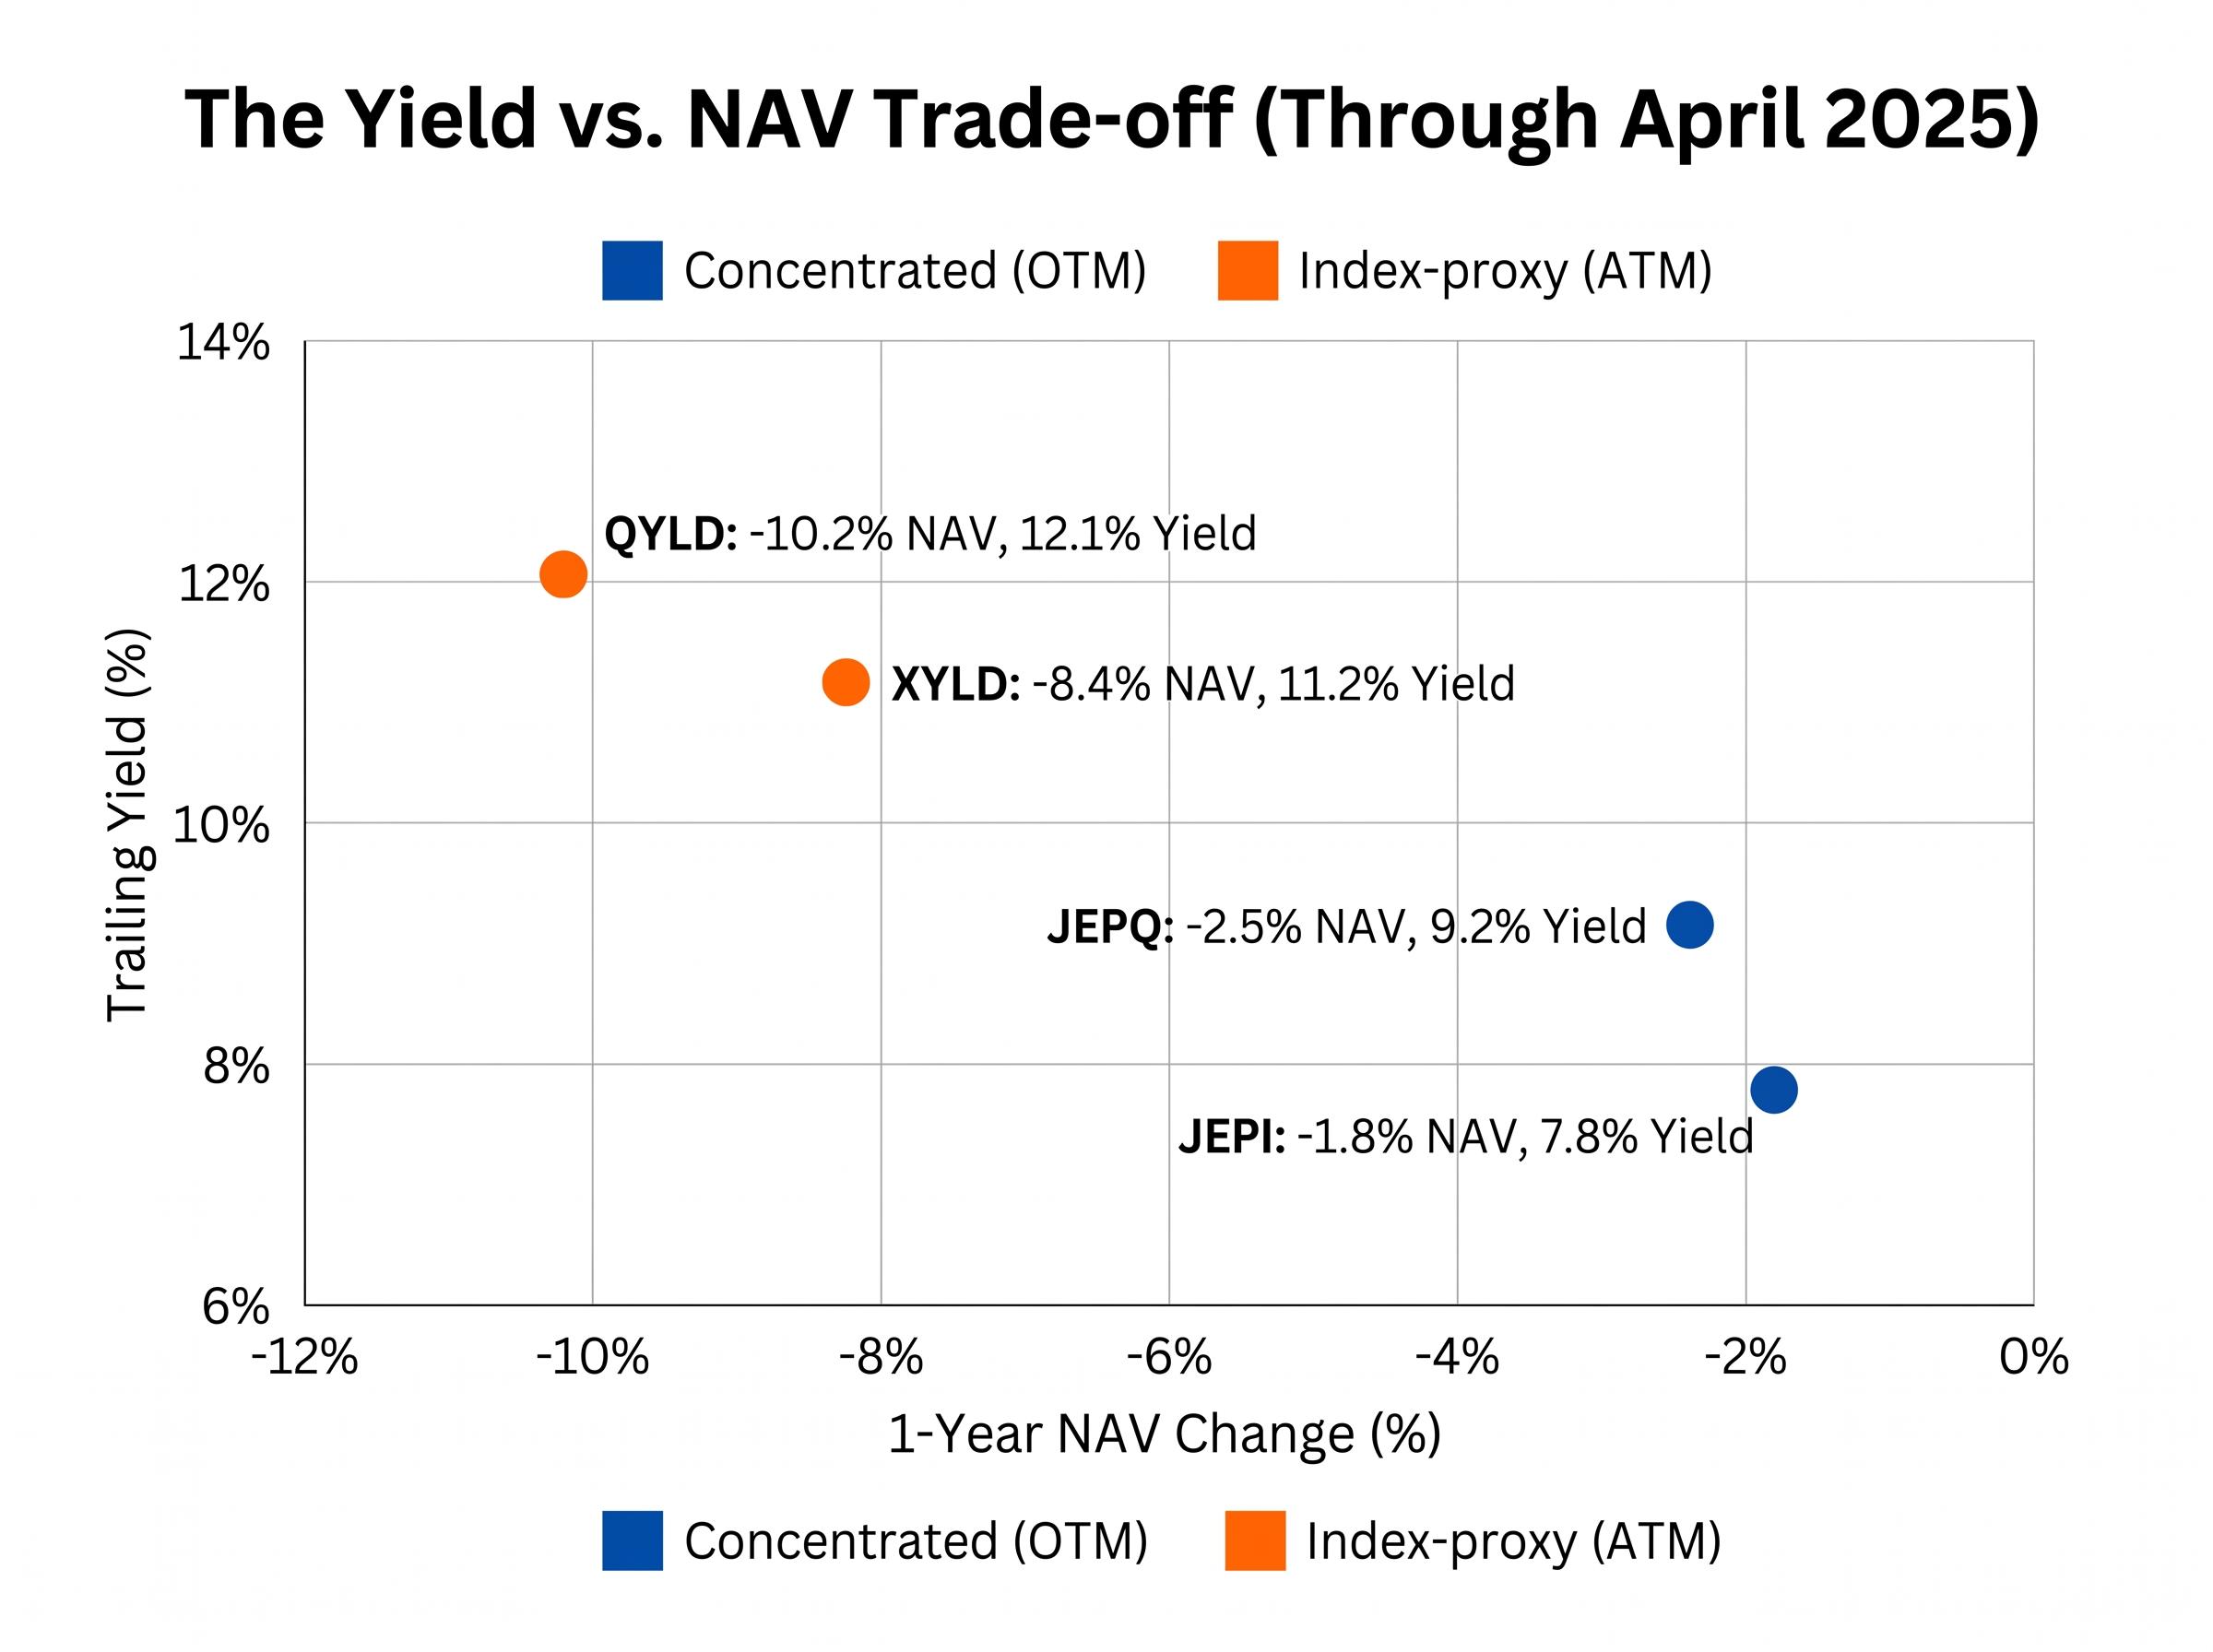
| Fund | Type | Call Structure | 1-Year NAV Change | Trailing Yield |
|---|---|---|---|---|
| JEPI | Concentrated | OTM (active) | -1.8% | 7.8% |
| JEPQ | Concentrated | OTM (active) | -2.5% | 9.2% |
| XYLD | Index-proxy | ATM (systematic) | -8.4% | 11.2% |
| QYLD | Index-proxy | ATM (systematic) | -10.2% | 12.1% |
Before selecting specific funds, it helps to have a framework for the role each position will play. Portfolio managers working with covered call ETFs increasingly categorise holdings into three tiers based on yield, NAV stability, and return-of-capital (ROC) profile. ROC refers to the portion of a fund’s distribution that represents a return of the investor’s own capital rather than income generated by the strategy.
The three tiers are:
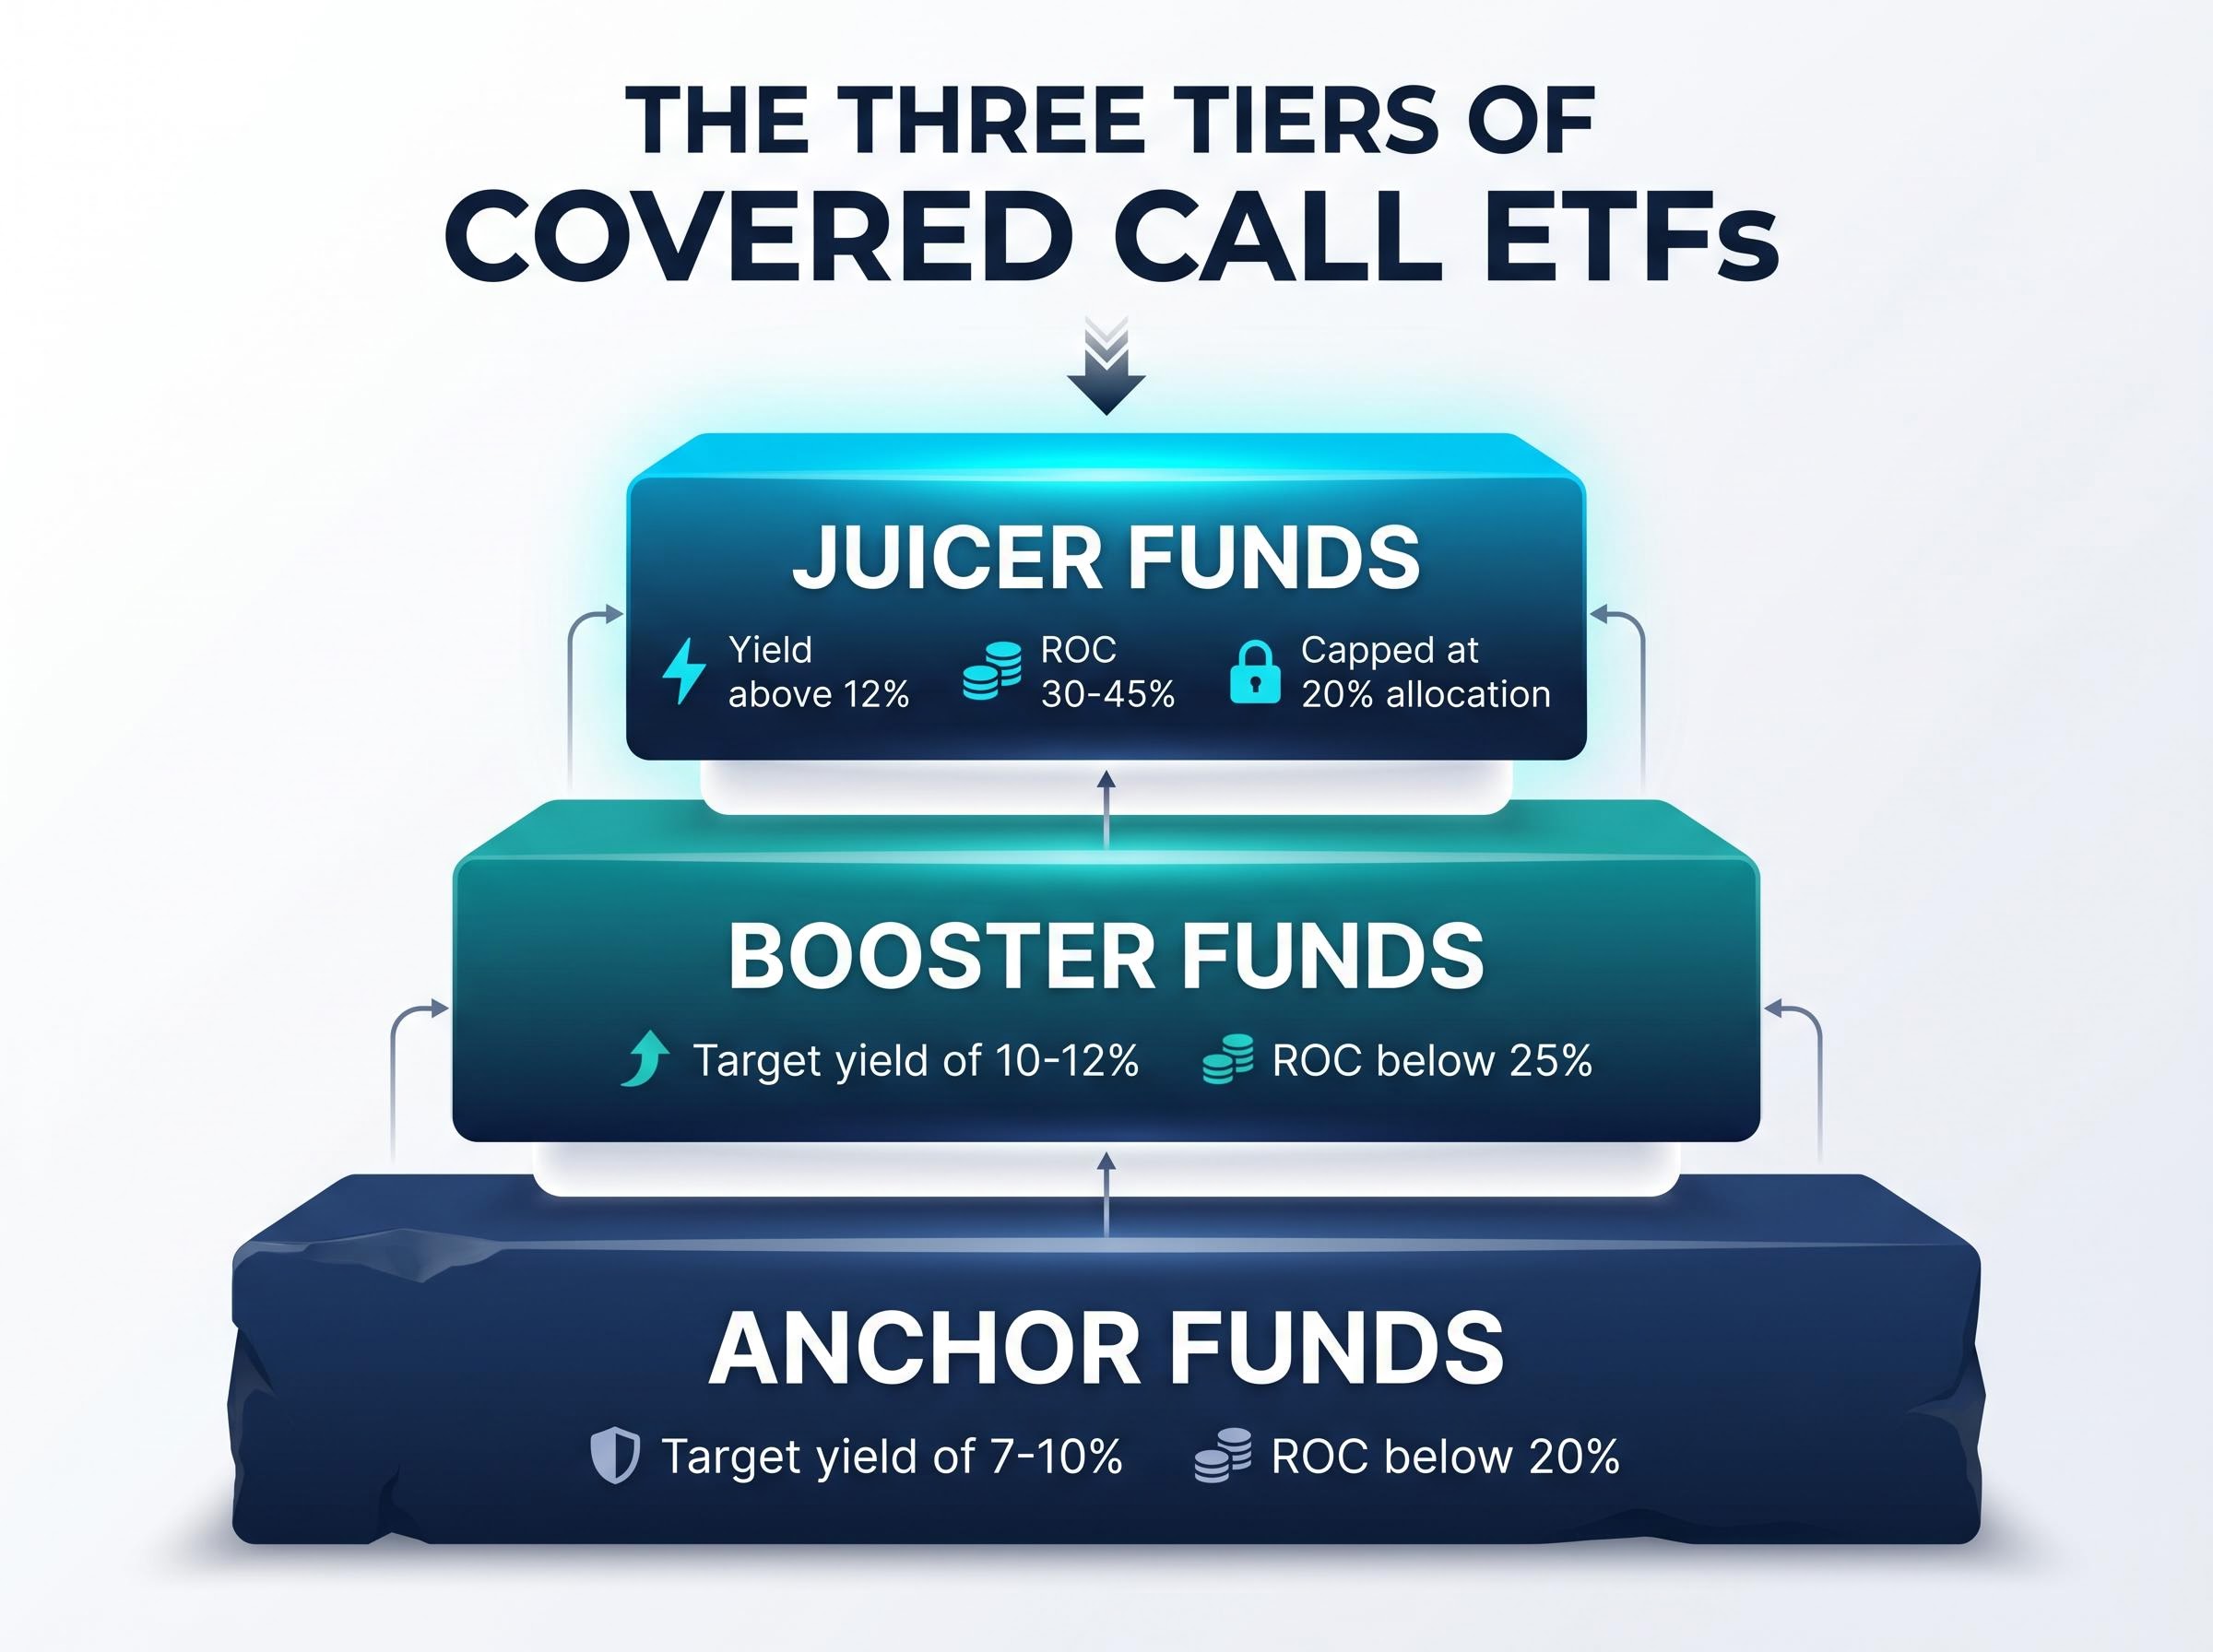
Most blended portfolios should be Anchor-heavy. The Booster and Juicer positions supplement the core rather than dominate it. The logic is straightforward: stacking too much Juicer exposure converts a portfolio’s income stream from genuine earnings into capital drawdown dressed as distributions.
Blended portfolios targeting 10-12% yield can achieve 90%+ distribution sustainability, compared with approximately 75% for pure index-proxy allocations.
This framework applies to any new covered call ETF product an investor encounters. Identify the fund’s call structure, check its ROC history, and assign it a role before deciding on allocation weight.
The Anchor/Booster/Juicer framework tells investors where to allocate. NAV sustainability diagnostics tell them when an existing position has drifted into dangerous territory. The primary diagnostic is the ROC percentage: the share of each distribution that represents a return of the investor’s own capital rather than income the strategy generated.
Four warning signs, listed in escalating order of severity, signal that a covered call ETF position requires immediate review:
XYLD reached 42% ROC in Q4 2024, meaning nearly half of every distribution paid to investors was their own capital being returned rather than income generated by the strategy.
Tracking these signals requires access to distribution composition data. For US-listed funds, Section 19(a) notices are the primary tool. These notices are required whenever a fund’s distribution includes non-income components, and they break down each payment into net investment income, realised gains, and return of capital.
The SEC Rule 19a-1 disclosure requirements mandate that funds notify shareholders whenever a distribution includes non-income components such as return of capital or realised gains, making these Section 19(a) notices the most reliable tool for investors tracking the true income composition of covered call ETF distributions.
Canadian TSX-listed funds publish equivalent distribution statements, typically on a monthly or quarterly basis. Australian-listed ETFs disclose distribution composition through Product Disclosure Statement (PDS) documentation and annual tax statements. UCITS funds listed in the UK and EU publish equivalent disclosure under MiFID II reporting requirements.
Investors who check these disclosures quarterly can catch ROC creep before it compounds into permanent capital impairment.
The framework and diagnostics provide the tools. What follows are three concrete portfolio configurations, each mapped to a distinct investor profile, with specific allocation ratios that translate principle into practice.
| Profile | Anchor | Booster | Juicer | Target Yield |
|---|---|---|---|---|
| Income-focused retiree | 60% | 25% | 15% | 8-10% |
| Growth-and-income accumulator | 50% | 30% | 20% | 9-11% |
| Tactical income enhancer | 40% | 35% | 25% | 10-12% |
The income-focused retiree prioritises capital preservation alongside income, which means the heaviest Anchor weighting and the lowest Juicer allocation. A 60/25/15 split keeps the portfolio’s NAV trajectory closely aligned with concentrated fund performance while still capturing some yield uplift from higher-tier positions.
The growth-and-income accumulator accepts moderately more erosion risk in exchange for a higher blended yield. A 50/30/20 split aligns with the expert recommendation to cap index-proxy exposure at 30-40% of total covered call allocation.
The tactical income enhancer is willing to tolerate the highest NAV volatility and requires quarterly rebalancing discipline. Even in this profile, Juicer exposure stays near the 20% cap. During the 2024 US election period, blended portfolios using this tiered approach reduced portfolio drawdown by 2-4% compared with pure index-proxy allocations.
Geographic and sector diversification strengthens any of these blends:
Through April 2025, concentrated fund portfolios delivered a YTD total return of approximately 8.55% versus approximately 7.76% for index-proxy portfolios on an equally weighted basis. The yield gap favours index-proxy; the total return gap does not.
Building the portfolio is the first decision. Maintaining it is the ongoing one, and it is where most covered call ETF investors make their costliest errors.
The central concept to understand is what advisors call the “income illusion.” High-yield index-proxy funds can appear to generate generous income while actually returning the investor’s own capital. A fund distributing 12% annually while its NAV falls 8% is not delivering 12% income. It is delivering roughly 4% in real terms and returning the rest from principal. On a $100,000 portfolio, a concentrated strategy may generate an estimated $21,000 annually in distributions compared with roughly $11,000 from an index-proxy approach, but the price appreciation differential narrows that total return gap significantly.
Index-proxy yields appear attractive on a headline basis but return capital rather than gains in many market environments.
Advisor consensus, as reported by ETF.com in February 2025, recommends targeting 8-10% blended yield to avoid 5%+ annual NAV drag. Reuters commentary from March 2025 reinforces that blended covered call strategies perform most favourably in sideways or range-bound markets. In trending bull markets, ATM index-proxy strategies systematically underperform because all upside above the strike is surrendered every expiry cycle.
Three triggers should prompt a rebalancing review:
Quarterly rebalancing using ROC disclosures as the primary signal is the standard practice for preventing capital erosion from compounding undetected.
Tax treatment can shift the effective after-tax yield of a covered call ETF by several percentage points, making wrapper selection as consequential a portfolio construction decision as fund selection itself.
The core issue is that ROC distributions, option premium income, and dividend components receive different tax treatment in every major jurisdiction. What looks like a 12% yield in one account structure may net closer to 8% in another.
| Jurisdiction | ROC Tax Treatment | Withholding Considerations | Preferred Wrapper | Key Disclosure |
|---|---|---|---|---|
| US | Tax-deferred until cost basis reaches zero, then capital gains | N/A for domestic investors | Tax-advantaged accounts (IRA, 401k) | Section 19(a) notices |
| Canada | Reduces adjusted cost base; capital gains on disposition | 15% treaty withholding on US-source distributions (non-registered); RRSP generally exempt | RRSP / TFSA | Fund distribution statements |
| Australia | Option premium income treated as ordinary income, not capital gains | US withholding applies on US-listed holdings | Superannuation / tax-advantaged | PDS documentation |
| UK | Depends on reporting fund status; may be income or capital gains | Offshore fund rules apply | ISA / SIPP | MiFID II reporting |
In the US, ROC distributions are tax-deferred until the investor’s cost basis is reduced to zero, after which they are treated as capital gains. In Canada, RRSP accounts are generally exempt from the 15% US withholding tax on US-source distributions under the Canada-US tax treaty, making them the most efficient wrapper for US-listed covered call ETFs. Australian investors face a different structure: option premium income is generally treated as ordinary income for tax purposes, and franking credit implications differ for covered call ETFs relative to direct equity ownership.
The ROCQ and ROCY tax structure represents one of the more consequential product developments for taxable-account investors: both funds use FLEX options call spreads designed to produce return-of-capital distributions, deferring tax liability until shares are sold rather than generating the ordinary income treatment that applies to JEPI and JEPQ distributions.
UK investors holding covered call ETFs through UCITS wrappers encounter additional complexity. Whether gains are classified as income or capital for HMRC purposes depends on the fund’s reporting status under offshore fund rules.
Three questions to raise with a tax adviser before finalising covered call ETF allocations:
This article is for informational purposes only and should not be considered financial advice. Investors should conduct their own research and consult with financial professionals before making investment decisions. Tax treatment varies by individual circumstance and jurisdiction; the information above reflects general principles, not personalised advice.
Yield is the input. Total return through a full cycle is the output. Blending fund types is what makes total return durable rather than illusory. The principles that hold across every market environment covered in this guide reduce to five core commitments:
Structural product innovation, from 0DTE strategies to buffer-call hybrids and active OTM management, will continue expanding the covered call ETF toolkit. These developments may refine the available options within each tier but do not change the underlying construction logic. The investor who blends deliberately, monitors ROC quarterly, and resists the pull of headline yield is the one who arrives at the end of a full market cycle with both income and capital intact.
Leveraged covered call ETFs represent one concrete example of this expanding toolkit: combining 1.25x equity exposure with a call-writing overlay produces yields exceeding 13%, though leverage amplifies drawdown risk in ways that standard covered call mechanics do not, placing them firmly in Juicer-tier territory rather than as Anchor replacements.
Past performance does not guarantee future results. Financial projections are subject to market conditions and various risk factors.
A covered call ETF strategy involves a fund holding equities and selling call options on those holdings; the premiums collected from selling those options are paid out as distributions, producing yields significantly higher than conventional equity ETFs.
At-the-money (ATM) funds like QYLD sell calls at the current index price, surrendering all upside for maximum premium income, while out-of-the-money (OTM) funds like JEPI sell calls 5-10% above the current price, collecting less premium but retaining meaningful capital appreciation potential.
Return of capital (ROC) is the portion of a fund's distribution that represents the investor's own capital being returned rather than income generated by the strategy; when ROC exceeds 30% of distributions, the fund is effectively eroding principal rather than delivering true income.
A practical framework divides funds into three tiers: Anchor funds (JEPI-type, 7-10% yield) as the core, Booster funds in the middle, and Juicer funds (QYLD-type, 12%+ yield) capped at roughly 20% of total covered call allocation to limit NAV erosion.
Quarterly rebalancing is the standard practice, using ROC disclosures as the primary signal; any position where ROC exceeds 30% or where NAV drops more than 3% in two consecutive quarters should be trimmed back to its target allocation weight.